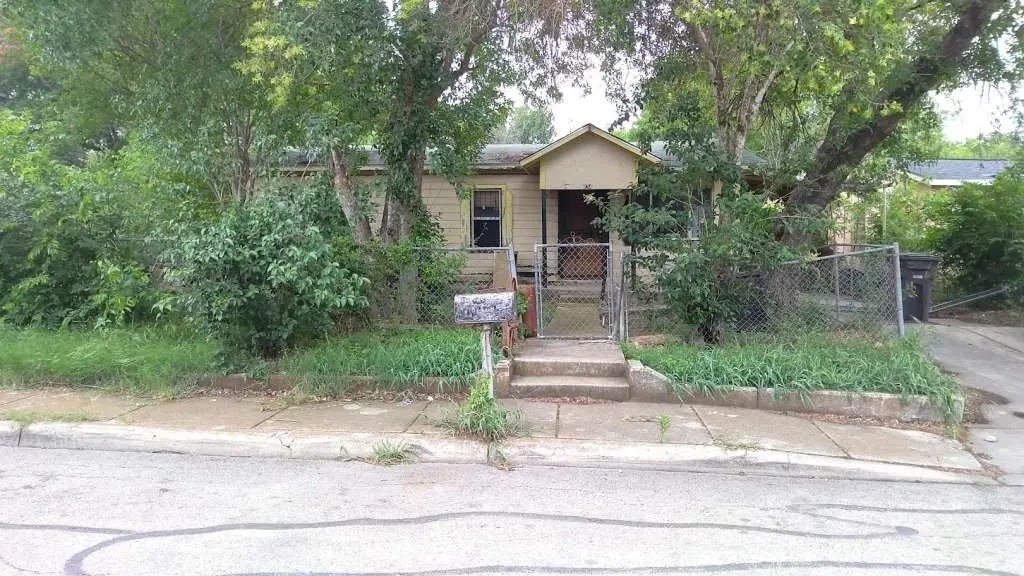
234 Doolittle St · San Antonio, TX
Flood risk 1/10 · Minimal
- FEMA flood zone
- X (unshaded)
- Chance of flooding over 30 yrs
- 0.0%
- Est. flood insurance / yr
- $507 – $1,088
Fire risk 4/10 · Minor
- Est. fire insurance / yr
- $1,222 – $2,270
Heat risk 8/10 · Major
- Hot days now (above 109°F)
- 7 days/yr
- Hot days in 30 yrs
- 22 days/yr
Wind risk 8/10 · Major
- Chance of severe wind over 30 yrs
- 80.0%
Air-quality risk 2/10 · Minimal
- Unhealthy air days now
- 0 days/yr
- Unhealthy air days in 30 yrs
- 1 days/yr
Risk factors via First Street. Map © Google.
Why this score? — see what drove the B+ grade
The composite is a weighted blend of 9 inputs, each scored 0–100. Each bar is that input's sub-score; the figure is the points it added to the 100-point composite (weight × sub-score).
- Cash flow +30.0/30.0
- ARV discount +15.0/15.0
- DSCR +10.0/10.0
- 1% rule +8.7/10.0
- Appreciation +4.8/10.0
- Livability +4.0/5.0
- Rent growth +2.5/5.0
- Condition / age +2.5/5.0
- Schools +1.4/10.0
$116,399
🖨 Deal sheet (PDF) 📄 Offer letter ✓ Due diligence
Listing remarks MLS
Discover this quaint 3-bedroom home in San Antonio, TX, tucked just inside the 410 Loop, awaiting your personal touch! Perfectly suited for those eager to invest in their first home and infuse it with their unique style. While the interior may require some renovation, its close proximity to major highways ensures easy exploration of the city. Positioned in a coveted location, you'll enjoy convenient access to all that San Antonio has to offer. Just down the street from South Park Mall and a short drive to downtown SA, where historical landmarks, upscale dining, and vibrant nightlife await. Don't let this promising opportunity slip away!
Key facts
- 7,300 sq ft lot
- 2 garage spots
- Built 1954
Tags
Neighborhood map
What this means for you Summary
Snapshot
- This is a 3-bed/2.0-bath single-family listed at $116k.
Deal economics
- At list price, monthly cash flow is $437 ($5k/yr) — positive.
- The deal already cash-flows at list — no discount required.
- Meets the 1% rule at list price ($2k rent vs $116k).
- Recommended offer: $102k (12.0% below list) — sets the bar for market timing.
- Cap rate 10.8% vs local median 3.8% in San Antonio — top-decile yield for the area; either an underpriced asset or a hidden risk that comps aren't pricing in. Stress-test before assuming the spread holds.
Location & tenants
- Location reads 80/100 on livability (#31 in TX, #1,616 nationally) — a professional / high-income tenant draw. Strengths: amenities A+, commute A+, cost of living A+; Watch: schools C-, crime F.
- South San Antonio ISD (urban): math 13% / reading 20% proficiency, ranked #804 of 826 in TX (top 97%) — low school quality limits family demand, transient renter base, plan for 1-2y turnover.
- Market conditions: 162 active listings in the ZIP; 40 comparable units currently listed for rent nearby; rentals at typical pace (median 25d on market — plan ~3-4 weeks tenant-placement turnaround); 8,308 units permitted in Bexar County in 2024 (2,506 in 5+ unit buildings).
- This rent runs 35% of the median local income ($55k/yr) — at the standard rent-burdened threshold; future hikes will face affordability resistance.
Forward outlook
- In year one you build about $282 of equity ($805 loan paydown + $-523 appreciation (-0.5% local appreciation)).
- Bexar County population projected at +50% by 2050 — long-run rental-demand tailwind backs the buy-and-hold thesis.
- At projected returns (-0.5% appreciation + 3.0% rent growth), your $33k cash investment doubles in ~6 years — after that, you're playing with house money.
Negotiation context
- It's been on market 431 days — a 12% lower offer ($102k) is reasonable based on typical stale-listing flexibility.
- 3 sale attempts since 2y ago with the ask held roughly flat each time — persistent listings suggest the price (not the market) is what's stuck; bring a comps-based counter.
Risks & watch-outs
- Watch-outs: built in 1954 — expect roof / HVAC / electrical / plumbing capex.
- Climate carrying-cost: severe wind risk, 80% chance of damaging wind over 30y; extreme-heat days projected 7→22/yr by 2055 (HVAC capex compounding) — expect insurance premiums to compound above CPI over the hold.
Questions for the listing agent
- It's been on market 431 days. Have you received any prior offers? Is the seller open to a 12% concession, seller financing, or rate buy-down credit?
- Built in 1954 — when were the roof, HVAC, electrical panel, plumbing, and water heater last replaced?
- Why hasn't it sold? Are there any deal-killer items the seller is aware of (foundation, flood, title, zoning, code violations)?
- Is there a deadline driving the sale (1031 exchange, divorce, estate, relocation)? That informs how much negotiation room exists.
- Crime grade is F in this area — have there been break-ins, vandalism, or insurance claims at this property in the last 3 years? What carrier currently insures it and at what premium?
- What's the average days-on-market for RENTAL listings here right now (not sales)? A rising rental-DOM trend means longer vacancies and softer asking-rent achievability than the comps imply.
- What's the recent tenant-quality profile in this submarket — average credit score on applications, eviction rate, late-payment / NSF rate, and stable-employment percentage? A property-management company in the area should have these aggregated.
- How much new for-sale + rental construction is in the pipeline within 1–3 miles? Heavy new supply typically softens prices + rents 12–24 months out; constrained supply supports both.
Investment metrics
- 1% rule
- 1.37% ✓
- Cap rate
- 10.80%
- Cash-on-cash
- 16.11%
- DSCR
- 1.72
- GRM
- 6.1
CMA / ARV
- ARV (median comp)
- $214,740
- List price
- $116,399
- Delta
- -45.80%
- Verdict
- UNDERPRICED
- Comps
- 20 within 1.0 mi
Show comp detail 12 sales within ~0.75 mi
| Address | Dist | Beds/Ba | Sqft | Sold | Price | $/sf | Match |
|---|---|---|---|---|---|---|---|
| 147 Bradley | 0.18mi | 3/2.0 | 1,439 (-5%) | 2mo | $205,000 | $142 | 81 |
| 322 Spaatz | 0.15mi | 3/2.0 | 1,391 (-8%) | 4mo | $254,900 | $183 | 75 |
| 3386 Aragon Dr | 0.59mi | 3/2.0 | 1,557 (+3%) | 2mo | $140,000 | $90 | 67 |
| 218 Spaatz St | 0.06mi | 3/2.0 | 1,292 (-15%) | 17mo | $235,000 | $182 | 58 |
| 9135 Ozalid | 0.45mi | 3/2.0 | 1,298 (-14%) | 6mo | $205,000 | $158 | 50 |
| 3218 Coconino Dr | 0.41mi | 3/1.5 | 1,324 (-13%) | 12mo | $190,000 | $144 | 48 |
| 3315 Avoca Dr | 0.69mi | 3/2.0 | 1,430 (-6%) | 15mo | $250,000 | $175 | 46 |
| 2223 Abacus St | 0.67mi | 4/2.0 (+1) | 1,496 (-1%) | 20mo | $219,700 | $147 | 45 |
| 3258 Twining | 0.60mi | 4/2.0 (+1) | 1,357 (-10%) | 12mo | $190,000 | $140 | 40 |
| 3102 Coconino Dr | 0.41mi | 3/1.5 | 1,287 (-15%) | 21mo | $219,000 | $170 | 36 |
| 3002 Kiowa St | 0.75mi | 4/2.0 (+1) | 1,564 (+3%) | 23mo | $150,000 | $96 | 36 |
| 2519 Patron | 0.74mi | 3/2.0 | 1,310 (-14%) | 13mo | $215,000 | $164 | 32 |
Match score weights: distance 35% · size 25% · config 20% · recency 20%. Top-matched comps best support the ARV.
Projected returns pro-forma
-0.45% appreciation · 3.0% rent growth · sell at horizon
- IRR
- 14.5%
- Equity multiple
- 1.68×
- Total profit
- $22,058
- Equity at exit
- $31,208
- IRR
- 19.6%
- Equity multiple
- 3.08×
- Total profit
- $67,808
- Equity at exit
- $35,505
Cash invested: $32,592 (down + closing). Projections, not guarantees.
Landlord ↔ Tenant lean methodology
- Overall (STATE)
- 87 Strongly Landlord-Friendly
- State Texas
- 87 Strongly Landlord-Friendly · R+5
- County
- — inherits STATE
- City
- — inherits STATE
ZIP-level market 78211
- Home prices YoY
- -0.2%
- Active inventory
- 162
- Price-to-rent
- 6.1×
Monthly cashflow live
- Estimated rent
- $1,597 high interval (Pro) →
- Mortgage (P&I)
- −$610
- Tax from tax record
- −$165 /mo · $1,985/yr
- Insurance
- −$48
- HOA
- −$0
- Vacancy / Maint / Mgmt
- −$335
- Net cashflow
- $437
Break-even live
Sensitivity live
| Price | -10% $503 | -5% $470 | +0% $437 | +5% $405 | +10% $372 |
|---|---|---|---|---|---|
| Rent | -10% $311 | -5% $374 | +0% $437 | +5% $501 | +10% $564 |
| Rate | -1.0pp $496 | -0.5pp $467 | base $437 | +0.5pp $407 | +1.0pp $377 |
UW: 25.0% down · 7.5% · 30yr · 1.5% tax · 5.0% vac · 8.0% maint · 8.0% mgmt
Financing live
Cash to close
- Down payment
- $29,100
- Closing costs
- $3,492
- Reserves months
- —
- Total cash needed
- —
Loan-product check · same deal, 3 products live
Conventional
25% down · 7.5% · 30yr
- Down + closing
- —
- Monthly P&I
- —
- Monthly cashflow
- —
- DSCR
- —
- Eligible?
- —
Personal DTI + credit; lowest rate.
DSCR
20% down · 8.5% · 30yr
- Down + closing
- —
- Monthly P&I
- —
- Monthly cashflow
- —
- DSCR
- —
- Eligible?
- —
No personal income docs; deal must DSCR.
Hard money
10% down · 12.0% · 12mo
- Down + closing
- —
- Monthly P&I
- —
- Monthly cashflow
- —
- DSCR
- —
- Eligible?
- —
Short-term bridge; refi at stabilization.
Rent comps 40 comps
| Address | Beds | Baths | Sqft | Rent | $/sqft | DOM | Units | Dist |
|---|---|---|---|---|---|---|---|---|
| 9018 Chaminade Dr San Antonio, TX | 3.0 | 1.5 | 1056 | $1,675 | $1.59 | 45d | 1 | 0.60mi |
| 3439 Twining Dr San Antonio, TX | 3.0 | 1.0 | 1124 | $1,500 | $1.33 | 19d | 1 | 0.67mi |
| 3723 Somers Crst San Antonio, TX | 3.0 | 2.5 | 1529 | $1,650 | $1.08 | 45d | 1 | 0.72mi |
| 3411 Avoca Dr San Antonio, TX | 3.0 | 2.0 | 1426 | $1,460 | $1.02 | 19d | 1 | 0.73mi |
| 3411 Avoca Dr San Antonio, TX | 3.0 | 2.0 | 1426 | $1,460 | $1.02 | 5d | 1 | 0.73mi |
| 3811 Somers Crst San Antonio, TX | 3.0 | 2.5 | 1529 | $1,650 | $1.08 | 45d | 1 | 0.76mi |
| 9306 Somers Bnd San Antonio, TX | 3.0 | 2.5 | 1420 | $1,600 | $1.13 | 25d | 1 | 0.81mi |
| 3727 Aragon Dr San Antonio, TX | 3.0 | 1.0 | 1060 | $1,400 | $1.32 | 45d | 1 | 0.83mi |
| 9334 Somers Bnd San Antonio, TX | 3.0 | 2.5 | 1272 | $1,515 | $1.19 | 5d | 1 | 0.84mi |
| 9402 Somers Bnd San Antonio, TX | 3.0 | 2.5 | 1529 | $1,600 | $1.05 | 12d | 1 | 0.85mi |
| 9435 Dogwood Hl San Antonio, TX | 3.0 | 2.5 | 1529 | $1,600 | $1.05 | 45d | 1 | 0.86mi |
| 9407 Somers Bnd San Antonio, TX | 3.0 | 2.5 | 1310 | $1,525 | $1.16 | 25d | 1 | 0.87mi |
| 9422 Somers Bnd San Antonio, TX | 3.0 | 2.5 | 1419 | $1,575 | $1.11 | 45d | 1 | 0.87mi |
| 12305 SW Loop 410 San Antonio, TX | 1.0–4.0 | 1.0–2.0 | 1036 | $1,318 | $1.27 | 17d | 1 | 0.89mi |
| 4007 Somers Crst San Antonio, TX | 3.0 | 2.0 | 1242 | $1,525 | $1.23 | 5d | 1 | 0.89mi |
| 9427 Somers Bnd San Antonio, TX | 3.0 | 2.5 | 1950 | $1,650 | $0.85 | 45d | 1 | 0.90mi |
| 10127 State Highway 16 S San Antonio, TX | 2.0–4.0 | 2.0 | 1125 | $1,200 | $1.07 | 4d | 26 | 0.91mi |
| 9419 Trap Rock Dr San Antonio, TX | 4.0 | 2.5 | 2126 | $1,750 | $0.82 | 5d | 1 | 0.93mi |
| 3331 Rosita Way San Antonio, TX | 3.0 | 2.5 | 1848 | $1,800 | $0.97 | 45d | 1 | 0.93mi |
| 9419 Graze Br San Antonio, TX | 3.0 | 2.0 | 1242 | $1,550 | $1.25 | 19d | 1 | 0.97mi |
| 9257 Somerset Rd Unit 710 San Antonio, TX | 2.0 | 2.0 | 1133 | $1,173 | $1.04 | 4d | 1 | 1.00mi |
| 10119 Jardin Verde San Antonio, TX | 3.0 | 2.5 | 1944 | $1,750 | $0.90 | 45d | 1 | 1.04mi |
| 3263 Rancho Grande San Antonio, TX | 3.0 | 2.0 | 1500 | $1,650 | $1.10 | 25d | 1 | 1.04mi |
| 3434 Hacienda Way San Antonio, TX | 4.0 | 2.5 | 2141 | $2,000 | $0.93 | 23d | 1 | 1.04mi |
| 3434 Hacienda Way San Antonio, TX | 4.0 | 2.5 | 2141 | $1,900 | $0.89 | 17d | 1 | 1.04mi |
| 3810 Kurz Plz S San Antonio, TX | 3.0 | 2.0 | 1266 | $550 | $0.43 | 25d | 1 | 1.07mi |
| 3322 Rancho Grande San Antonio, TX | 4.0 | 2.5 | 2094 | $1,895 | $0.90 | 12d | 1 | 1.08mi |
| 3911 Bates Pl San Antonio, TX | 3.0 | 2.0 | 1200 | $1,450 | $1.21 | 25d | 1 | 1.11mi |
| 3910 Poteet Pl San Antonio, TX | 4.0 | 2.0 | 1880 | $1,525 | $0.81 | 45d | 1 | 1.11mi |
| 1243 Gillette Blvd San Antonio, TX | 3.0 | 2.0 | 1456 | $1,500 | $1.03 | 25d | 1 | 1.15mi |
| 10414 Espada Pass San Antonio, TX | 3.0 | 2.0 | 1416 | $1,600 | $1.13 | 45d | 1 | 1.22mi |
| 9122 Campbell Way San Antonio, TX | 3.0 | 2.0 | 1354 | $1,495 | $1.10 | 4d | 1 | 1.26mi |
| 4039 Imogene Ivy San Antonio, TX | 3.0 | 2.0 | 1200 | $1,550 | $1.29 | 25d | 1 | 1.26mi |
| 4111 Imogene Ivy San Antonio, TX | 3.0 | 2.0 | 1276 | $1,700 | $1.33 | 4d | 1 | 1.31mi |
| 2350 Redlove Dr San Antonio, TX | 3.0 | 2.5 | 1420 | $1,675 | $1.18 | 25d | 1 | 1.32mi |
| 11327 Clearmine San Antonio, TX | 3.0 | 2.5 | 1362 | $1,650 | $1.21 | 3d | 2 | 1.33mi |
| 2330 Redlove Dr San Antonio, TX | 3.0 | 2.5 | 1420 | $1,600 | $1.13 | 5d | 1 | 1.34mi |
| 2343 Applewhite Mdw San Antonio, TX | 4.0 | 2.5 | 1798 | $1,795 | $1.00 | 25d | 1 | 1.35mi |
| 2335 Applewhite Mdw San Antonio, TX | 3.0 | 2.5 | 1529 | $1,550 | $1.01 | 5d | 1 | 1.36mi |
| 2115 Bigmouth Rod San Antonio, TX | 4.0 | 2.5 | 1847 | $1,755 | $0.95 | 45d | 1 | 1.37mi |
Listing history 21 events
-
2026-06-21days on market $116,399 Active 431 DOM
-
2026-06-18days on market $116,399 Active 428 DOM
-
2026-06-17days on market $116,399 Active 427 DOM
-
2026-06-16days on market $116,399 Active 426 DOM
-
2026-06-15days on market $116,399 Active 425 DOM
-
2026-06-13days on market $116,399 Active 423 DOM
-
2026-06-09days on market $116,399 Active 419 DOM
-
2026-06-08days on market $116,399 Active 418 DOM
-
2026-06-07days on market $116,399 Active 417 DOM
-
2026-06-04days on market $116,399 Active 414 DOM
-
2026-06-03days on market $116,399 Active 413 DOM
-
2026-06-02days on market $116,399 Active 412 DOM
-
2026-06-01days on market $116,399 Active 411 DOM
-
2026-05-31days on market $116,399 Active 410 DOM
-
2025-06-25status Back on Market 644-char remark
Show marketing remark (644 chars)
Discover this quaint 3-bedroom home in San Antonio, TX, tucked just inside the 410 Loop, awaiting your personal touch! Perfectly suited for those eager to invest in their first home and infuse it with their unique style. While the interior may require some renovation, its close proximity to major highways ensures easy exploration of the city. Positioned in a coveted location, you'll enjoy convenient access to all that San Antonio has to offer. Just down the street from South Park Mall and a short drive to downtown SA, where historical landmarks, upscale dining, and vibrant nightlife await. Don't let this promising opportunity slip away!
-
2025-04-30historical 644-char remark
Show marketing remark (644 chars)
Discover this quaint 3-bedroom home in San Antonio, TX, tucked just inside the 410 Loop, awaiting your personal touch! Perfectly suited for those eager to invest in their first home and infuse it with their unique style. While the interior may require some renovation, its close proximity to major highways ensures easy exploration of the city. Positioned in a coveted location, you'll enjoy convenient access to all that San Antonio has to offer. Just down the street from South Park Mall and a short drive to downtown SA, where historical landmarks, upscale dining, and vibrant nightlife await. Don't let this promising opportunity slip away!
-
2025-04-16$116,399 Active 842-char remark
Show marketing remark (842 chars)
INSIDE 410 LOOP! Discover this quaint 3-bedroom home in San Antonio, TX, tucked just inside the 410 Loop, awaiting your personal touch! Perfectly suited for those eager to invest in their first home and infuse it with their unique style. While the interior may require some renovation, its close proximity to major highways ensures easy exploration of the city. Positioned in a coveted location, you'll enjoy convenient access to all that San Antonio has to offer. Just down the street from South Park Mall and a short drive to downtown SA, where historical landmarks, upscale dining, and vibrant nightlife await. WE MAKE IT EASY TO OWN. This is a great opportunity! Don't wait, call us today to get more information on the owner's easy terms and smooth process that can may be able to put the deed in your name and make this your dream home.
-
2024-09-12price $116,399 644-char remark
Show marketing remark (644 chars)
Discover this quaint 3-bedroom home in San Antonio, TX, tucked just inside the 410 Loop, awaiting your personal touch! Perfectly suited for those eager to invest in their first home and infuse it with their unique style. While the interior may require some renovation, its close proximity to major highways ensures easy exploration of the city. Positioned in a coveted location, you'll enjoy convenient access to all that San Antonio has to offer. Just down the street from South Park Mall and a short drive to downtown SA, where historical landmarks, upscale dining, and vibrant nightlife await. Don't let this promising opportunity slip away!
-
2024-04-24$119,999 New 644-char remark
Show marketing remark (644 chars)
Discover this quaint 3-bedroom home in San Antonio, TX, tucked just inside the 410 Loop, awaiting your personal touch! Perfectly suited for those eager to invest in their first home and infuse it with their unique style. While the interior may require some renovation, its close proximity to major highways ensures easy exploration of the city. Positioned in a coveted location, you'll enjoy convenient access to all that San Antonio has to offer. Just down the street from South Park Mall and a short drive to downtown SA, where historical landmarks, upscale dining, and vibrant nightlife await. Don't let this promising opportunity slip away!
-
2020-05-06soldstatus
-
2020-05-06soldstatus
ⓘ Source: listings_history table (triggers on properties + properties_extension) + one-shot
backfill from property_details.listing_events for pre-trigger history.
Tax reassessment forecast TX · Resets to sale price
- Current annual tax
- $1,985 · $165/mo
- Projected year-2 tax
- $2,130 · $178/mo
- Expected delta
- +$145/yr (+$12/mo · 7.3%)
ⓘ Screening estimate from a state-policy table — verify with the county assessor before closing.
Climate risk First Street
- Flood 1/10 Low FEMA zone X (unshaded) · 0% chance over 30 yrs
- Wildfire 4/10 Moderate
- Heat 8/10 Severe 7 d/yr ≥109°F today · 22 d/yr by 30 yrs out
- Wind 8/10 Severe 80% chance of damaging wind over 30 yrs
- Air quality 2/10 Low 0 unhealthy d/yr today · 1 by 30 yrs out
Nearby sold comps map
Loading sold comps map…
Walkable amenities ~0.75 mi
Loading nearby amenities…
Taxation est. · year 1
- Rental income
- $19,166
- − Mortgage interest
- −$6,520
- − Property taxes
- −$1,985
- − Insurance
- −$582
- − Repairs & maintenance
- −$1,533
- − Management
- −$1,533
- − Depreciation
- −$3,386
- Taxable income
- $3,626
- Est. tax owed @ 24.0%
- −$870
- After-tax cash flow
- $4,379/yr
For passive investors: Depreciation is non-cash, so a rental often shows a tax loss while cash-flowing — sheltering income. Rental losses are passive: they offset passive income freely, and up to $25,000/yr can offset ordinary (W-2) income if you actively participate and your MAGI is under $100k (phasing out to $0 by $150k); unused losses carry forward. On sale, claimed depreciation is recaptured at up to 25%, and gains may owe capital-gains tax (a 1031 exchange can defer both). Figures are a year-1 estimate at your 24.0% rate — not tax advice; consult a CPA.
Schools (NCES district)
- District
- South San Antonio ISD
- NCES district ID
- 4840680
- Math proficiency
- 13% ▼ -20.00%
- Reading proficiency
- 20% ▼ -10.00%
- Median HH income
- $35,460
- Composite
- 13.6/100
- National rank
- #9511
- State rank
- #804 of 826 in TX
Livability — San Antonio
- Score
- 80/100
- State rank
- #31
- US rank
- #1616
Category grades
Schools grade is shown separately in the Schools card above.
Census & demographics
- Census place
- San Antonio, TX
- County
- Bexar County · 1,990,555 people
- City population
- 1,806,925
- Metro
- San Antonio-New Braunfels, TX
- Population (ZIP)
- 30,857
- Household income
- $55,436
- Rent vs Own
- Severe rent burden
- 729.0
Population outlook (Bexar County) Hauer SSP2
- Today (2025)
- 2,336,851 people
- By 2030
- 2,560,728 · +9.6%
- By 2040
- 3,020,569 · +29.3%
- By 2050
- 3,493,522 · +49.5%
- By 2075
- 4,668,459 · +99.8%
- By 2100
- 5,533,242 · +136.8%
Race, ethnicity, and origin ACS 2023
- Neighborhood character
- Predominantly Hispanic (93%)
- Race & ethnicity
- Hispanic / Latino 93% Two or more races 30% White 5% Black 1% Native American 1%
- Hispanic origin (detail)
- Mexican 76%
- Foreign-born
- 18% · Canada
- Languages at home
- 35% English-only · Spanish 65%
Political lean MEDSL · Bexar
- 2024 margin
- Lean D (+9.8) · D 54.3% · R 44.6% · Other 1.1%
- 2008→2024 swing
- +4.2pp toward D · 2008: 5.6pp · 2024: 9.8pp
- All cycles
- 2024: D+9.8 2020: D+18.2 2016: D+13.5 2012: D+4.6 2008: D+5.6
Not yet ingested
- Civics
- —
Market trends
- HPI YoY
- ▼ -0.45%
- Current HPI
- 241.1709
- Rent YoY
- —
- Metro
- San Antonio-New Braunfels, TX
- State GDP YoY
- ▲ 3.95%
- F500 in state
- 110
Industry mix (Fortune 500 HQ in TX)
| Industry | F500 HQs | Revenue |
|---|---|---|
| Energy | 16 | $1,198B |
|
||
| Technology | 5 | $198B |
|
||
| Engineering / Construction | 4 | $72B |
|
||
| Energy Services | 3 | $60B |
|
||
| Utilities | 3 | $41B |
|
||
| Healthcare | 2 | $330B |
|
||
Price history
-3.0% since first listed7 events — show timeline
- 2025-06-25 Relisted — LERA
- 2025-04-30 Listing Removed — LERA
- 2025-04-16 Listed $116,399 HARMLS
- 2024-09-12 Price Changed $116,399 LERA
- 2024-04-24 Listed $119,999 LERA
- 2020-05-06 Sold (Public Records) — Public Records
- 2020-05-06 Sold (Public Records) — Public Records
Property tax history
+3.7%/yrLatest (2025): $1,985 · -40.7% YoY. Source: county tax records.
Cash-flow waterfall
monthlySold comps — $/sqft
last 12 mo · ≤1 miLoading sold comps…