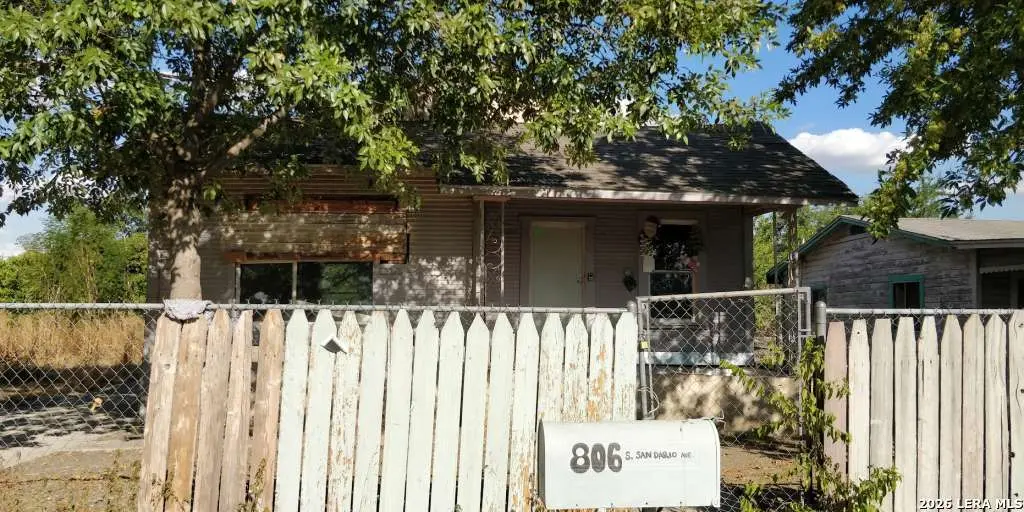
806 S San Dario Ave · San Antonio, TX
Flood risk 1/10 · Minimal
- FEMA flood zone
- X (unshaded)
- Chance of flooding over 30 yrs
- 0.0%
- Est. flood insurance / yr
- $507 – $1,088
Fire risk 1/10 · Minimal
- Est. fire insurance / yr
- $1,222 – $2,270
Heat risk 8/10 · Major
- Hot days now (above 108°F)
- 7 days/yr
- Hot days in 30 yrs
- 22 days/yr
Wind risk 7/10 · Major
- Chance of severe wind over 30 yrs
- 78.0%
Air-quality risk 2/10 · Minimal
- Unhealthy air days now
- 1 days/yr
- Unhealthy air days in 30 yrs
- 1 days/yr
Risk factors via First Street. Map © Google.
Why this score? — see what drove the B grade
The composite is a weighted blend of 9 inputs, each scored 0–100. Each bar is that input's sub-score; the figure is the points it added to the 100-point composite (weight × sub-score).
- Cash flow +30.0/30.0
- 1% rule +10.0/10.0
- DSCR +10.0/10.0
- ARV discount +7.5/15.0
- Appreciation +5.0/10.0
- Livability +4.0/5.0
- Rent growth +2.5/5.0
- Condition / age +2.5/5.0
- Schools +1.3/10.0
$59,999
🖨 Deal sheet (PDF) 📄 Offer letter ✓ Due diligence
Listing remarks
Welcome to 806 S San Dario Ave! This single-family home contains 901 Sq. Ft. of living space and is tucked away in a great location. It boasts 2 spacious bedrooms and 1 bathroom. It does need a bit of fixing up and TLC, but it can easily be transformed into a terrific place that you and your family can have a home. This property has updates including foundation repairs and a brand-new roof. The location is incredibly close to Commerce St which will give you easy access to HWY 151 and other main highways. Downtown San Antonio is also just minutes away! Don't wait on this great investment.
Key facts
- 6,534 sq ft lot
- Garage
- Built 1940
Property features AI
Finance
- Financial info: Down payment resources available
- HOA & community: Subdivision: LAWN
Exterior
- Parking: Side-entry parking
- Utilities: City water/sewer
- Home design: Pre-owned property; Approximate age: 86 years
- Construction: Composition roof
- Exterior features: Wood and siding exterior
Interior
- Kitchen: Kitchen approximately 10 x 12
- Bedrooms: Master bedroom on lower level (12 x 12); Second bedroom (10 x 10)
- Flooring: Vinyl flooring
- Bathrooms: 1 full bathroom
- Heating & cooling: Other heating (see remarks); Other heating fuel (see remarks); Other air conditioning (see remarks)
- Interior features: Living/dining room combination; All bedrooms located downstairs
Neighborhood map
What this means for you Summary
Snapshot
- This is a 3-bed/1.0-bath single-family listed at $60k.
Deal economics
- At list price, monthly cash flow is $673 ($8k/yr) — positive.
- The deal already cash-flows at list — no discount required.
- Meets the 1% rule at list price ($1k rent vs $60k).
- Recommended offer: $53k (12.0% below list) — sets the bar for market timing.
- Cap rate 19.8% vs local median 3.8% in San Antonio — top-decile yield for the area; either an underpriced asset or a hidden risk that comps aren't pricing in. Stress-test before assuming the spread holds.
Location & tenants
- Location reads 80/100 on livability (#31 in TX, #1,616 nationally) — a professional / high-income tenant draw. Strengths: amenities A+, commute A+, cost of living A+; Watch: crime F.
- Edgewood ISD (urban): math 12% / reading 21% proficiency, ranked #812 of 826 in TX (top 98%) — low school quality limits family demand, transient renter base, plan for 1-2y turnover.
- Zoned schools: Las Palmas Leadership School For Girls (229 students, 91% FRL, charter) — zoned schools average 91% FRL vs 24% district-wide (66 pts higher); higher-poverty schools than district average — tighter screening recommended.
- Market conditions: 1 active listings in the ZIP; 2 comparable units currently listed for rent nearby; 8,308 units permitted in Bexar County in 2024 (2,506 in 5+ unit buildings).
Forward outlook
- In year one you build about $2k of equity ($415 loan paydown + $2k appreciation (3.0% local appreciation)).
- Bexar County population projected at +50% by 2050 — long-run rental-demand tailwind backs the buy-and-hold thesis.
- At projected returns (3.0% appreciation + 3.0% rent growth), your $17k cash investment doubles in ~2 years — after that, you're playing with house money.
Negotiation context
- It's been on market 785 days — a 12% lower offer ($53k) is reasonable based on typical stale-listing flexibility.
- 4 sale attempts since 5y ago; this cycle's ask has dropped $50k (45%) from the opening price — seller is motivated, your offer sets the floor, not the list.
Risks & watch-outs
- Watch-outs: built in 1940 — expect roof / HVAC / electrical / plumbing capex.
- Climate carrying-cost: major wind risk, 78% chance of damaging wind over 30y; extreme-heat days projected 7→22/yr by 2055 (HVAC capex compounding) — expect insurance premiums to compound above CPI over the hold.
Questions for the listing agent
- It's been on market 785 days. Have you received any prior offers? Is the seller open to a 12% concession, seller financing, or rate buy-down credit?
- Built in 1940 — when were the roof, HVAC, electrical panel, plumbing, and water heater last replaced?
- Why hasn't it sold? Are there any deal-killer items the seller is aware of (foundation, flood, title, zoning, code violations)?
- Is there a deadline driving the sale (1031 exchange, divorce, estate, relocation)? That informs how much negotiation room exists.
- Crime grade is F in this area — have there been break-ins, vandalism, or insurance claims at this property in the last 3 years? What carrier currently insures it and at what premium?
- What's the average days-on-market for RENTAL listings here right now (not sales)? A rising rental-DOM trend means longer vacancies and softer asking-rent achievability than the comps imply.
- What's the recent tenant-quality profile in this submarket — average credit score on applications, eviction rate, late-payment / NSF rate, and stable-employment percentage? A property-management company in the area should have these aggregated.
- How much new for-sale + rental construction is in the pipeline within 1–3 miles? Heavy new supply typically softens prices + rents 12–24 months out; constrained supply supports both.
Investment metrics
- 1% rule
- 2.28% ✓
- Cap rate
- 19.76%
- Cash-on-cash
- 48.10%
- DSCR
- 3.14
- GRM
- 3.6
CMA / ARV
No comps found within radius.
Projected returns pro-forma
3.0% appreciation · 3.0% rent growth · sell at horizon
- IRR
- 53.3%
- Equity multiple
- 3.98×
- Total profit
- $50,132
- Equity at exit
- $26,978
- IRR
- 52.9%
- Equity multiple
- 8.05×
- Total profit
- $118,396
- Equity at exit
- $41,577
Cash invested: $16,800 (down + closing). Projections, not guarantees.
Landlord ↔ Tenant lean methodology
- Overall (STATE)
- 87 Strongly Landlord-Friendly
- State Texas
- 87 Strongly Landlord-Friendly · R+5
- County
- — inherits STATE
- City
- — inherits STATE
ZIP-level market 78237-2945
- Active inventory
- 1
- Price-to-rent
- 3.6×
Monthly cashflow live
- Estimated rent
- $1,371 medium interval (Pro) →
- Mortgage (P&I)
- −$315
- Tax from tax record
- −$70 /mo · $840/yr
- Insurance
- −$25
- HOA
- −$0
- Vacancy / Maint / Mgmt
- −$288
- Net cashflow
- $673
Break-even live
Sensitivity live
| Price | -10% $707 | -5% $690 | +0% $673 | +5% $656 | +10% $639 |
|---|---|---|---|---|---|
| Rent | -10% $565 | -5% $619 | +0% $673 | +5% $728 | +10% $782 |
| Rate | -1.0pp $704 | -0.5pp $689 | base $673 | +0.5pp $658 | +1.0pp $642 |
UW: 25.0% down · 7.5% · 30yr · 1.5% tax · 5.0% vac · 8.0% maint · 8.0% mgmt
Financing live
Cash to close
- Down payment
- $15,000
- Closing costs
- $1,800
- Reserves months
- —
- Total cash needed
- —
Loan-product check · same deal, 3 products live
Conventional
25% down · 7.5% · 30yr
- Down + closing
- —
- Monthly P&I
- —
- Monthly cashflow
- —
- DSCR
- —
- Eligible?
- —
Personal DTI + credit; lowest rate.
DSCR
20% down · 8.5% · 30yr
- Down + closing
- —
- Monthly P&I
- —
- Monthly cashflow
- —
- DSCR
- —
- Eligible?
- —
No personal income docs; deal must DSCR.
Hard money
10% down · 12.0% · 12mo
- Down + closing
- —
- Monthly P&I
- —
- Monthly cashflow
- —
- DSCR
- —
- Eligible?
- —
Short-term bridge; refi at stabilization.
Rent comps 2 comps
| Address | Beds | Baths | Sqft | Rent | $/sqft | DOM | Units | Dist |
|---|---|---|---|---|---|---|---|---|
| 2311 Potosi St San Antonio, TX | 3.0 | 1.0 | 864 | $1,600 | $1.85 | 44d | 1 | 1.36mi |
| 1823 San Carlos St San Antonio, TX | 3.0 | 2.0 | 1090 | $1,099 | $1.01 | 2d | 1 | 1.39mi |
Listing history 16 events
-
2026-06-21days on market $59,999 Active 785 DOM
-
2026-06-18days on market $59,999 Active 783 DOM
-
2026-06-17days on market $59,999 Active 782 DOM
-
2026-06-16days on market $59,999 Active 781 DOM
-
2026-06-15days on market $59,999 Active 780 DOM
-
2026-06-13days on market $59,999 Active 778 DOM
-
2026-06-12days on market $59,999 Active 777 DOM
-
2026-06-09days on market $59,999 Active 774 DOM
-
2026-06-08days on market $59,999 Active 773 DOM
-
2026-06-08days on market $59,999 Active 772 DOM
-
2026-06-07days on market $59,999 Active 771 DOM
-
2026-06-03days on market $59,999 Active 768 DOM
-
2026-06-02days on market $59,999 Active 767 DOM
-
2026-06-01days on market $59,999 Active 766 DOM
-
2026-05-31remarks 594-char remark
-
2026-05-31$59,999 Active 765 DOM
ⓘ Source: listings_history table (triggers on properties + properties_extension) + one-shot
backfill from property_details.listing_events for pre-trigger history.
Tax reassessment forecast TX · Resets to sale price
- Current annual tax
- $840 · $70/mo
- Projected year-2 tax
- $1,098 · $91/mo
- Expected delta
- +$258/yr (+$21/mo · 30.6%)
ⓘ Screening estimate from a state-policy table — verify with the county assessor before closing.
Climate risk First Street
- Flood 1/10 Low FEMA zone X (unshaded) · 0% chance over 30 yrs
- Wildfire 1/10 Low
- Heat 8/10 Severe 7 d/yr ≥108°F today · 22 d/yr by 30 yrs out
- Wind 7/10 Severe 78% chance of damaging wind over 30 yrs
- Air quality 2/10 Low 1 unhealthy d/yr today · 1 by 30 yrs out
Nearby sold comps map
Loading sold comps map…
Walkable amenities ~0.75 mi
Loading nearby amenities…
Taxation est. · year 1
- Rental income
- $16,451
- − Mortgage interest
- −$3,361
- − Property taxes
- −$840
- − Insurance
- −$300
- − Repairs & maintenance
- −$1,316
- − Management
- −$1,316
- − Depreciation
- −$1,745
- Taxable income
- $7,572
- Est. tax owed @ 24.0%
- −$1,817
- After-tax cash flow
- $6,263/yr
For passive investors: Depreciation is non-cash, so a rental often shows a tax loss while cash-flowing — sheltering income. Rental losses are passive: they offset passive income freely, and up to $25,000/yr can offset ordinary (W-2) income if you actively participate and your MAGI is under $100k (phasing out to $0 by $150k); unused losses carry forward. On sale, claimed depreciation is recaptured at up to 25%, and gains may owe capital-gains tax (a 1031 exchange can defer both). Figures are a year-1 estimate at your 24.0% rate — not tax advice; consult a CPA.
Schools (NCES district)
- District
- Edgewood ISD
- NCES district ID
- 4818150
- Math proficiency
- 12% ▼ -18.00%
- Reading proficiency
- 21% ▼ -5.00%
- Median HH income
- $27,419
- Composite
- 12.82/100
- National rank
- #9597
- State rank
- #812 of 826 in TX
Livability — San Antonio
- Score
- 80/100
- State rank
- #31
- US rank
- #1616
Category grades
Schools grade is shown separately in the Schools card above.
Census & demographics
- Census place
- San Antonio, TX
Population outlook (Bexar County) Hauer SSP2
- Today (2025)
- 2,336,851 people
- By 2030
- 2,560,728 · +9.6%
- By 2040
- 3,020,569 · +29.3%
- By 2050
- 3,493,522 · +49.5%
- By 2075
- 4,668,459 · +99.8%
- By 2100
- 5,533,242 · +136.8%
Not yet ingested
- Political lean
- —
- Race & ethnicity
- —
- Common origin
- —
- Civics
- —
Market trends
- HPI YoY
- —
- Current HPI
- —
- Rent YoY
- —
- Metro
- —
- State GDP YoY
- ▲ 3.95%
- F500 in state
- 110
Industry mix (Fortune 500 HQ in TX)
| Industry | F500 HQs | Revenue |
|---|---|---|
| Energy | 16 | $1,198B |
|
||
| Technology | 5 | $198B |
|
||
| Engineering / Construction | 4 | $72B |
|
||
| Energy Services | 3 | $60B |
|
||
| Utilities | 3 | $41B |
|
||
| Healthcare | 2 | $330B |
|
||
Price history
-32.6% since first listed9 events — show timeline
- 2026-03-26 Price Changed $59,999 LERA
- 2026-03-25 Relisted — LERA
- 2024-01-10 Listing Removed — HARMLS
- 2023-10-18 Listed $109,999 HARMLS
- 2023-05-05 Listing Removed — LERA
- 2022-10-13 Price Changed $136,999 LERA
- 2022-06-24 Relisted — LERA
- 2022-05-25 Pending — LERA
- 2021-05-07 Listed $88,999 LERA
Property tax history
-1.3%/yrLatest (2025): $840 · -45.6% YoY. Source: county tax records.
Cash-flow waterfall
monthlySold comps — $/sqft
last 12 mo · ≤1 miLoading sold comps…