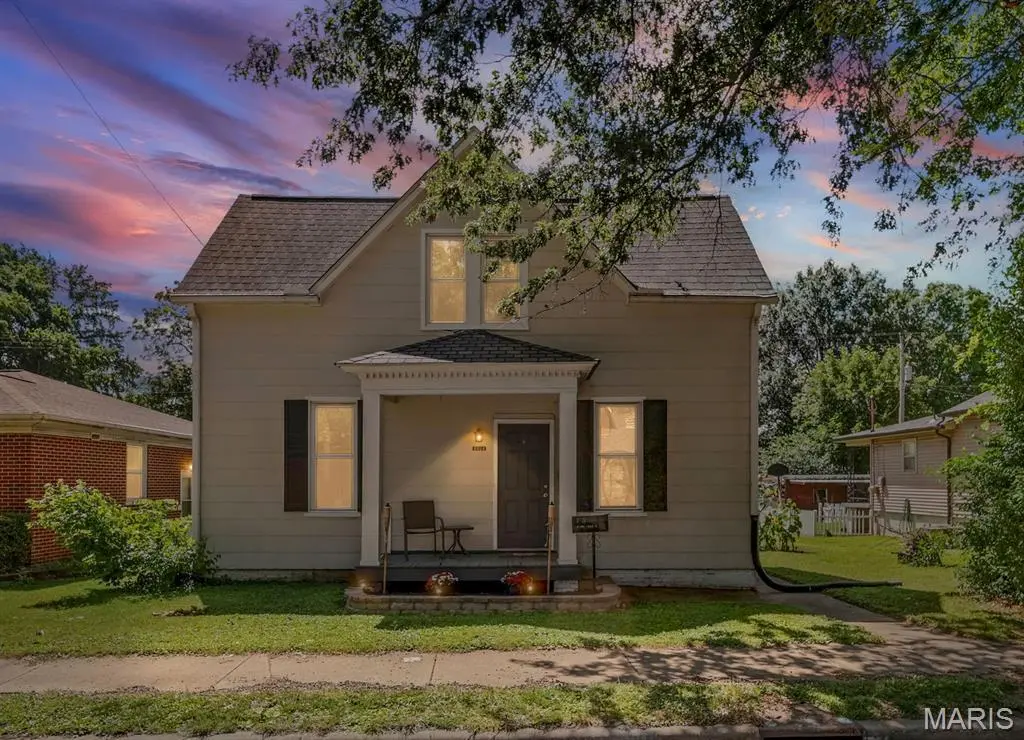
1324 Lebanon Ave · Belleville, IL
Flood risk 1/10 · Minimal
- FEMA flood zone
- X
- Chance of flooding over 30 yrs
- 0.0%
- Est. flood insurance / yr
- $473 – $860
Fire risk 1/10 · Minimal
- Est. fire insurance / yr
- $804 – $1,492
Heat risk 5/10 · Moderate
- Hot days now (above 107°F)
- 7 days/yr
- Hot days in 30 yrs
- 21 days/yr
Wind risk 2/10 · Minimal
- Chance of severe wind over 30 yrs
- 1.0%
Air-quality risk 4/10 · Minor
- Unhealthy air days now
- 3 days/yr
- Unhealthy air days in 30 yrs
- 6 days/yr
Risk factors via First Street. Map © Google.
Why this score? — see what drove the F grade
The composite is a weighted blend of 9 inputs, each scored 0–100. Each bar is that input's sub-score; the figure is the points it added to the 100-point composite (weight × sub-score).
- ARV discount +7.5/15.0
- Cash flow +6.5/30.0
- Rent growth +4.3/5.0
- Livability +3.9/5.0
- Condition / age +2.5/5.0
- Schools +2.2/10.0
- 1% rule +2.1/10.0
- DSCR +0.8/10.0
- Appreciation +0.0/10.0
$150,000
🖨 Deal sheet (PDF) 📄 Offer letter ✓ Due diligence
Listing remarks MLS
This charming 2-bedroom, 1-bath home offers comfort, style, and a motivated seller open to offers! Featuring newer roof, A/C, furnace, and windows, the home has been thoughtfully updated for worry-free living. Freshly painted interiors showcase bright, open spaces with beautifully refinished hardwood floors. The kitchen includes a refrigerator, dishwasher, and wall-mounted TV. The spacious bedrooms provide a tranquil retreat, and an upstairs bonus room can function as office space or a non-conforming bedroom. The detached garage offers two 220-volt power sources, perfect for a workshop or EV charging. Conveniently located minutes from shops, restaurants, parks, and schools. Don't miss this opportunity! Additional Rooms: Mud Room
Key facts
- Covered front porch
- Enclosed sunroom
- Bonus room
Tags
Property features AI
Finance
- Other: Seller open to concessions; Not available for lease (lease not considered)
Exterior
- Parking: Detached garage with 2 spaces; Garage faces rear with garage door opener; Additional parking with alley access and gravel surface
- Security: Smoke detectors; Carbon monoxide detectors
- Utilities: Public water; Public sewer; Electric service by Ameren; Electricity, water, and sewer available
- Home design: Single-family house; One-and-a-half levels; Entry from front (front porch)
- Construction: Aluminum siding; Architectural shingle roof; Block foundation; Built (year source: public records)
- Exterior features: Covered, enclosed front and side porches; Porch; Front yard and back yard; Level lot; Near public transit; Asphalt city street frontage
Interior
- Kitchen: Dishwasher; Gas range; Refrigerator; Eat-in kitchen
- Bedrooms: 2 bedrooms (both on the upper level)
- Flooring: Carpet; Hardwood
- Bathrooms: 1 full bathroom (main/upper level)
- Heating & cooling: Forced air heating (natural gas); Central air conditioning; Ceiling fans
- Interior features: Ceiling fans; Eat-in kitchen; High ceilings
- Laundry & utility: Laundry in basement
Neighborhood map
What this means for you Summary
Snapshot
- This is a 2-bed/2.0-bath single-family listed at $150k.
Deal economics
- At list price, monthly cash flow is $-250 ($-3k/yr) — negative.
- To cash-flow at today's rent, offer at most $106k (29.5% below list).
- To meet the 1% rule (rent ≥ 1% of price), the offer needs to be $106k (29.4% below list).
- Recommended offer: $106k (29.5% below list) — sets the bar for cash-flow.
- Cap rate 4.3% vs local median 5.6% in Belleville — below-typical yield; the buyer is paying a premium for something (appreciation thesis, condition, location) that the cap rate doesn't capture.
Location & tenants
- Location reads 78/100 on livability (#142 in IL, #2,604 nationally) — a middle-class / working-renter tenant base. Strengths: commute A+, cost of living A+, housing A+; Watch: crime F, amenities D-.
- Belleville Twp Hsd 201 (suburban): math 21% / reading 28% proficiency, ranked #308 of 620 in IL (top 50%) — low school quality limits family demand, transient renter base, plan for 1-2y turnover.
- Zoned schools: Jefferson Elem School (math 17% / reading 32%, grade F, #850 of 2,056 statewide, top 45%, 351 students, 0% FRL); West Jr High School (math 11% / reading 22%, grade F, #482 of 665 statewide, top 73%, 422 students, 0% FRL); Belleville High School-East (math 23% / reading 30%, grade F, #241 of 693 statewide, top 35%, 2,568 students, 0% FRL).
- Market conditions: Rents rising fast (+7.0%/yr); 160 active listings in the ZIP; solid renter incomes; 783 units permitted in St. Clair County in 2024 (378 in 5+ unit buildings).
- This rent is only 15% of the median local income ($82k/yr) — well below the 30% rent-burden line; pricing power to push rent on renewal without tenant pushback.
Forward outlook
- Local home prices are declining (-3.0%/yr); year-one equity from $1k of loan paydown is wiped out by about $4k of value loss. Plan a longer hold.
- St. Clair County population projected at -23% by 2050 — secular population decline; favor cash flow + early exit over multi-decade hold.
Negotiation context
- Only 2 days on market — expect competitive offers; lowballing is unlikely to land.
- 4 sale attempts since 7y ago with the ask held roughly flat each time — persistent listings suggest the price (not the market) is what's stuck; bring a comps-based counter.
- Current owner paid $45k; list at $150k implies a 233% gain — meaningful room to come down on a strong offer.
Risks & watch-outs
- Watch-outs: built in 1903 — expect roof / HVAC / electrical / plumbing capex.
- Climate carrying-cost: extreme-heat days projected 7→21/yr by 2055 (HVAC capex compounding) — expect insurance premiums to compound above CPI over the hold.
Questions for the listing agent
- What do current leases actually rent for vs. the listed asking? Can we see a recent rent roll and the last 12 months of T-12 income?
- Built in 1903 — when were the roof, HVAC, electrical panel, plumbing, and water heater last replaced?
- Is there a deadline driving the sale (1031 exchange, divorce, estate, relocation)? That informs how much negotiation room exists.
- Crime grade is F in this area — have there been break-ins, vandalism, or insurance claims at this property in the last 3 years? What carrier currently insures it and at what premium?
- The area grade is low — what's the realistic commute time and amenity access for the typical tenant pool here? Any planned neighborhood developments (good or bad) we should know about?
- What's the average days-on-market for RENTAL listings here right now (not sales)? A rising rental-DOM trend means longer vacancies and softer asking-rent achievability than the comps imply.
- What's the recent tenant-quality profile in this submarket — average credit score on applications, eviction rate, late-payment / NSF rate, and stable-employment percentage? A property-management company in the area should have these aggregated.
- How much new for-sale + rental construction is in the pipeline within 1–3 miles? Heavy new supply typically softens prices + rents 12–24 months out; constrained supply supports both.
Investment metrics
- 1% rule
- 0.71% ✗
- Cap rate
- 4.29%
- Cash-on-cash
- -7.15%
- DSCR
- 0.68
- GRM
- 11.8
CMA / ARV
- ARV (on-the-fly)
- $62,400
- Comps found
- 1
Show comp detail 1 sale within ~0.75 mi
| Address | Dist | Beds/Ba | Sqft | Sold | Price | $/sf | Match |
|---|---|---|---|---|---|---|---|
| 1922 E C St | 0.54mi | 1/1.0 (-1) | 460 (-4%) | 4mo | $59,900 | $130 | 55 |
Match score weights: distance 35% · size 25% · config 20% · recency 20%. Top-matched comps best support the ARV.
Projected returns pro-forma
-3.0% appreciation · 7.04% rent growth · sell at horizon
- IRR
- -24.1%
- Equity multiple
- 0.15×
- Total profit
- $-35,713
- Equity at exit
- $22,365
- IRR
- -10.5%
- Equity multiple
- 0.25×
- Total profit
- $-31,447
- Equity at exit
- $12,969
Cash invested: $42,000 (down + closing). Projections, not guarantees.
Landlord ↔ Tenant lean methodology
- Overall (STATE)
- 43 Moderately Tenant-Leaning
- State Illinois
- 43 Moderately Tenant-Leaning · D+7
- County
- — inherits STATE
- City
- — inherits STATE
ZIP-level market 62221
- Home prices YoY
- -24.2%
- Rents YoY
- 7.0%
- Active inventory
- 160
- Price-to-rent
- 11.8×
Monthly cashflow live
- Estimated rent
- $1,059 medium interval (Pro) →
- Mortgage (P&I)
- −$787
- Tax from tax record
- −$238 /mo · $2,850/yr
- Insurance
- −$62
- HOA
- −$0
- Vacancy / Maint / Mgmt
- −$222
- Net cashflow
- $-250
Break-even live
Sensitivity live
| Price | -10% $-165 | -5% $-208 | +0% $-250 | +5% $-293 | +10% $-335 |
|---|---|---|---|---|---|
| Rent | -10% $-334 | -5% $-292 | +0% $-250 | +5% $-208 | +10% $-167 |
| Rate | -1.0pp $-175 | -0.5pp $-212 | base $-250 | +0.5pp $-289 | +1.0pp $-329 |
UW: 25.0% down · 7.5% · 30yr · 1.5% tax · 5.0% vac · 8.0% maint · 8.0% mgmt
Financing live
Cash to close
- Down payment
- $37,500
- Closing costs
- $4,500
- Reserves months
- —
- Total cash needed
- —
Loan-product check · same deal, 3 products live
Conventional
25% down · 7.5% · 30yr
- Down + closing
- —
- Monthly P&I
- —
- Monthly cashflow
- —
- DSCR
- —
- Eligible?
- —
Personal DTI + credit; lowest rate.
DSCR
20% down · 8.5% · 30yr
- Down + closing
- —
- Monthly P&I
- —
- Monthly cashflow
- —
- DSCR
- —
- Eligible?
- —
No personal income docs; deal must DSCR.
Hard money
10% down · 12.0% · 12mo
- Down + closing
- —
- Monthly P&I
- —
- Monthly cashflow
- —
- DSCR
- —
- Eligible?
- —
Short-term bridge; refi at stabilization.
Listing history 2 events
-
2026-06-21remarks 699-char remark
-
2026-06-21$150,000 Active 2 DOM
ⓘ Source: listings_history table (triggers on properties + properties_extension) + one-shot
backfill from property_details.listing_events for pre-trigger history.
Tax reassessment forecast IL · Partial reset (capped growth)
- Current annual tax
- $2,850 · $238/mo
- Projected year-2 tax
- $3,128 · $261/mo
- Expected delta
- +$277/yr (+$23/mo · 9.7%)
ⓘ Screening estimate from a state-policy table — verify with the county assessor before closing.
Climate risk First Street
- Flood 1/10 Low FEMA zone X · 0% chance over 30 yrs
- Wildfire 1/10 Low
- Heat 5/10 Major 7 d/yr ≥107°F today · 21 d/yr by 30 yrs out
- Wind 2/10 Low 100% chance of damaging wind over 30 yrs
- Air quality 4/10 Moderate 3 unhealthy d/yr today · 6 by 30 yrs out
Nearby sold comps map
Loading sold comps map…
Walkable amenities ~0.75 mi
Loading nearby amenities…
Taxation est. · year 1
- Rental income
- $12,706
- − Mortgage interest
- −$8,402
- − Property taxes
- −$2,850
- − Insurance
- −$750
- − Repairs & maintenance
- −$1,016
- − Management
- −$1,016
- − Depreciation
- −$4,364
- Taxable loss
- −$5,693
- Est. tax savings @ 24.0%
- +$1,366
- After-tax cash flow
- $-1,635/yr
For passive investors: Depreciation is non-cash, so a rental often shows a tax loss while cash-flowing — sheltering income. Rental losses are passive: they offset passive income freely, and up to $25,000/yr can offset ordinary (W-2) income if you actively participate and your MAGI is under $100k (phasing out to $0 by $150k); unused losses carry forward. On sale, claimed depreciation is recaptured at up to 25%, and gains may owe capital-gains tax (a 1031 exchange can defer both). Figures are a year-1 estimate at your 24.0% rate — not tax advice; consult a CPA.
Schools (NCES district)
- District
- Belleville Twp Hsd 201
- NCES district ID
- 1705640
- Math proficiency
- 21% ▼ -8.00%
- Reading proficiency
- 28% ▼ -3.00%
- Median HH income
- $58,064
- Composite
- 22.39/100
- National rank
- #8115
- State rank
- #308 of 620 in IL
Livability — Belleville
- Score
- 78/100
- State rank
- #142
- US rank
- #2604
Category grades
Schools grade is shown separately in the Schools card above.
Census & demographics
- Census place
- Belleville, IL
- County
- Saint Clair County · 169,691 people
- City population
- 47,407
- Metro
- St. Louis, MO-IL
- Population (ZIP)
- 29,875
- Household income
- $82,271
- Rent vs Own
- Severe rent burden
- 658.0
Population outlook (St. Clair County) Hauer SSP2
- Today (2025)
- 250,366 people
- By 2030
- 240,511 · -3.9%
- By 2040
- 217,391 · -13.2%
- By 2050
- 192,699 · -23.0%
- By 2075
- 140,637 · -43.8%
- By 2100
- 100,499 · -59.9%
Race, ethnicity, and origin ACS 2023
- Neighborhood character
- Diverse neighborhood (Simpson 0.58)
- Race & ethnicity
- White 56% Black 31% Two or more races 6% Hispanic / Latino 3% Asian 2%
- Common ancestry
- Lithuanian 4% Romanian 2% Slovak 2%
- Foreign-born
- 3% · Canada, South Korea
- Languages at home
- 94% English-only · Spanish 2% German/W. Germanic 1% French/Haitian/Cajun 1%
Political lean MEDSL · St. Clair
- 2024 margin
- Lean D (+7.9) · D 53.0% · R 45.1% · Other 1.8%
- 2008→2024 swing
- -14.6pp toward R · 2008: 22.4pp · 2024: 7.9pp
- All cycles
- 2024: D+7.9 2020: D+8.7 2016: D+5.6 2012: D+14.5 2008: D+22.4
Not yet ingested
- Civics
- —
Market trends
- HPI YoY
- ▼ -53.50%
- Current HPI
- 167.8124
- Rent YoY
- ▲ 7.04%
- Metro
- St. Louis, MO-IL
- State GDP YoY
- ▲ 1.59%
- F500 in state
- 60
Industry mix (Fortune 500 HQ in IL)
| Industry | F500 HQs | Revenue |
|---|---|---|
| Insurance | 4 | $201B |
|
||
| Consumer Goods | 4 | $87B |
|
||
| Industrial Machinery | 3 | $64B |
|
||
| Healthcare | 2 | $55B |
|
||
| Retail / Pharmacy | 1 | $148B |
|
||
| Agriculture / Food | 1 | $86B |
|
||
Price history
+200.0% since first listed21 events — show timeline
- 2026-06-19 Listed $150,000 MARIS as Distributed by MLS Grid
- 2026-06-19 Coming Soon $150,000 MARIS as Distributed by MLS Grid
- 2025-06-12 Sold (MLS) — MARIS as Distributed by MLS Grid
- 2025-05-12 Contingent — MARIS as Distributed by MLS Grid
- 2025-05-07 Price Changed $115,000 MARIS as Distributed by MLS Grid
- 2025-04-14 Price Changed $125,000 MARIS as Distributed by MLS Grid
- 2025-03-04 Price Changed $134,000 MARIS as Distributed by MLS Grid
- 2025-01-24 Price Changed $138,000 MARIS as Distributed by MLS Grid
- 2024-12-13 Listed $142,000 MARIS as Distributed by MLS Grid
- 2024-12-09 Coming Soon $142,000 MARIS as Distributed by MLS Grid
- 2019-09-19 Sold (Public Records) $45,000 Public Records
- 2019-09-18 Sold (MLS) — MARIS as Distributed by MLS Grid
- 2019-08-24 Pending — MARIS as Distributed by MLS Grid
- 2019-07-04 Price Changed $49,900 MARIS as Distributed by MLS Grid
- 2019-06-04 Price Changed $54,900 MARIS as Distributed by MLS Grid
- 2019-05-12 Relisted — MARIS as Distributed by MLS Grid
- 2019-04-24 Pending — MARIS as Distributed by MLS Grid
- 2019-04-07 Listed $62,000 MARIS as Distributed by MLS Grid
- 2018-07-19 Price Changed $58,000 MARIS as Distributed by MLS Grid
- 2000-06-13 Sold (Public Records) $53,000 Public Records
- 1999-02-19 Sold (Public Records) $50,000 Public Records
Property tax history
+2.1%/yrLatest (2024): $2,850 · +23.1% YoY. Source: county tax records.
Cash-flow waterfall
monthlySold comps — $/sqft
last 12 mo · ≤1 miLoading sold comps…