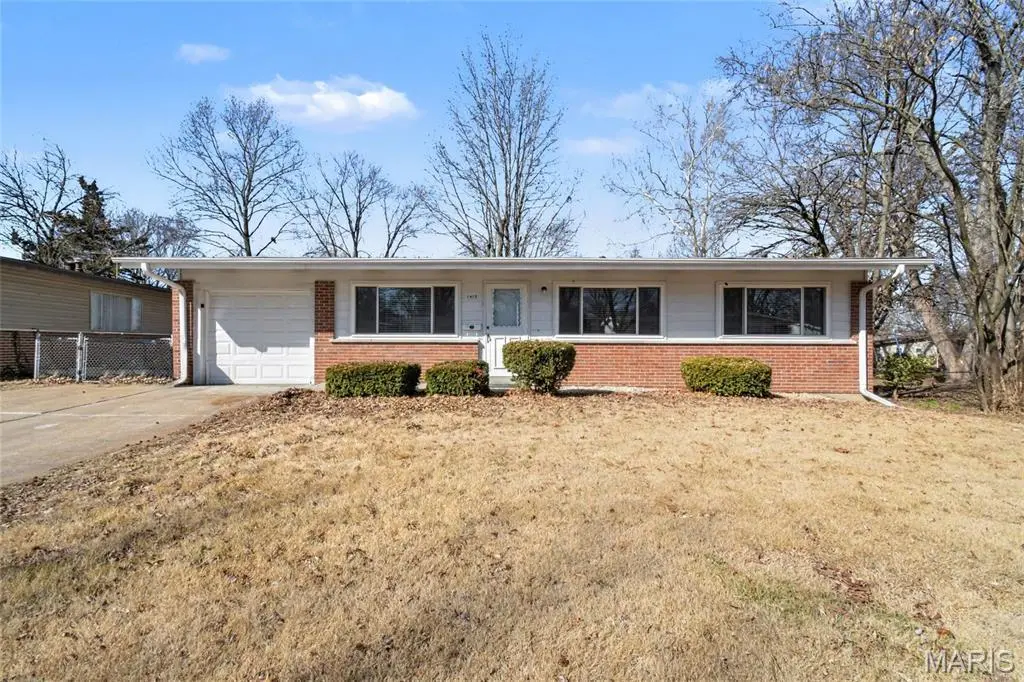
1475 Nashua Dr · Florissant, MO
Flood risk 1/10 · Minimal
- FEMA flood zone
- X (unshaded)
- Chance of flooding over 30 yrs
- 0.0%
- Est. flood insurance / yr
- $473 – $860
Fire risk 1/10 · Minimal
- Est. fire insurance / yr
- $1,054 – $1,958
Heat risk 5/10 · Moderate
- Hot days now (above 105°F)
- 7 days/yr
- Hot days in 30 yrs
- 21 days/yr
Wind risk 2/10 · Minimal
- Chance of severe wind over 30 yrs
- 1.0%
Air-quality risk 3/10 · Minor
- Unhealthy air days now
- 3 days/yr
- Unhealthy air days in 30 yrs
- 5 days/yr
Risk factors via First Street. Map © Google.
Why this score? — see what drove the B- grade
The composite is a weighted blend of 9 inputs, each scored 0–100. Each bar is that input's sub-score; the figure is the points it added to the 100-point composite (weight × sub-score).
- Cash flow +19.0/30.0
- ARV discount +15.0/15.0
- Appreciation +10.0/10.0
- DSCR +6.0/10.0
- 1% rule +4.6/10.0
- Rent growth +4.4/5.0
- Livability +3.7/5.0
- Condition / age +2.5/5.0
- Schools +1.2/10.0
$169,900
🖨 Deal sheet (PDF) 📄 Offer letter ✓ Due diligence
Listing remarks MLS
Move-in ready three-bedroom, 1.5-bathroom home with a large unfinished basement and a one-car garage. This home features durable LVP flooring in the high-traffic areas and cozy carpeting in the bedrooms, providing the perfect balance of comfort and easy maintenance. The kitchen is updated with granite countertops and sleek black appliances. The expansive unfinished basement offers incredible storage space or the potential to be finished out as a secondary living area, media room, or game room.
Key facts
- Black appliances
- Granite countertops
- 0.29 acre lot
Tags
Neighborhood map
What this means for you Summary
Snapshot
- This is a 3-bed/1.5-bath single-family listed at $170k.
Deal economics
- At list price, monthly cash flow is $177 ($2k/yr) — positive.
- The deal already cash-flows at list — no discount required.
- To meet the 1% rule (rent ≥ 1% of price), the offer needs to be $164k (3.6% below list).
- Recommended offer: $160k (6.0% below list) — sets the bar for market timing.
Location & tenants
- Location reads 73/100 on livability (#82 in MO) — a middle-class / working-renter tenant base. Strengths: cost of living A+, housing A+, health & safety B+; Watch: crime C-, amenities D+, schools D.
- Ferguson-Florissant R-II (suburban): math 7% / reading 20% proficiency, ranked #311 of 324 in MO (top 96%) — low school quality limits family demand, transient renter base, plan for 1-2y turnover; 70% free/reduced lunch — lower-income household profile, screen leases tightly.
- Market conditions: Rents rising fast (+7.5%/yr); 218 active listings in the ZIP; 33 comparable units currently listed for rent nearby; rentals at typical pace (median 21d on market — plan ~3-4 weeks tenant-placement turnaround); 920 units permitted in St. Louis County in 2024 (250 in 5+ unit buildings).
Forward outlook
- In year one you build about $18k of equity ($1k loan paydown + $17k appreciation (10.0% local appreciation)).
- At projected returns (10.0% appreciation + 7.5% rent growth), your $48k cash investment doubles in ~3 years — after that, you're playing with house money.
- By year 3, paydown + projected appreciation supports a ~$46k cash-out refi (75% LTV) — recoverable capital for the next deal without selling this one.
Negotiation context
- It's been on market 78 days — a 6% lower offer ($160k) is reasonable based on typical stale-listing flexibility.
- 3 sale attempts since 5y ago with the ask held roughly flat each time — persistent listings suggest the price (not the market) is what's stuck; bring a comps-based counter.
- Current owner paid $134k; 27% above their basis — modest negotiation headroom, anchor on the comps not their cost.
Risks & watch-outs
- Watch-outs: built in 1957 — expect roof / HVAC / electrical / plumbing capex.
- Climate carrying-cost: extreme-heat days projected 7→21/yr by 2055 (HVAC capex compounding) — expect insurance premiums to compound above CPI over the hold.
Questions for the listing agent
- It's been on market 78 days. Have you received any prior offers? Is the seller open to a 6% concession, seller financing, or rate buy-down credit?
- Built in 1957 — when were the roof, HVAC, electrical panel, plumbing, and water heater last replaced?
- Why hasn't it sold? Are there any deal-killer items the seller is aware of (foundation, flood, title, zoning, code violations)?
- Is there a deadline driving the sale (1031 exchange, divorce, estate, relocation)? That informs how much negotiation room exists.
- Schools are D-rated, which usually means shorter tenancies and higher turnover. Who's the typical renter profile here, and what's been the actual vacancy rate?
- What's the average days-on-market for RENTAL listings here right now (not sales)? A rising rental-DOM trend means longer vacancies and softer asking-rent achievability than the comps imply.
- What's the recent tenant-quality profile in this submarket — average credit score on applications, eviction rate, late-payment / NSF rate, and stable-employment percentage? A property-management company in the area should have these aggregated.
- How much new for-sale + rental construction is in the pipeline within 1–3 miles? Heavy new supply typically softens prices + rents 12–24 months out; constrained supply supports both.
Investment metrics
- 1% rule
- 0.96% ✗
- Cap rate
- 7.54%
- Cash-on-cash
- 4.46%
- DSCR
- 1.20
- GRM
- 8.6
CMA / ARV
- ARV (median comp)
- $209,398
- List price
- $169,900
- Delta
- -18.86%
- Verdict
- UNDERPRICED
- Comps
- 20 within 1.0 mi
Show comp detail 12 sales within ~0.75 mi
| Address | Dist | Beds/Ba | Sqft | Sold | Price | $/sf | Match |
|---|---|---|---|---|---|---|---|
| 1475 Nashua Dr | 0.00mi | 3/1.5 | 1,160 (0%) | 1mo | $169,900 | $146 | 100 |
| 1480 Burning Tree Dr | 0.07mi | 3/2.0 | 1,140 (-2%) | 2mo | $200,000 | $175 | 90 |
| 1420 Nashua Dr | 0.04mi | 3/1.5 | 1,092 (-6%) | 2mo | $199,000 | $182 | 86 |
| 1980 Parker Rd | 0.27mi | 3/1.5 | 1,196 (+3%) | 1mo | $182,157 | $152 | 82 |
| 1585 Pepperhill Dr | 0.25mi | 3/2.0 | 1,204 (+4%) | 2mo | $225,000 | $187 | 78 |
| 1460 Fox Run Dr | 0.14mi | 4/2.0 (+1) | 1,050 (-10%) | 1mo | $169,900 | $162 | 70 |
| 1320 Pepperhill Dr | 0.32mi | 3/2.0 | 1,247 (+8%) | 1mo | $200,000 | $160 | 70 |
| 1020 Belmont Ter | 0.36mi | 3/1.5 | 1,040 (-10%) | 4mo | $159,900 | $154 | 63 |
| 1770 Beverly Dr | 0.71mi | 3/1.5 | 1,040 (-10%) | 1mo | $200,000 | $192 | 48 |
| 18 Redwood Dr | 0.71mi | 3/2.0 | 1,046 (-10%) | 2mo | $134,000 | $128 | 47 |
| 2190 Glenoro Dr | 0.69mi | 4/2.5 (+1) | 1,083 (-7%) | 3mo | $225,999 | $209 | 46 |
| 2345 Hummingbird Dr | 0.59mi | 3/1.0 | 988 (-15%) | 2mo | $175,000 | $177 | 44 |
Match score weights: distance 35% · size 25% · config 20% · recency 20%. Top-matched comps best support the ARV.
Projected returns pro-forma
10.0% appreciation · 7.51% rent growth · sell at horizon
- IRR
- 29.2%
- Equity multiple
- 3.34×
- Total profit
- $111,548
- Equity at exit
- $153,059
- IRR
- 26.7%
- Equity multiple
- 8.12×
- Total profit
- $338,506
- Equity at exit
- $330,078
Cash invested: $47,572 (down + closing). Projections, not guarantees.
Landlord ↔ Tenant lean methodology
- Overall (STATE)
- 81 Strongly Landlord-Friendly
- State Missouri
- 81 Strongly Landlord-Friendly · R+10
- County
- — inherits STATE
- City
- — inherits STATE
ZIP-level market 63033
- Home prices YoY
- 2.5%
- Rents YoY
- 7.5%
- Active inventory
- 218
- Price-to-rent
- 8.6×
Monthly cashflow live
- Estimated rent
- $1,638 high interval (Pro) →
- Mortgage (P&I)
- −$891
- Tax from tax record
- −$156 /mo · $1,867/yr
- Insurance
- −$71
- HOA
- −$0
- Vacancy / Maint / Mgmt
- −$344
- Net cashflow
- $177
Break-even live
Sensitivity live
| Price | -10% $273 | -5% $225 | +0% $177 | +5% $129 | +10% $81 |
|---|---|---|---|---|---|
| Rent | -10% $47 | -5% $112 | +0% $177 | +5% $241 | +10% $306 |
| Rate | -1.0pp $262 | -0.5pp $220 | base $177 | +0.5pp $133 | +1.0pp $88 |
UW: 25.0% down · 7.5% · 30yr · 1.5% tax · 5.0% vac · 8.0% maint · 8.0% mgmt
Financing live
Cash to close
- Down payment
- $42,475
- Closing costs
- $5,097
- Reserves months
- —
- Total cash needed
- —
Loan-product check · same deal, 3 products live
Conventional
25% down · 7.5% · 30yr
- Down + closing
- —
- Monthly P&I
- —
- Monthly cashflow
- —
- DSCR
- —
- Eligible?
- —
Personal DTI + credit; lowest rate.
DSCR
20% down · 8.5% · 30yr
- Down + closing
- —
- Monthly P&I
- —
- Monthly cashflow
- —
- DSCR
- —
- Eligible?
- —
No personal income docs; deal must DSCR.
Hard money
10% down · 12.0% · 12mo
- Down + closing
- —
- Monthly P&I
- —
- Monthly cashflow
- —
- DSCR
- —
- Eligible?
- —
Short-term bridge; refi at stabilization.
Rent comps 33 comps
| Address | Beds | Baths | Sqft | Rent | $/sqft | DOM | Units | Dist |
|---|---|---|---|---|---|---|---|---|
| 1785 Trotter Way Florissant, MO | 3.0 | 2.0 | 1297 | $1,806 | $1.39 | 8d | 1 | 0.46mi |
| 1600 Horseshoe Dr Florissant, MO | 3.0 | 2.0 | 1314 | $1,550 | $1.18 | 44d | 1 | 0.49mi |
| 1045 N New Florissant Rd Florissant, MO | 2.0 | 1.0 | 783 | $1,250 | $1.60 | 15d | 1 | 0.52mi |
| 1004 N New Florissant Rd Florissant, MO | 2.0 | 1.0 | 719 | $1,375 | $1.91 | 24d | 1 | 0.52mi |
| 560 Jamaica Pl Florissant, MO | 3.0 | 2.0 | 1350 | $1,653 | $1.22 | 44d | 1 | 0.65mi |
| 10 Saint Celeste Dr Florissant, MO | 2.0 | 1.0 | 716 | $1,290 | $1.80 | 13d | 1 | 0.68mi |
| 9 Saint Celeste Dr Florissant, MO | 3.0 | 1.0 | 992 | $1,450 | $1.46 | 44d | 1 | 0.70mi |
| 1710 Kay Dr Florissant, MO | 3.0 | 1.0 | 960 | $1,500 | $1.56 | 2d | 1 | 0.70mi |
| 2990 Santiago Dr Florissant, MO | 2.0 | 2.0 | 984 | $1,200 | $1.22 | 44d | 1 | 0.73mi |
| 1725 Saint Catherine St Florissant, MO | 3.0 | 1.0 | 1107 | $1,800 | $1.63 | 15d | 1 | 0.73mi |
| 3 Champlain Ct Florissant, MO | 3.0 | 1.0 | 1100 | $1,600 | $1.45 | 44d | 1 | 0.74mi |
| 20 Saint Benedict Ln Florissant, MO | 3.0 | 1.5 | 1092 | $1,525 | $1.40 | 20d | 1 | 0.77mi |
| 410 Ridge Dr Florissant, MO | 3.0 | 2.0 | 1226 | $1,650 | $1.35 | 18d | 1 | 0.82mi |
| 1280 Saint Catherine St Florissant, MO | 3.0 | 1.0 | 1274 | $1,600 | $1.26 | 15d | 1 | 0.85mi |
| 1545 Washington St Florissant, MO | 3.0 | 1.5 | 1337 | $2,055 | $1.54 | 3d | 1 | 0.98mi |
| 3209 Cross Keys Dr Florissant, MO | 1.0–2.0 | 1.0 | 700 | $1,100 | $1.57 | 2d | 1 | 1.00mi |
| 765 Bobbins Ln Florissant, MO | 3.0 | 1.0 | 1107 | $1,450 | $1.31 | 44d | 1 | 1.00mi |
| 3 Cantabrian Ct Florissant, MO | 3.0 | 2.0 | 1436 | $1,881 | $1.31 | 15d | 1 | 1.03mi |
| 1983 Greenheath Dr Florissant, MO | 3.0 | 2.0 | 1040 | $1,331 | $1.28 | 3d | 1 | 1.03mi |
| 1600 Washington St Florissant, MO | 3.0 | 1.5 | 1095 | $1,250 | $1.14 | 20d | 1 | 1.05mi |
| 297 Saint Eugene Ln Florissant, MO | 2.0 | 1.0 | 1100 | $1,100 | $1.00 | 44d | 1 | 1.06mi |
| 100 Taney Dr Florissant, MO | 3.0 | 1.0 | 1148 | $1,495 | $1.30 | 22d | 1 | 1.06mi |
| 330 Moule Dr Florissant, MO | 3.0 | 1.0 | 1014 | $1,575 | $1.55 | 44d | 1 | 1.08mi |
| 790 Pebble Ln Florissant, MO | 3.0 | 2.0 | 1242 | $1,795 | $1.45 | 24d | 1 | 1.09mi |
| 470 Hundley Dr Florissant, MO | 3.0 | 2.0 | 962 | $1,595 | $1.66 | 44d | 1 | 1.20mi |
| 3144 Sunswept Pk Ct Florissant, MO | 1.0–3.0 | 1.0–2.0 | 818 | $1,250 | $1.53 | 2d | 12 | 1.24mi |
| 305 S Lafayette St Florissant, MO | 3.0 | 1.0 | 864 | $1,409 | $1.63 | 16d | 1 | 1.27mi |
| 4 Sharon Ct Florissant, MO | 3.0 | 2.0 | 1108 | $1,800 | $1.62 | 2d | 1 | 1.34mi |
| 155 Reeb Ln Apt 2 Florissant, MO | 2.0 | 1.0 | 850 | $995 | $1.17 | 44d | 1 | 1.43mi |
| 167 Reeb Ln Florissant, MO | 1.0–2.0 | 1.0 | 850 | $1,300 | $1.53 | 2d | 4 | 1.43mi |
| 1670 Arundel Dr Florissant, MO | 3.0 | 2.0 | 1012 | $1,450 | $1.43 | 24d | 1 | 1.43mi |
| 50 Lynn Meadows Ln Florissant, MO | 3.0 | 1.0 | 864 | $1,450 | $1.68 | 24d | 1 | 1.45mi |
| 1180 S New Florissant Rd Florissant, MO | 3.0 | 1.0 | 925 | $1,225 | $1.32 | 24d | 1 | 1.48mi |
Listing history 10 events
-
2026-05-06status Pending 500-char remark
Show marketing remark (500 chars)
Move-in ready three-bedroom, 1.5-bathroom home with a large unfinished basement and a one-car garage. This home features durable LVP flooring in the high-traffic areas and cozy carpeting in the bedrooms, providing the perfect balance of comfort and easy maintenance. The kitchen is updated with granite countertops and sleek black appliances. The expansive unfinished basement offers incredible storage space or the potential to be finished out as a secondary living area, media room, or game room.
-
2026-03-20price $169,900 500-char remark
Show marketing remark (500 chars)
Move-in ready three-bedroom, 1.5-bathroom home with a large unfinished basement and a one-car garage. This home features durable LVP flooring in the high-traffic areas and cozy carpeting in the bedrooms, providing the perfect balance of comfort and easy maintenance. The kitchen is updated with granite countertops and sleek black appliances. The expansive unfinished basement offers incredible storage space or the potential to be finished out as a secondary living area, media room, or game room.
-
2026-02-17$174,900 Active 500-char remark
Show marketing remark (500 chars)
Move-in ready three-bedroom, 1.5-bathroom home with a large unfinished basement and a one-car garage. This home features durable LVP flooring in the high-traffic areas and cozy carpeting in the bedrooms, providing the perfect balance of comfort and easy maintenance. The kitchen is updated with granite countertops and sleek black appliances. The expansive unfinished basement offers incredible storage space or the potential to be finished out as a secondary living area, media room, or game room.
-
2023-10-11historical $1,480
-
2023-09-28price $1,480
-
2023-09-27$1,565
-
2021-07-08soldstatus $134,000
-
2021-07-01soldstatus Closed 366-char remark
Show marketing remark (366 chars)
This home has a lot to offer any family looking for a 3 bedroom, 1 ½ bath home in the Florissant area. Huge back yard with room to play or add a pool. All new carpet through out the home and new vinyl floors. Separate dining room that is off the living room that could be combined, kitchen is eat-in and cozy. Basement is not finished so test your DIY skills!
-
2021-06-09status Pending 366-char remark
Show marketing remark (366 chars)
This home has a lot to offer any family looking for a 3 bedroom, 1 ½ bath home in the Florissant area. Huge back yard with room to play or add a pool. All new carpet through out the home and new vinyl floors. Separate dining room that is off the living room that could be combined, kitchen is eat-in and cozy. Basement is not finished so test your DIY skills!
-
2021-06-07$130,000 Active 366-char remark
Show marketing remark (366 chars)
This home has a lot to offer any family looking for a 3 bedroom, 1 ½ bath home in the Florissant area. Huge back yard with room to play or add a pool. All new carpet through out the home and new vinyl floors. Separate dining room that is off the living room that could be combined, kitchen is eat-in and cozy. Basement is not finished so test your DIY skills!
ⓘ Source: listings_history table (triggers on properties + properties_extension) + one-shot
backfill from property_details.listing_events for pre-trigger history.
Tax reassessment forecast MO · Resets to sale price
- Current annual tax
- $1,867 · $156/mo
- Projected year-2 tax
- $1,867 · $156/mo
- Expected delta
- $0/yr ($0/mo · 0.0%)
ⓘ Screening estimate from a state-policy table — verify with the county assessor before closing.
Climate risk First Street
- Flood 1/10 Low FEMA zone X (unshaded) · 0% chance over 30 yrs
- Wildfire 1/10 Low
- Heat 5/10 Major 7 d/yr ≥105°F today · 21 d/yr by 30 yrs out
- Wind 2/10 Low 100% chance of damaging wind over 30 yrs
- Air quality 3/10 Moderate 3 unhealthy d/yr today · 5 by 30 yrs out
Nearby sold comps map
Loading sold comps map…
Walkable amenities ~0.75 mi
Loading nearby amenities…
Taxation est. · year 1
- Rental income
- $19,656
- − Mortgage interest
- −$9,517
- − Property taxes
- −$1,867
- − Insurance
- −$850
- − Repairs & maintenance
- −$1,572
- − Management
- −$1,572
- − Depreciation
- −$4,943
- Taxable loss
- −$664
- Est. tax savings @ 24.0%
- +$159
- After-tax cash flow
- $2,280/yr
For passive investors: Depreciation is non-cash, so a rental often shows a tax loss while cash-flowing — sheltering income. Rental losses are passive: they offset passive income freely, and up to $25,000/yr can offset ordinary (W-2) income if you actively participate and your MAGI is under $100k (phasing out to $0 by $150k); unused losses carry forward. On sale, claimed depreciation is recaptured at up to 25%, and gains may owe capital-gains tax (a 1031 exchange can defer both). Figures are a year-1 estimate at your 24.0% rate — not tax advice; consult a CPA.
Schools (NCES district)
- District
- Ferguson-Florissant R-II
- NCES district ID
- 2912010
- Math proficiency
- 7% ▼ -9.00%
- Reading proficiency
- 20% ▼ -6.00%
- Median HH income
- $44,610
- Composite
- 11.96/100
- National rank
- #9666
- State rank
- #311 of 324 in MO
Livability — Florissant
- Score
- 73/100
- State rank
- #82
- US rank
- #5406
Category grades
Schools grade is shown separately in the Schools card above.
Census & demographics
- Census place
- Florissant, MO
- County
- Saint Louis County · 888,823 people
- City population
- 69,104
- Metro
- St. Louis, MO-IL
- Population (ZIP)
- 43,056
- Household income
- $66,776
- Rent vs Own
- Severe rent burden
- 1429.0
Population outlook (St. Louis County) Hauer SSP2
- Today (2025)
- 1,025,227 people
- By 2030
- 1,028,023 · +0.3%
- By 2040
- 1,020,940 · -0.4%
- By 2050
- 1,007,280 · -1.8%
- By 2075
- 987,277 · -3.7%
- By 2100
- 921,984 · -10.1%
Race, ethnicity, and origin ACS 2023
- Neighborhood character
- Predominantly Black (71%)
- Race & ethnicity
- Black 71% White 23% Two or more races 4% Hispanic / Latino 1%
- Common ancestry
- Romanian 1% Lithuanian 1% Italian 1%
- Foreign-born
- 3% · Canada, Vietnam
- Languages at home
- 95% English-only · Spanish 1% French/Haitian/Cajun 1%
Political lean MEDSL · St. Louis
- 2024 margin
- Strong D (+23.4) · D 60.8% · R 37.4% · Other 1.7%
- 2008→2024 swing
- +3.5pp toward D · 2008: 19.9pp · 2024: 23.4pp
- All cycles
- 2024: D+23.4 2020: D+24.0 2016: D+16.2 2012: D+13.7 2008: D+19.9
Not yet ingested
- Civics
- —
Market trends
- HPI YoY
- ▲ 13.78%
- Current HPI
- 570.6
- Rent YoY
- ▲ 7.51%
- Metro
- St. Louis, MO-IL
- State GDP YoY
- ▲ 1.84%
- F500 in state
- 20
Industry mix (Fortune 500 HQ in MO)
| Industry | F500 HQs | Revenue |
|---|---|---|
| Healthcare | 1 | $163B |
|
||
| Insurance | 1 | $21B |
|
||
| Industrial Technology | 1 | $17B |
|
||
| Retail | 1 | $16B |
|
||
| Industrial Distribution | 1 | $10B |
|
||
| Utilities | 1 | $9B |
|
||
Price history
+30.7% since first listed10 events — show timeline
- 2026-05-06 Pending — MARIS as Distributed by MLS Grid
- 2026-03-20 Price Changed $169,900 MARIS as Distributed by MLS Grid
- 2026-02-17 Listed $174,900 MARIS as Distributed by MLS Grid
- 2023-10-11 Rental Removed $1,480 RENTLY
- 2023-09-28 Price Changed $1,480 RENTLY
- 2023-09-27 Listed for Rent $1,565 RENTLY
- 2021-07-08 Sold (Public Records) $134,000 Public Records
- 2021-07-01 Sold (MLS) — MARIS as Distributed by MLS Grid
- 2021-06-09 Pending — MARIS as Distributed by MLS Grid
- 2021-06-07 Listed $130,000 MARIS as Distributed by MLS Grid
Property tax history
+0.8%/yrLatest (2022): $1,867 · +1.7% YoY. Source: county tax records.
Cash-flow waterfall
monthlySold comps — $/sqft
last 12 mo · ≤1 miLoading sold comps…