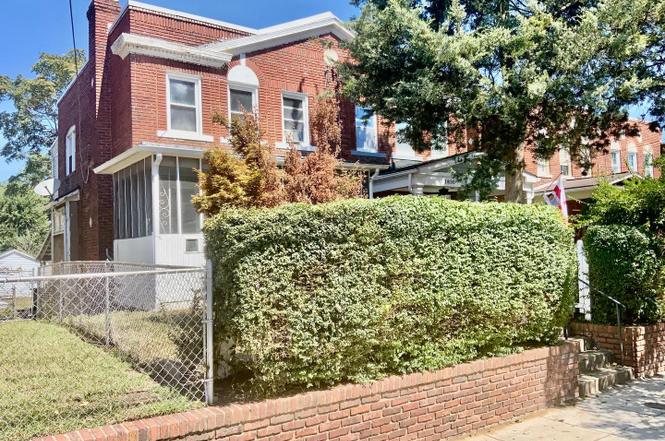
1828 Newton St NE · Washington, DC
Flood risk 6/10 · Moderate
- FEMA flood zone
- X (unshaded)
- Chance of flooding over 30 yrs
- 0.69%
- Est. flood insurance / yr
- $473 – $860
Fire risk 1/10 · Minimal
- Est. fire insurance / yr
- $631 – $1,173
Heat risk 7/10 · Major
- Hot days now (above 106°F)
- 7 days/yr
- Hot days in 30 yrs
- 15 days/yr
Wind risk 4/10 · Minor
- Chance of severe wind over 30 yrs
- 17.0%
Air-quality risk 4/10 · Minor
- Unhealthy air days now
- 4 days/yr
- Unhealthy air days in 30 yrs
- 5 days/yr
Risk factors via First Street. Map © Google.
Why this score? — see what drove the D+ grade
The composite is a weighted blend of 9 inputs, each scored 0–100. Each bar is that input's sub-score; the figure is the points it added to the 100-point composite (weight × sub-score).
- ARV discount +15.0/15.0
- Cash flow +14.5/30.0
- DSCR +4.4/10.0
- Livability +3.7/5.0
- Schools +3.6/10.0
- 1% rule +2.8/10.0
- Rent growth +2.5/5.0
- Condition / age +2.5/5.0
- Appreciation +0.0/10.0
$399,900
🖨 Deal sheet 📄 Offer letter ✓ Due diligence
Listing remarks
Welcome to 1828 Newton Street NE! This semi-detached home is being sold AS-IS and is ready for your complete renovation. Featuring 3 bedrooms, 1.5 bathrooms, and a walkout basement, the property is currently a shell perfect for investors or buyers looking for a project to bring their vision to life. Located in the sought-after Brookland neighborhood, you’ll enjoy easy access to transportation and conveniences. The Brookland/CUA Metro is less than a mile away, and multiple bus stops are just a block from your doorstep. A variety of restaurants, cafes, shops, and even Costco are all nearby. Don’t miss this unique opportunity to create your dream home or investment property in one
Key facts
- Built 1926
- Listed 26 days
Neighborhood map
What this means for you Summary
Snapshot
- This is a 3-bed/1.5-bath single-family listed at $400k.
Deal economics
- At list price, monthly cash flow is $88 ($1k/yr) — positive.
- The deal already cash-flows at list — no discount required.
- To meet the 1% rule (rent ≥ 1% of price), the offer needs to be $312k (22.0% below list).
- Recommended offer: $312k (22.0% below list) — sets the bar for 1% rule.
- Cap rate 6.6% vs local median 2.5% in Washington — top-decile yield for the area; either an underpriced asset or a hidden risk that comps aren't pricing in. Stress-test before assuming the spread holds.
Location & tenants
- Location reads 73/100 on livability (#1 in DC) — a middle-class / working-renter tenant base. Strengths: amenities A+, commute A+, employment A+; Watch: crime F, cost of living F.
- District Of Columbia Public Schools (urban): math 33% / reading 40% proficiency, ranked #8 of 32 in DC (top 25%) — families likely to look elsewhere, expect single-tenant / working-renter base with shorter leases; 65% free/reduced lunch — lower-income household profile, screen leases tightly.
- Market conditions: Rents flat; 114 active listings in the ZIP; 40 comparable units currently listed for rent nearby; rentals at typical pace (median 19d on market — plan ~3-4 weeks tenant-placement turnaround); solid renter incomes; 1,737 units permitted in District of Columbia in 2024 (1,506 in 5+ unit buildings).
- This rent runs 41% of the median local income ($91k/yr) — at the standard rent-burdened threshold; future hikes will face affordability resistance.
Forward outlook
- Local home prices are declining (-3.0%/yr); year-one equity from $3k of loan paydown is wiped out by about $12k of value loss. Plan a longer hold.
- District of Columbia County population projected at +50% by 2050 — long-run rental-demand tailwind backs the buy-and-hold thesis.
Negotiation context
- It's been on market 26 days — a 2% lower offer ($394k) is reasonable based on typical stale-listing flexibility.
Risks & watch-outs
- Watch-outs: built in 1926 — expect roof / HVAC / electrical / plumbing capex.
- Climate carrying-cost: major flood risk; extreme-heat days projected 7→15/yr by 2055 (HVAC capex compounding) — expect insurance premiums to compound above CPI over the hold.
Questions for the listing agent
- Built in 1926 — when were the roof, HVAC, electrical panel, plumbing, and water heater last replaced?
- Is there a deadline driving the sale (1031 exchange, divorce, estate, relocation)? That informs how much negotiation room exists.
- Crime grade is F in this area — have there been break-ins, vandalism, or insurance claims at this property in the last 3 years? What carrier currently insures it and at what premium?
- The area grade is low — what's the realistic commute time and amenity access for the typical tenant pool here? Any planned neighborhood developments (good or bad) we should know about?
- What's the average days-on-market for RENTAL listings here right now (not sales)? A rising rental-DOM trend means longer vacancies and softer asking-rent achievability than the comps imply.
- What's the recent tenant-quality profile in this submarket — average credit score on applications, eviction rate, late-payment / NSF rate, and stable-employment percentage? A property-management company in the area should have these aggregated.
- How much new for-sale + rental construction is in the pipeline within 1–3 miles? Heavy new supply typically softens prices + rents 12–24 months out; constrained supply supports both.
Investment metrics
- 1% rule
- 0.78% ✗
- Cap rate
- 6.56%
- Cash-on-cash
- 0.94%
- DSCR
- 1.04
- GRM
- 10.7
CMA / ARV
- ARV (on-the-fly)
- $659,016
- Comps found
- 12
Show comp detail 12 sales within ~0.75 mi
| Address | Dist | Beds/Ba | Sqft | Sold | Price | $/sf | Match |
|---|---|---|---|---|---|---|---|
| 1348 Newton St NE | 0.47mi | 3/2.0 | 1,380 (+2%) | 4mo | $750,000 | $543 | 70 |
| 3314 16th St NE | 0.30mi | 3/1.5 | 1,200 (-12%) | 1mo | $640,000 | $533 | 66 |
| 4100 20th St NE | 0.39mi | 3/2.5 | 1,474 (+9%) | 2mo | $565,000 | $383 | 61 |
| 1226 Quincy St NE | 0.64mi | 3/1.5 | 1,266 (-7%) | 2mo | $705,000 | $557 | 58 |
| 4001 20th St NE | 0.32mi | 2/2.5 (-1) | 1,495 (+10%) | 4mo | $430,000 | $288 | 56 |
| 1358 Newton St NE | 0.45mi | 2/2.0 (-1) | 1,200 (-12%) | 0mo | $442,300 | $369 | 52 |
| 3731 Oakview Ter NE | 0.61mi | 4/2.0 (+1) | 1,443 (+6%) | 2mo | $810,000 | $561 | 52 |
| 3002 South Dakota Ave NE | 0.69mi | 3/2.0 | 1,269 (-6%) | 4mo | $360,000 | $284 | 52 |
| 3141 Central Ave NE | 0.68mi | 3/1.5 | 1,232 (-9%) | 2mo | $599,000 | $486 | 51 |
| 1342 Hamlin St NE | 0.62mi | 2/2.0 (-1) | 1,498 (+10%) | 4mo | $550,000 | $367 | 43 |
| 3109 14th St NE | 0.52mi | 2/2.0 (-1) | 1,552 (+14%) | 3mo | $575,000 | $370 | 43 |
| 1303 Girard St NE | 0.74mi | 4/3.0 (+1) | 1,270 (-6%) | 4mo | $705,000 | $555 | 40 |
Match score weights: distance 35% · size 25% · config 20% · recency 20%. Top-matched comps best support the ARV.
Projected returns pro-forma
-3.0% appreciation · 0.06% rent growth · sell at horizon
- IRR
- -17.7%
- Equity multiple
- 0.39×
- Total profit
- $-68,355
- Equity at exit
- $59,626
- IRR
- -15.8%
- Equity multiple
- 0.22×
- Total profit
- $-87,767
- Equity at exit
- $34,576
Cash invested: $111,972 (down + closing). Projections, not guarantees.
Landlord ↔ Tenant lean methodology
- Overall (CITY)
- 0 Strongly Tenant-Friendly
- State District of Columbia
- 12 Strongly Tenant-Friendly · D+43
- County
- — inherits STATE
- City Washington
- 0 Strongly Tenant-Friendly · D+43
ZIP-level market 20018
- Rents YoY
- 0.1%
- Active inventory
- 114
- Price-to-rent
- 10.7×
Monthly cashflow live
- Estimated rent
- $3,119 high interval (Pro) →
- Mortgage (P&I)
- −$2,097
- Tax from tax record
- −$112 /mo · $1,347/yr
- Insurance
- −$167
- HOA
- −$0
- Vacancy / Maint / Mgmt
- −$655
- Net cashflow
- $88
Break-even live
UW: 25.0% down · 7.5% · 30yr · 1.5% tax · 5.0% vac · 8.0% maint · 8.0% mgmt
Financing live
Cash to close
- Down payment
- $99,975
- Closing costs
- $11,997
- Reserves months
- —
- Total cash needed
- —
Loan-product check · same deal, 3 products live
Conventional
25% down · 7.5% · 30yr
- Down + closing
- —
- Monthly P&I
- —
- Monthly cashflow
- —
- DSCR
- —
- Eligible?
- —
Personal DTI + credit; lowest rate.
DSCR
20% down · 8.5% · 30yr
- Down + closing
- —
- Monthly P&I
- —
- Monthly cashflow
- —
- DSCR
- —
- Eligible?
- —
No personal income docs; deal must DSCR.
Hard money
10% down · 12.0% · 12mo
- Down + closing
- —
- Monthly P&I
- —
- Monthly cashflow
- —
- DSCR
- —
- Eligible?
- —
Short-term bridge; refi at stabilization.
Rent comps 40 comps
| Address | Beds | Baths | Sqft | Rent | $/sqft | DOM | Units | Dist |
|---|---|---|---|---|---|---|---|---|
| 2417 Otis St NE Washington, DC | 3.0 | 2.5 | 1854 | $3,899 | $2.10 | 7d | 1 | 0.37mi |
| 3011 20th St NE Washington, DC | 3.0 | 2.0 | 1103 | $5,600 | $5.08 | 24d | 1 | 0.39mi |
| 3119 S Dakota Ave NE Unit A Washington, DC | 2.0 | 1.0 | 1676 | $1,900 | $1.13 | 24d | 1 | 0.44mi |
| 3119 S Dakota Ave NE Unit B Washington, DC | 2.0 | 1.0 | 1676 | $1,800 | $1.07 | 24d | 1 | 0.44mi |
| 2414 Hamlin Pl NE Washington, DC | 3.0 | 1.5 | 1500 | $2,550 | $1.70 | 18d | 1 | 0.53mi |
| 4101 Kaywood Pl Mt Rainier, MD | 2.0 | 1.0 | 715 | $1,698 | $2.37 | 4d | 17 | 0.65mi |
| 1663 Webster St NE Washington, DC | 4.0 | 2.5 | 1758 | $3,757 | $2.14 | 18d | 1 | 0.71mi |
| 3614 12th St NE #7 Washington, DC | 2.0 | 2.0 | 898 | $3,400 | $3.79 | 7d | 1 | 0.72mi |
| 3614 12th St NE Washington, DC | 1.0–2.0 | 1.0–2.0 | 695 | $3,400 | $4.89 | 14d | 2 | 0.72mi |
| 4221 28th St Mount Rainier, MD | 3.0 | 3.0 | 1800 | $3,500 | $1.94 | 18d | 1 | 0.79mi |
| 3018 12th St NE #2 Washington, DC | 2.0 | 2.0 | 880 | $3,000 | $3.41 | 24d | 1 | 0.80mi |
| 4202 30th St Mount Rainier, MD | 3.0 | 1.0 | 1324 | $2,450 | $1.85 | 24d | 1 | 0.81mi |
| 2425 20th St NE Unit 18 Washington, DC | 2.0 | 2.0 | 900 | $2,400 | $2.67 | 7d | 1 | 0.83mi |
| 1816 Bryant St NE #1816 Washington, DC | 3.0 | 1.5 | 1026 | $3,000 | $2.92 | 24d | 1 | 0.84mi |
| 2413 14th St NE Washington, DC | 1.0–5.0 | 1.0–2.0 | 1121 | $2,332 | $2.08 | 3d | 46 | 0.85mi |
| 1704 Montana Ave NE Washington, DC | 4.0 | 2.0 | 1518 | $4,000 | $2.64 | 24d | 1 | 0.91mi |
| 4401 29th St Unit A Mt Rainier, MD | 4.0 | 2.0 | 1800 | $3,500 | $1.94 | 5d | 1 | 0.91mi |
| 1417 Downing St NE Washington, DC | 4.0 | 2.0 | 1538 | $4,200 | $2.73 | 4d | 1 | 0.91mi |
| 2324 15th St NE Washington, DC | 3.0 | 2.5 | 1398 | $3,880 | $2.78 | 24d | 1 | 0.92mi |
| 1228 Wynton Pl NE Unit NA Washington, DC | 3.0 | 2.5 | 1500 | $3,950 | $2.63 | 17d | 1 | 0.92mi |
| 2300 18th St NE #2300 Washington, DC | 4.0 | 3.0 | 1826 | $4,500 | $2.46 | 22d | 1 | 0.93mi |
| 4450 Joseph Pl NE Washington, DC | 3.0 | 2.5 | 1460 | $4,095 | $2.80 | 24d | 1 | 0.96mi |
| 2726 10th St NE Washington, DC | 3.0 | 2.5 | 1400 | $4,000 | $2.86 | 24d | 1 | 0.99mi |
| 4312 10th St NE Washington, DC | 3.0 | 2.5 | 1602 | $3,900 | $2.43 | 7d | 1 | 1.00mi |
| 2720 10th St NE Washington, DC | 3.0 | 1.5 | 1400 | $1,580 | $1.13 | 7d | 1 | 1.00mi |
| 2218 16th St NE Washington, DC | 4.0 | 2.5 | 1496 | $3,400 | $2.27 | 18d | 1 | 1.00mi |
| 708 Irving St NE #202 Washington, DC | 2.0 | 2.0 | 920 | $2,975 | $3.23 | 24d | 1 | 1.03mi |
| 2206 15th St NE Washington, DC | 3.0 | 2.0 | 1184 | $2,500 | $2.11 | 24d | 1 | 1.03mi |
| 4812 Crest View Dr Hyattsville, MD | 3.0 | 3.0 | 1280 | $3,500 | $2.73 | 12d | 1 | 1.04mi |
| 1334 Downing St NE Washington, DC | 3.0 | 1.0 | 1408 | $3,000 | $2.13 | 24d | 1 | 1.04mi |
| 625 Monroe St NE Washington, DC | 2.0 | 1.0–2.0 | 829 | $3,648 | $4.40 | 2d | 26 | 1.04mi |
| 2400 Queens Chapel Rd Hyattsville, MD | 2.0 | 1.0–2.0 | 752 | $1,935 | $2.57 | 3d | 10 | 1.05mi |
| 4044 7th St NE Unit 4 Washington, DC | 2.0 | 1.0 | 900 | $1,998 | $2.22 | 22d | 1 | 1.07mi |
| 3026 Channing St NE Washington, DC | 2.0 | 1.0 | 1224 | $2,399 | $1.96 | 24d | 1 | 1.08mi |
| 2607 Reed St NE Washington, DC | 2.0 | 1.0–2.0 | 704 | $2,936 | $4.17 | 2d | 19 | 1.09mi |
| 2600 Queens Chapel Rd Hyattsville, MD | 1.0–3.0 | 1.0–2.0 | 1086 | $2,545 | $2.34 | 12d | 9 | 1.12mi |
| 3467 Summit Ct NE Washington, DC | 2.0 | 1.0 | 982 | $2,600 | $2.65 | 24d | 1 | 1.13mi |
| 806 Channing Pl NE Washington, DC | 2.0 | 1.0–2.0 | 726 | $2,763 | $3.81 | 1d | 28 | 1.15mi |
| 4519 32nd St Mount Rainier, MD | 3.0 | 2.0 | 1500 | $1,200 | $0.80 | 12d | 1 | 1.16mi |
| 622 Girard St NE Unit 301 Washington, DC | 2.0 | 1.0 | 900 | $1,995 | $2.22 | 24d | 1 | 1.17mi |
Listing history 5 events
-
2025-10-05status Pending
-
2025-09-22price $399,900
-
2025-09-15price $450,000
-
2025-09-10$499,900 Active
-
2025-09-09historical $499,900
ⓘ Source: listings_history table (triggers on properties + properties_extension) + one-shot
backfill from property_details.listing_events for pre-trigger history.
Tax reassessment forecast DC · Partial reset (capped growth)
- Current annual tax
- $1,347 · $112/mo
- Projected year-2 tax
- $1,893 · $158/mo
- Expected delta
- +$546/yr (+$46/mo · 40.6%)
ⓘ Screening estimate from a state-policy table — verify with the county assessor before closing.
Climate risk First Street
- Flood 6/10 Major FEMA zone X (unshaded) · 69% chance over 30 yrs
- Wildfire 1/10 Low
- Heat 7/10 Severe 7 d/yr ≥106°F today · 15 d/yr by 30 yrs out
- Wind 4/10 Moderate 17% chance of damaging wind over 30 yrs
- Air quality 4/10 Moderate 4 unhealthy d/yr today · 5 by 30 yrs out
Nearby sold comps map
Loading sold comps map…
Walkable amenities ~0.75 mi
Loading nearby amenities…
Taxation est. · year 1
- Rental income
- $37,426
- − Mortgage interest
- −$22,401
- − Property taxes
- −$1,347
- − Insurance
- −$2,000
- − Repairs & maintenance
- −$2,994
- − Management
- −$2,994
- − Depreciation
- −$11,633
- Taxable loss
- −$5,942
- Est. tax savings @ 24.0%
- +$1,426
- After-tax cash flow
- $2,481/yr
For passive investors: Depreciation is non-cash, so a rental often shows a tax loss while cash-flowing — sheltering income. Rental losses are passive: they offset passive income freely, and up to $25,000/yr can offset ordinary (W-2) income if you actively participate and your MAGI is under $100k (phasing out to $0 by $150k); unused losses carry forward. On sale, claimed depreciation is recaptured at up to 25%, and gains may owe capital-gains tax (a 1031 exchange can defer both). Figures are a year-1 estimate at your 24.0% rate — not tax advice; consult a CPA.
Schools (NCES district)
- District
- District Of Columbia Public Schools
- NCES district ID
- 1100030
- Math proficiency
- 33% ▲ 3.00%
- Reading proficiency
- 40% ▲ 5.00%
- Median HH income
- $67,671
- Composite
- 35.84/100
- National rank
- #9606
- State rank
- #8 of 32 in DC
Livability — Washington
- Score
- 73/100
- State rank
- #1
- US rank
- #5327
Category grades
Schools grade is shown separately in the Schools card above.
Census & demographics
- Census place
- Washington, DC
- County
- District of Columbia · 671,873 people
- City population
- 671,873
- Metro
- Washington-Arlington-Alexandria, DC-VA-MD-WV
- Population (ZIP)
- 19,562
- Household income
- $90,639
- Rent vs Own
- Severe rent burden
- 919.0
Population outlook (District of Columbia County) Hauer SSP2
- Today (2025)
- 821,926 people
- By 2030
- 899,517 · +9.4%
- By 2040
- 1,061,162 · +29.1%
- By 2050
- 1,231,493 · +49.8%
- By 2075
- 1,603,312 · +95.1%
- By 2100
- 1,847,141 · +124.7%
Race, ethnicity, and origin ACS 2023
- Neighborhood character
- Predominantly Black (66%)
- Race & ethnicity
- Black 66% White 18% Hispanic / Latino 9% Two or more races 8% Asian 1%
- Hispanic origin (detail)
- Mexican 2% Dominican 1%
- Common ancestry
- Italian 2% Romanian 1% Serbian 1%
- Foreign-born
- 8% · Canada
- Languages at home
- 89% English-only · Spanish 8% Other Indo-European 1% German/W. Germanic 1%
Political lean MEDSL · District of Columbia
- 2024 margin
- Solid D (+86.1) · D 91.2% · R 5.1% · Other 3.8%
- 2008→2024 swing
- +0.1pp no change · 2008: 85.9pp · 2024: 86.1pp
- All cycles
- 2024: D+86.1 2020: D+86.8 2016: D+88.7 2012: D+84.2 2008: D+85.9
Not yet ingested
- Civics
- —
Market trends
- HPI YoY
- ▼ -605.95%
- Current HPI
- 381.7099
- Rent YoY
- ▲ 0.06%
- Metro
- Washington-Arlington-Alexandria, DC-VA-MD-WV
- State GDP YoY
- ▲ 1.33%
- F500 in state
- 6
Industry mix (Fortune 500 HQ in DC)
| Industry | F500 HQs | Revenue |
|---|---|---|
| Financial Services | 1 | $153B |
|
||
| Life Sciences / Industrials | 1 | $25B |
|
||
| Industrial Machinery | 1 | $8B |
|
||
Price history
-20.0% since first listed5 events — show timeline
- 2025-10-05 Pending — BRIGHT MLS
- 2025-09-22 Price Changed $399,900 BRIGHT MLS
- 2025-09-15 Price Changed $450,000 BRIGHT MLS
- 2025-09-10 Listed $499,900 BRIGHT MLS
- 2025-09-09 Coming Soon $499,900 BRIGHT MLS
Property tax history
+10.0%/yrLatest (2025): $1,347 · +1.1% YoY. Source: county tax records.
Cash-flow waterfall
monthlySold comps — $/sqft
last 12 mo · ≤1 miLoading sold comps…