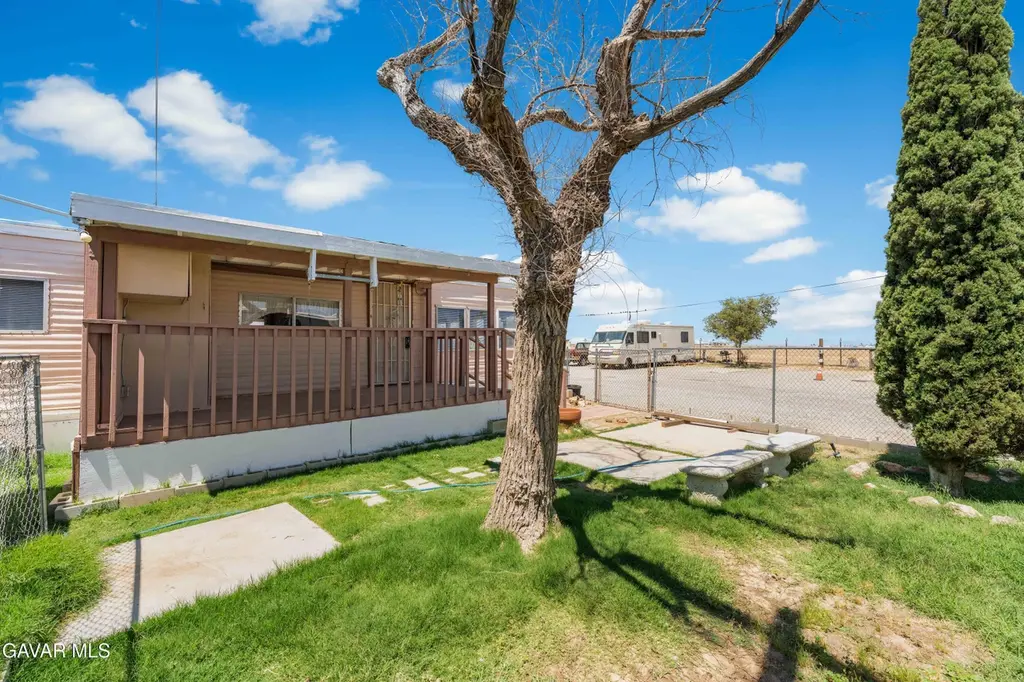
2121 Nadeau Unit C-1 · Mojave, CA
Flood risk 1/10 · Minimal
- FEMA flood zone
- AO
- Chance of flooding over 30 yrs
- 0.0%
- Est. flood insurance / yr
- $848 – $2,087
Fire risk 4/10 · Minor
- Est. fire insurance / yr
- $659 – $1,223
Heat risk 7/10 · Major
- Hot days now (above 101°F)
- 6 days/yr
- Hot days in 30 yrs
- 16 days/yr
Wind risk 1/10 · Minimal
- Chance of severe wind over 30 yrs
- —
Air-quality risk 8/10 · Major
- Unhealthy air days now
- 17 days/yr
- Unhealthy air days in 30 yrs
- 19 days/yr
Risk factors via First Street. Map © Google.
Why this score? — see what drove the A- grade
The composite is a weighted blend of 9 inputs, each scored 0–100. Each bar is that input's sub-score; the figure is the points it added to the 100-point composite (weight × sub-score).
- Cash flow +30.0/30.0
- ARV discount +15.0/15.0
- 1% rule +10.0/10.0
- DSCR +10.0/10.0
- Appreciation +5.7/10.0
- Livability +2.8/5.0
- Rent growth +2.5/5.0
- Condition / age +2.5/5.0
- Schools +2.1/10.0
$54,900
🖨 Deal sheet 📄 Offer letter ✓ Due diligence
Listing remarks MLS
Come make this spacious Double wide your new home! Located in an established this 3 Bedroom 2 Bathroom plus a bonus room features an open floor plan with a large kitchen perfect for everyday living as well as gatherings. Washer and dryer hookups included. enjoy a private fenced yard for added space and comfort. an excellent opportunity to own at an incredible price. Conveniently located near main roads and freeway access. A must see! Buyer to verify
Key facts
- Built 1974
- Listed 72 days
Neighborhood map
What this means for you Summary
Snapshot
- This is a 3-bed/1.0-bath manufactured listed at $55k.
Deal economics
- At list price, monthly cash flow is $512 ($6k/yr) — positive.
- The deal already cash-flows at list — no discount required.
- Meets the 1% rule at list price ($1k rent vs $55k).
- Recommended offer: $52k (6.0% below list) — sets the bar for market timing.
- Cap rate 20.1% vs local median 3.7% in Mojave — top-decile yield for the area; either an underpriced asset or a hidden risk that comps aren't pricing in. Stress-test before assuming the spread holds.
Location & tenants
- Location reads 55/100 on livability (#873 in CA) — a working-class tenant base; expect higher turnover. Strengths: housing A+, commute A-; Watch: crime C-, schools F, amenities F.
- Mojave Unified (town): math 25% / reading 25% proficiency, ranked #411 of 517 in CA (top 80%) — low school quality limits family demand, transient renter base, plan for 1-2y turnover; 76% free/reduced lunch — lower-income household profile, screen leases tightly.
- Market conditions: 278 active listings in the ZIP; 5 comparable units currently listed for rent nearby; rentals at typical pace (median 24d on market — plan ~3-4 weeks tenant-placement turnaround); 3,244 units permitted in Kern County in 2024 (73 in 5+ unit buildings).
Forward outlook
- In year one you build about $1k of equity ($380 loan paydown + $728 appreciation (1.3% local appreciation)).
- Kern County population projected at +17% by 2050 — long-run rental-demand tailwind backs the buy-and-hold thesis.
- At projected returns (1.3% appreciation + 3.0% rent growth), your $15k cash investment doubles in ~3 years — after that, you're playing with house money.
Negotiation context
- It's been on market 72 days — a 6% lower offer ($52k) is reasonable based on typical stale-listing flexibility.
- 4 sale attempts with the ask held roughly flat each time — persistent listings suggest the price (not the market) is what's stuck; bring a comps-based counter.
Risks & watch-outs
- Watch-outs: flood insurance adds $122/mo.
- Climate carrying-cost: in FEMA flood zone AO (mandatory federal flood insurance); extreme-heat days projected 6→16/yr by 2055 (HVAC capex compounding) — expect insurance premiums to compound above CPI over the hold.
Questions for the listing agent
- It's been on market 72 days. Have you received any prior offers? Is the seller open to a 6% concession, seller financing, or rate buy-down credit?
- Built in 1974 — when were the roof, HVAC, electrical panel, plumbing, and water heater last replaced?
- What's the actual annual flood-insurance premium (NFIP or private), and is the property in a SFHA with mandatory coverage?
- Why hasn't it sold? Are there any deal-killer items the seller is aware of (foundation, flood, title, zoning, code violations)?
- Is there a deadline driving the sale (1031 exchange, divorce, estate, relocation)? That informs how much negotiation room exists.
- Schools are F-rated, which usually means shorter tenancies and higher turnover. Who's the typical renter profile here, and what's been the actual vacancy rate?
- What's the average days-on-market for RENTAL listings here right now (not sales)? A rising rental-DOM trend means longer vacancies and softer asking-rent achievability than the comps imply.
- What's the recent tenant-quality profile in this submarket — average credit score on applications, eviction rate, late-payment / NSF rate, and stable-employment percentage? A property-management company in the area should have these aggregated.
- How much new for-sale + rental construction is in the pipeline within 1–3 miles? Heavy new supply typically softens prices + rents 12–24 months out; constrained supply supports both.
Investment metrics
- 1% rule
- 2.34% ✓
- Cap rate
- 20.15%
- Cash-on-cash
- 49.49%
- DSCR
- 3.20
- GRM
- 3.6
CMA / ARV
- ARV (median comp)
- $85,221
- List price
- $54,900
- Delta
- -35.58%
- Verdict
- UNDERPRICED
- Comps
- 1 within 2.0 mi
Projected returns pro-forma
1.33% appreciation · 3.0% rent growth · sell at horizon
- IRR
- 43.0%
- Equity multiple
- 3.25×
- Total profit
- $34,589
- Equity at exit
- $19,679
- IRR
- 44.6%
- Equity multiple
- 6.46×
- Total profit
- $83,873
- Equity at exit
- $26,891
Cash invested: $15,372 (down + closing). Projections, not guarantees.
Landlord ↔ Tenant lean methodology
- Overall (STATE)
- 18 Strongly Tenant-Friendly
- State California
- 18 Strongly Tenant-Friendly · D+13
- County
- — inherits STATE
- City
- — inherits STATE
ZIP-level market 93501
- Home prices YoY
- 0.2%
- Active inventory
- 278
- Price-to-rent
- 3.6×
Monthly cashflow live
- Estimated rent
- $1,283 high interval (Pro) →
- Mortgage (P&I)
- −$288
- Tax est. 1.5%
- −$69 /mo · $824/yr
- Insurance
- −$23
- Flood insurance flood zone
- −$122 /mo · $1,468/yr
- HOA
- −$0
- Vacancy / Maint / Mgmt
- −$269
- Net cashflow
- $512
Break-even live
UW: 25.0% down · 7.5% · 30yr · 1.5% tax · 5.0% vac · 8.0% maint · 8.0% mgmt
Financing live
Cash to close
- Down payment
- $13,725
- Closing costs
- $1,647
- Reserves months
- —
- Total cash needed
- —
Loan-product check · same deal, 3 products live
Conventional
25% down · 7.5% · 30yr
- Down + closing
- —
- Monthly P&I
- —
- Monthly cashflow
- —
- DSCR
- —
- Eligible?
- —
Personal DTI + credit; lowest rate.
DSCR
20% down · 8.5% · 30yr
- Down + closing
- —
- Monthly P&I
- —
- Monthly cashflow
- —
- DSCR
- —
- Eligible?
- —
No personal income docs; deal must DSCR.
Hard money
10% down · 12.0% · 12mo
- Down + closing
- —
- Monthly P&I
- —
- Monthly cashflow
- —
- DSCR
- —
- Eligible?
- —
Short-term bridge; refi at stabilization.
Rent comps 5 comps
| Address | Beds | Baths | Sqft | Rent | $/sqft | DOM | Units | Dist |
|---|---|---|---|---|---|---|---|---|
| 16193 H St Mojave, CA | 2.0 | 2.0 | 902 | $1,245 | $1.38 | 21d | 1 | 0.42mi |
| 16193 H St Mojave, CA | 2.0 | 2.0 | 902 | $1,245 | $1.38 | 14d | 1 | 0.42mi |
| 16193 H St Unit 01-204 Mojave, CA | 2.0 | 2.0 | 902 | $919 | $1.02 | 23d | 1 | 0.42mi |
| 3171 Milton Dr Mojave, CA | 4.0 | 2.0 | 1620 | $1,950 | $1.20 | 23d | 1 | 1.10mi |
| 15950 Lawrence Dr Mojave, CA | 3.0 | 2.0 | 1332 | $1,500 | $1.13 | 23d | 1 | 1.11mi |
Listing history 23 events
-
2026-06-18days on market $54,900 Active 72 DOM
-
2026-06-17days on market $54,900 Active 71 DOM
-
2026-06-16days on market $54,900 Active 70 DOM
-
2026-06-15days on market $54,900 Active 69 DOM
-
2026-06-14days on market $54,900 Active 67 DOM
-
2026-06-13days on market $54,900 Active 66 DOM
-
2026-06-10days on market $54,900 Active 64 DOM
-
2026-06-09days on market $54,900 Active 63 DOM
-
2026-06-08days on market $54,900 Active 62 DOM
-
2026-06-07days on market $54,900 Active 61 DOM
-
2026-06-05days on market $54,900 Active 58 DOM
-
2026-06-03days on market $54,900 Active 57 DOM
-
2026-06-03days on market $54,900 Active 56 DOM
-
2026-06-01days on market $54,900 Active 55 DOM
-
2026-05-31days on market $54,900 Active 54 DOM
-
2026-04-07$54,900 Active
Show marketing remark (453 chars)
Come make this spacious Double wide your new home! Located in an established this 3 Bedroom 2 Bathroom plus a bonus room features an open floor plan with a large kitchen perfect for everyday living as well as gatherings. Washer and dryer hookups included. enjoy a private fenced yard for added space and comfort. an excellent opportunity to own at an incredible price. Conveniently located near main roads and freeway access. A must see! Buyer to verify
-
2026-04-07$54,900 Active 453-char remark
Show marketing remark (453 chars)
Come make this spacious Double wide your new home! Located in an established this 3 Bedroom 2 Bathroom plus a bonus room features an open floor plan with a large kitchen perfect for everyday living as well as gatherings. Washer and dryer hookups included. enjoy a private fenced yard for added space and comfort. an excellent opportunity to own at an incredible price. Conveniently located near main roads and freeway access. A must see! Buyer to verify
-
2025-12-16historical
-
2025-11-05$99,999 Active
-
2025-10-08historical
-
2025-08-07price $119,000
-
2025-08-07price $119,000
-
2025-07-08$149,990 Active
ⓘ Source: listings_history table (triggers on properties + properties_extension) + one-shot
backfill from property_details.listing_events for pre-trigger history.
Climate risk First Street
- Flood 1/10 Low FEMA zone AO · 0% chance over 30 yrs
- Wildfire 4/10 Moderate
- Heat 7/10 Severe 6 d/yr ≥101°F today · 16 d/yr by 30 yrs out
- Wind 1/10 Low
- Air quality 8/10 Severe 17 unhealthy d/yr today · 19 by 30 yrs out
Nearby sold comps map
Loading sold comps map…
Walkable amenities ~0.75 mi
Loading nearby amenities…
Taxation est. · year 1
- Rental income
- $15,393
- − Mortgage interest
- −$3,075
- − Property taxes
- −$824
- − Insurance
- −$1,742
- − Repairs & maintenance
- −$1,231
- − Management
- −$1,231
- − Depreciation
- −$1,597
- Taxable income
- $5,692
- Est. tax owed @ 24.0%
- −$1,366
- After-tax cash flow
- $4,774/yr
For passive investors: Depreciation is non-cash, so a rental often shows a tax loss while cash-flowing — sheltering income. Rental losses are passive: they offset passive income freely, and up to $25,000/yr can offset ordinary (W-2) income if you actively participate and your MAGI is under $100k (phasing out to $0 by $150k); unused losses carry forward. On sale, claimed depreciation is recaptured at up to 25%, and gains may owe capital-gains tax (a 1031 exchange can defer both). Figures are a year-1 estimate at your 24.0% rate — not tax advice; consult a CPA.
Schools (NCES district)
- District
- Mojave Unified
- NCES district ID
- 0625230
- Math proficiency
- 25% ▲ 11.00%
- Reading proficiency
- 25% ▼ -1.00%
- Median HH income
- $43,017
- Composite
- 21.4/100
- National rank
- #8350
- State rank
- #411 of 517 in CA
Livability — Mojave
- Score
- 55/100
- State rank
- #873
- US rank
- #23667
Category grades
Schools grade is shown separately in the Schools card above.
Census & demographics
- Census place
- Mojave, CA
- City population
- 5,944
- Population (ZIP)
- 5,944
Population outlook (Kern County) Hauer SSP2
- Today (2025)
- 947,286 people
- By 2030
- 978,984 · +3.3%
- By 2040
- 1,045,018 · +10.3%
- By 2050
- 1,105,232 · +16.7%
- By 2075
- 1,229,538 · +29.8%
- By 2100
- 1,238,059 · +30.7%
Race, ethnicity, and origin ACS 2023
- Neighborhood character
- Diverse neighborhood (Simpson 0.66)
- Race & ethnicity
- Hispanic / Latino 47% White 26% Black 21% Two or more races 18% Asian 1%
- Hispanic origin (detail)
- Mexican 41%
- Common ancestry
- Slovak 4% Lithuanian 2% Serbian 1%
- Foreign-born
- 13% · Canada, Vietnam
- Languages at home
- 70% English-only · Spanish 28%
Political lean MEDSL · Kern
- 2024 margin
- Strong R (+21.1) · D 38.2% · R 59.3% · Other 2.5%
- 2008→2024 swing
- -3.3pp toward R · 2008: -17.8pp · 2024: -21.1pp
- All cycles
- 2024: R+21.1 2020: R+10.2 2016: R+15.0 2012: R+20.9 2008: R+17.8
Not yet ingested
- Civics
- —
Market trends
- HPI YoY
- ▲ 1.33%
- Current HPI
- 595.661
- Rent YoY
- —
- Metro
- —
- State GDP YoY
- ▲ 3.21%
- F500 in state
- 116
Industry mix (Fortune 500 HQ in CA)
| Industry | F500 HQs | Revenue |
|---|---|---|
| Technology | 27 | $1,492B |
|
||
| Financial Services | 3 | $174B |
|
||
| Retail | 3 | $44B |
|
||
| Insurance | 3 | $26B |
|
||
| Media / Entertainment | 2 | $115B |
|
||
| Pharmaceuticals / Biotech | 2 | $62B |
|
||
Price history
-63.4% since first listed8 events — show timeline
- 2026-04-07 Listed $54,900 AVMLS
- 2026-04-07 Listed $54,900 CRMLS
- 2025-12-16 Listing Removed — CRMLS
- 2025-11-05 Listed $99,999 CRMLS
- 2025-10-08 Listing Removed — CRMLS
- 2025-08-07 Price Changed $119,000 AVMLS
- 2025-08-07 Price Changed $119,000 CRMLS
- 2025-07-08 Listed $149,990 CRMLS
Property tax history
-2.0%/yrLatest (2025): $93 · -5.6% YoY. Source: county tax records.
Cash-flow waterfall
monthlySold comps — $/sqft
last 12 mo · ≤1 miLoading sold comps…