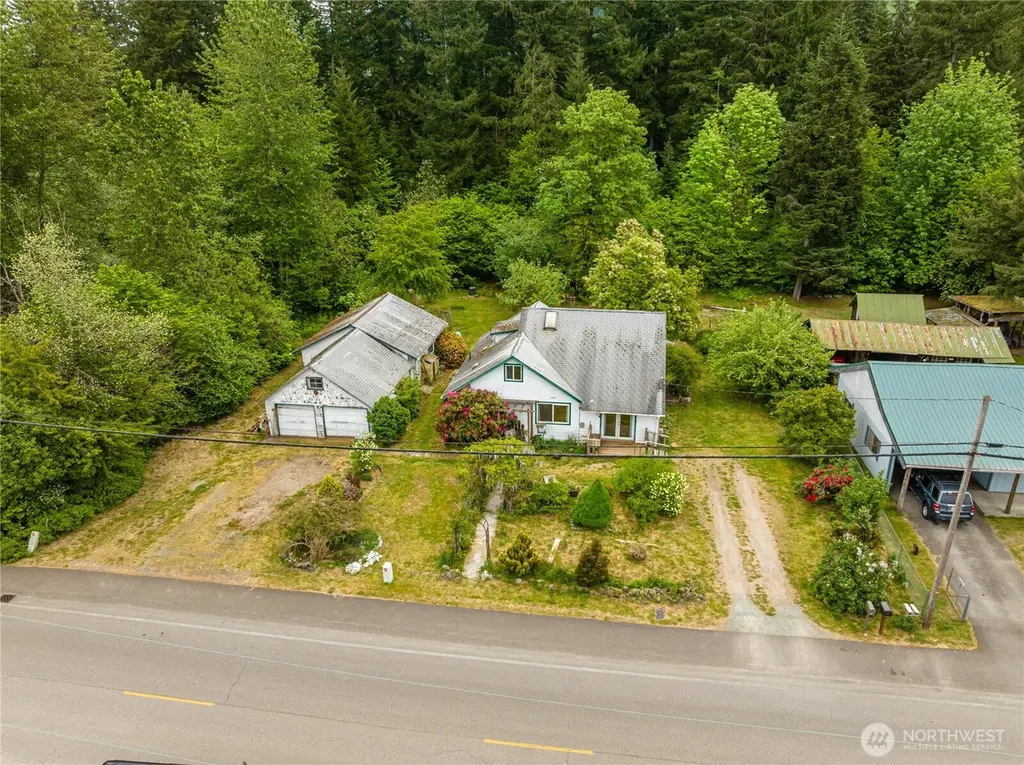
1050 Montague Ave · Darrington, WA
Flood risk 1/10 · Minimal
- FEMA flood zone
- X (unshaded)
- Chance of flooding over 30 yrs
- 0.0%
- Est. flood insurance / yr
- $507 – $1,088
Fire risk 3/10 · Minor
- Est. fire insurance / yr
- $604 – $1,122
Heat risk 3/10 · Minor
- Hot days now (above 87°F)
- 8 days/yr
- Hot days in 30 yrs
- 18 days/yr
Wind risk 1/10 · Minimal
- Chance of severe wind over 30 yrs
- —
Air-quality risk 7/10 · Major
- Unhealthy air days now
- 11 days/yr
- Unhealthy air days in 30 yrs
- 11 days/yr
Risk factors via First Street. Map © Google.
Why this score? — see what drove the D grade
The composite is a weighted blend of 9 inputs, each scored 0–100. Each bar is that input's sub-score; the figure is the points it added to the 100-point composite (weight × sub-score).
- ARV discount +15.0/15.0
- Appreciation +10.0/10.0
- Cash flow +5.1/30.0
- Schools +4.4/10.0
- Livability +3.3/5.0
- Rent growth +2.5/5.0
- Condition / age +2.5/5.0
- 1% rule +0.8/10.0
- DSCR +0.0/10.0
$347,995
🖨 Deal sheet (PDF) 📄 Offer letter ✓ Due diligence
Listing remarks
Nestled in the heart of Darrington, this 2-bedroom, 2-bath home is the perfect opportunity for outdoor enthusiasts and investors alike. Surrounded by the natural beauty of the North Cascades, you’ll enjoy easy access to hiking trails, hunting areas, fishing spots, mountain biking adventures, and nearby archery courses. Whether you’re looking for a full-time residence, weekend getaway, or investment property, this location offers endless recreation right outside your door. With a little sweat equity and vision, this home has the potential to truly shine again. Bring your tools, ideas, and creativity to restore this property to its full potential while enjoying the peaceful small-
Key facts
- Fishing spots
- Hunting areas
- 0.34 acre lot
Tags
Property features AI
Finance
- Other: Senior exemption available
- Financial info: Acceptable financing: Cash, Conventional, Rehab Loan; Buyer brokerage compensation: 2.5%
Exterior
- Parking: Detached garage; 2 covered spaces; 2 uncovered parking spaces
- Utilities: Electric and propane energy sources; Community water (Town of Darrington); Septic tank sewer; Power provided by PUD; Internet service via Ziply
- Home design: Single family residence; Two-story house; Entry on main level; Faces west
- Construction: Built in 1935 (effective year); Wood construction; Composition roof; Built on lot
- Exterior features: Wood exterior products; Deck; Greenhouse; Fruit trees and garden space; Paved lot; Level topography; Has a view
Interior
- Kitchen: Dishwasher; Microwave; Refrigerator; Stove/Range
- Bedrooms: 2 bedrooms total (1 on main level, 1 on upper level); Bedrooms possible: 2
- Flooring: Hardwood; Laminate; Carpet
- Bathrooms: 1 full bathroom; 1 half bathroom; Main level has 1 full and 1 half bath; One bathtub and two showers
- Heating & cooling: Wall furnace heating; No central air
- Interior features: Ceiling fans; Fireplace with gas connection; Skylights; Water heater (electric, located in utility room)
- Laundry & utility: Utility room with water heater
Neighborhood map
What this means for you Summary
Snapshot
- This is a 2-bed/1.0-bath single-family listed at $348k.
Deal economics
- At list price, monthly cash flow is $-810 ($-10k/yr) — negative.
- To cash-flow at today's rent, offer at most $231k (33.7% below list).
- To meet the 1% rule (rent ≥ 1% of price), the offer needs to be $202k (42.0% below list).
- Recommended offer: $202k (42.0% below list) — sets the bar for 1% rule.
Location & tenants
- Location reads 66/100 on livability (#326 in WA) — a middle-class / working-renter tenant base. Strengths: health & safety A+, crime A-, cost of living B; Watch: amenities F, commute F, employment F.
- Darrington School District (rural): math 44% / reading 54% proficiency, ranked #155 of 291 in WA (top 53%) — families likely to look elsewhere, expect single-tenant / working-renter base with shorter leases.
- Zoned schools: Darrington Elementary School (326 students, 64% FRL); Darrington High School (120 students, 48% FRL).
- Market conditions: 14 active listings in the ZIP; 3,982 units permitted in Snohomish County in 2024 (1,492 in 5+ unit buildings).
Forward outlook
- In year one you build about $37k of equity ($2k loan paydown + $35k appreciation (10.0% local appreciation)).
- Snohomish County population projected at +30% by 2050 — long-run rental-demand tailwind backs the buy-and-hold thesis.
- By year 2, paydown + projected appreciation supports a ~$60k cash-out refi (75% LTV) — recoverable capital for the next deal without selling this one.
Negotiation context
- It's been on market 15 days — a 2% lower offer ($343k) is reasonable based on typical stale-listing flexibility.
- Current owner paid $48k; list at $348k implies a 625% gain — meaningful room to come down on a strong offer.
Risks & watch-outs
- Watch-outs: built in 1935 — expect roof / HVAC / electrical / plumbing capex.
Questions for the listing agent
- What do current leases actually rent for vs. the listed asking? Can we see a recent rent roll and the last 12 months of T-12 income?
- Built in 1935 — when were the roof, HVAC, electrical panel, plumbing, and water heater last replaced?
- Is there a deadline driving the sale (1031 exchange, divorce, estate, relocation)? That informs how much negotiation room exists.
- Schools are D-rated, which usually means shorter tenancies and higher turnover. Who's the typical renter profile here, and what's been the actual vacancy rate?
- The area grade is low — what's the realistic commute time and amenity access for the typical tenant pool here? Any planned neighborhood developments (good or bad) we should know about?
- What's the average days-on-market for RENTAL listings here right now (not sales)? A rising rental-DOM trend means longer vacancies and softer asking-rent achievability than the comps imply.
- What's the recent tenant-quality profile in this submarket — average credit score on applications, eviction rate, late-payment / NSF rate, and stable-employment percentage? A property-management company in the area should have these aggregated.
- How much new for-sale + rental construction is in the pipeline within 1–3 miles? Heavy new supply typically softens prices + rents 12–24 months out; constrained supply supports both.
Investment metrics
- 1% rule
- 0.58% ✗
- Cap rate
- 3.50%
- Cash-on-cash
- -9.97%
- DSCR
- 0.56
- GRM
- 14.4
CMA / ARV
- ARV (median comp)
- $471,649
- List price
- $347,995
- Delta
- -26.22%
- Verdict
- UNDERPRICED
- Comps
- 20 within 1.0 mi
Show comp detail 11 sales within ~0.75 mi
| Address | Dist | Beds/Ba | Sqft | Sold | Price | $/sf | Match |
|---|---|---|---|---|---|---|---|
| 1112 Montague Ave | 0.08mi | 3/2.5 (+1) | 1,650 (-0%) | 18mo | $499,900 | $303 | 69 |
| 602 Commercial Ave | 0.65mi | 3/2.0 (+1) | 1,624 (-2%) | 1mo | $431,380 | $266 | 56 |
| 1000 Riddle St | 0.22mi | 3/1.0 (+1) | 1,560 (-6%) | 24mo | $443,000 | $284 | 56 |
| 1065 Montague Ave | 0.03mi | 3/2.5 (+1) | 1,496 (-10%) | 20mo | $470,000 | $314 | 54 |
| 770 Madison Ave | 0.50mi | 3/2.0 (+1) | 1,632 (-1%) | 14mo | $525,000 | $322 | 54 |
| 1172 Darrington St | 0.57mi | 3/2.0 (+1) | 1,563 (-6%) | 1mo | $549,000 | $351 | 54 |
| 1135 Montague Ave | 0.11mi | 3/2.0 (+1) | 1,796 (+8%) | 22mo | $530,000 | $295 | 53 |
| 1055 Montague Ave | 0.03mi | 3/2.5 (+1) | 1,496 (-10%) | 22mo | $499,950 | $334 | 53 |
| 760 Commercial Ave | 0.46mi | 3/2.0 (+1) | 1,485 (-10%) | 3mo | $456,000 | $307 | 50 |
| 675 Elwell Ave | 0.52mi | 2/1.0 | 1,460 (-12%) | 18mo | $325,000 | $223 | 41 |
| 1212 Cascade St | 0.48mi | 3/2.5 (+1) | 1,883 (+14%) | 11mo | $599,000 | $318 | 35 |
Match score weights: distance 35% · size 25% · config 20% · recency 20%. Top-matched comps best support the ARV.
Projected returns pro-forma
10.0% appreciation · 3.0% rent growth · sell at horizon
- IRR
- 17.3%
- Equity multiple
- 2.42×
- Total profit
- $137,990
- Equity at exit
- $313,501
- IRR
- 16.3%
- Equity multiple
- 5.59×
- Total profit
- $446,970
- Equity at exit
- $676,078
Cash invested: $97,439 (down + closing). Projections, not guarantees.
Landlord ↔ Tenant lean methodology
- Overall (STATE)
- 28 Tenant-Leaning
- State Washington
- 28 Tenant-Leaning · D+8
- County
- — inherits STATE
- City
- — inherits STATE
ZIP-level market 98241
- Home prices YoY
- 10.3%
- Active inventory
- 14
- Price-to-rent
- 14.4×
Monthly cashflow live
- Estimated rent
- $2,019 medium interval (Pro) →
- Mortgage (P&I)
- −$1,825
- Tax est. 1.5%
- −$435 /mo · $5,220/yr
- Insurance
- −$145
- HOA
- −$0
- Vacancy / Maint / Mgmt
- −$424
- Net cashflow
- $-810
Break-even live
Sensitivity live
| Price | -10% $-569 | -5% $-689 | +0% $-810 | +5% $-930 | +10% $-1,050 |
|---|---|---|---|---|---|
| Rent | -10% $-969 | -5% $-889 | +0% $-810 | +5% $-730 | +10% $-650 |
| Rate | -1.0pp $-634 | -0.5pp $-721 | base $-810 | +0.5pp $-900 | +1.0pp $-992 |
UW: 25.0% down · 7.5% · 30yr · 1.5% tax · 5.0% vac · 8.0% maint · 8.0% mgmt
Financing live
Cash to close
- Down payment
- $86,999
- Closing costs
- $10,440
- Reserves months
- —
- Total cash needed
- —
Loan-product check · same deal, 3 products live
Conventional
25% down · 7.5% · 30yr
- Down + closing
- —
- Monthly P&I
- —
- Monthly cashflow
- —
- DSCR
- —
- Eligible?
- —
Personal DTI + credit; lowest rate.
DSCR
20% down · 8.5% · 30yr
- Down + closing
- —
- Monthly P&I
- —
- Monthly cashflow
- —
- DSCR
- —
- Eligible?
- —
No personal income docs; deal must DSCR.
Hard money
10% down · 12.0% · 12mo
- Down + closing
- —
- Monthly P&I
- —
- Monthly cashflow
- —
- DSCR
- —
- Eligible?
- —
Short-term bridge; refi at stabilization.
Listing history 3 events
-
2026-05-07$347,995 Active
-
1995-07-24soldstatus $48,000
-
1991-05-01soldstatus $40,000
ⓘ Source: listings_history table (triggers on properties + properties_extension) + one-shot
backfill from property_details.listing_events for pre-trigger history.
Climate risk First Street
- Flood 1/10 Low FEMA zone X (unshaded) · 0% chance over 30 yrs
- Wildfire 3/10 Moderate
- Heat 3/10 Moderate 8 d/yr ≥87°F today · 18 d/yr by 30 yrs out
- Wind 1/10 Low
- Air quality 7/10 Severe 11 unhealthy d/yr today · 11 by 30 yrs out
Nearby sold comps map
Loading sold comps map…
Walkable amenities ~0.75 mi
Loading nearby amenities…
Taxation est. · year 1
- Rental income
- $24,232
- − Mortgage interest
- −$19,493
- − Property taxes
- −$5,220
- − Insurance
- −$1,740
- − Repairs & maintenance
- −$1,939
- − Management
- −$1,939
- − Depreciation
- −$10,123
- Taxable loss
- −$16,222
- Est. tax savings @ 24.0%
- +$3,893
- After-tax cash flow
- $-5,823/yr
For passive investors: Depreciation is non-cash, so a rental often shows a tax loss while cash-flowing — sheltering income. Rental losses are passive: they offset passive income freely, and up to $25,000/yr can offset ordinary (W-2) income if you actively participate and your MAGI is under $100k (phasing out to $0 by $150k); unused losses carry forward. On sale, claimed depreciation is recaptured at up to 25%, and gains may owe capital-gains tax (a 1031 exchange can defer both). Figures are a year-1 estimate at your 24.0% rate — not tax advice; consult a CPA.
Schools (NCES district)
- District
- Darrington School District
- NCES district ID
- 5301980
- Math proficiency
- 44% ▲ 3.00%
- Reading proficiency
- 54% ▼ -1.00%
- Median HH income
- $46,176
- Composite
- 43.63/100
- National rank
- #6417
- State rank
- #155 of 291 in WA
Livability — Darrington
- Score
- 66/100
- State rank
- #326
- US rank
- #12215
Category grades
Schools grade is shown separately in the Schools card above.
Census & demographics
- Census place
- Darrington, WA
- Population (ZIP)
- 2,412
Population outlook (Snohomish County) Hauer SSP2
- Today (2025)
- 899,800 people
- By 2030
- 960,975 · +6.8%
- By 2040
- 1,074,447 · +19.4%
- By 2050
- 1,171,954 · +30.2%
- By 2075
- 1,384,849 · +53.9%
- By 2100
- 1,497,296 · +66.4%
Race, ethnicity, and origin ACS 2023
- Neighborhood character
- Predominantly White (84%)
- Race & ethnicity
- White 84% Hispanic / Latino 6% Two or more races 6% Native American 1%
- Hispanic origin (detail)
- Mexican 4%
- Common ancestry
- Portuguese 7% Slovak 6% Italian 2%
- Foreign-born
- 3% · Canada
- Languages at home
- 95% English-only · Spanish 4% German/W. Germanic 1%
Political lean MEDSL · Snohomish
- 2024 margin
- D (+19.0) · D 57.8% · R 38.9% · Other 3.3%
- 2008→2024 swing
- +0.1pp no change · 2008: 18.9pp · 2024: 19.0pp
- All cycles
- 2024: D+19.0 2020: D+20.6 2016: D+16.6 2012: D+16.2 2008: D+18.9
Not yet ingested
- Civics
- —
Market trends
- HPI YoY
- ▲ 30.02%
- Current HPI
- 321.64
- Rent YoY
- —
- Metro
- —
- State GDP YoY
- ▲ 4.65%
- F500 in state
- 22
Industry mix (Fortune 500 HQ in WA)
| Industry | F500 HQs | Revenue |
|---|---|---|
| Retail | 2 | $269B |
|
||
| Technology / Retail | 1 | $638B |
|
||
| Technology | 1 | $245B |
|
||
| Telecommunications | 1 | $38B |
|
||
| Food / Beverage | 1 | $36B |
|
||
| Automotive / Trucks | 1 | $34B |
|
||
Price history
+770.0% since first listed4 events — show timeline
- 2026-05-23 Pending — NWMLS as Distributed by MLS Grid
- 2026-05-07 Listed $347,995 NWMLS as Distributed by MLS Grid
- 1995-07-24 Sold (Public Records) $48,000 Public Records
- 1991-05-01 Sold (Public Records) $40,000 Public Records
Property tax history
-3.0%/yrLatest (2026): $149 · -1.0% YoY. Source: county tax records.
Cash-flow waterfall
monthlySold comps — $/sqft
last 12 mo · ≤1 miLoading sold comps…