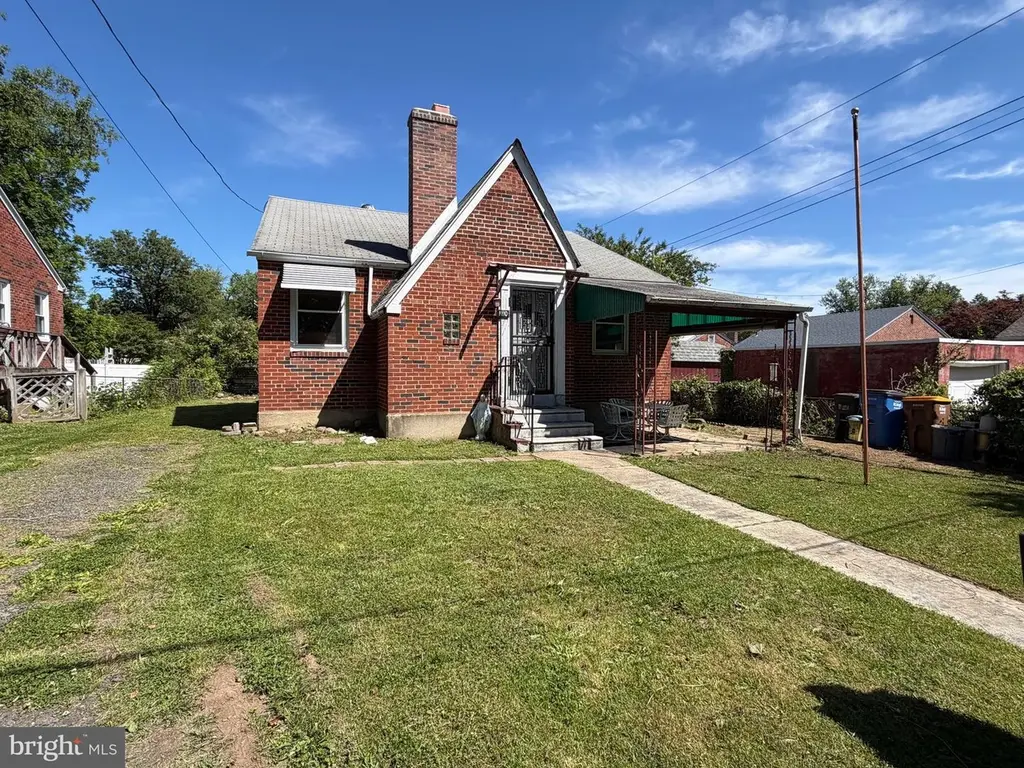
1110 Emerson Ln · Andalusia, PA
Flood risk 1/10 · Minimal
- FEMA flood zone
- X (unshaded)
- Chance of flooding over 30 yrs
- 0.0%
- Est. flood insurance / yr
- $473 – $860
Fire risk 1/10 · Minimal
- Est. fire insurance / yr
- $511 – $949
Heat risk 6/10 · Moderate
- Hot days now (above 103°F)
- 7 days/yr
- Hot days in 30 yrs
- 15 days/yr
Wind risk 6/10 · Moderate
- Chance of severe wind over 30 yrs
- 27.0%
Air-quality risk 5/10 · Moderate
- Unhealthy air days now
- 6 days/yr
- Unhealthy air days in 30 yrs
- 8 days/yr
Risk factors via First Street. Map © Google.
Why this score? — see what drove the D grade
The composite is a weighted blend of 9 inputs, each scored 0–100. Each bar is that input's sub-score; the figure is the points it added to the 100-point composite (weight × sub-score).
- ARV discount +15.0/15.0
- Cash flow +11.2/30.0
- Rent growth +4.0/5.0
- DSCR +3.3/10.0
- 1% rule +3.0/10.0
- Schools +2.5/10.0
- Livability +2.5/5.0
- Condition / age +2.5/5.0
- Appreciation +0.0/10.0
$250,000
🖨 Deal sheet 📄 Offer letter ✓ Due diligence
Listing remarks MLS
Property is being offered in an online marketing event. Buyer/Buyer"s agent must register for the online marketing event. After event concludes, it may take up to 7 calendar days for offer decision. Communication will be sent to bidders with results & next steps for the accepted offer. No interior access available on Subject Property. Do Not Disturb Occupant. It is a criminal offense to trespass on this property. Property is being sold in as-is condition. No seller disclosure available. Corporate addendums to follow accepted agreement of sale. Buyer is responsible for any and all certifications, certificate of occupancy, lender requirements and inspections. Settlement subject to receipt of sheriff's deed.
Key facts
- 5,000 sq ft lot
- Parking
- Built 1950
Property features AI
Exterior
- Parking: Driveway parking (1 space); One total garage/parking space
- Utilities: Electric service with circuit breakers; Public water service; Public sewer
- Home design: Detached property; Above-grade living area reported from assessor
- Construction: Masonry construction; Block foundation; Structure is detached
- Exterior features: Public water; Public sewer
Interior
- Bedrooms: Three bedrooms on the main level
- Flooring: Hardwood floors; Tile/brick floors
- Bathrooms: One full bathroom on the main level
- Heating & cooling: Electric baseboard heating; Circuit breaker electrical; Electric hot water
- Interior features: Dining area; Attic; Daylight full basement (unfinished)
- Laundry & utility: Laundry hookups in the basement
Neighborhood map
What this means for you Summary
Snapshot
- This is a 2-bed/1.0-bath single-family listed at $250k.
Deal economics
- At list price, monthly cash flow is $-98 ($-1k/yr) — negative.
- To cash-flow at today's rent, offer at most $233k (6.9% below list).
- To meet the 1% rule (rent ≥ 1% of price), the offer needs to be $201k (19.5% below list).
- Recommended offer: $201k (19.5% below list) — sets the bar for 1% rule.
Location & tenants
- Location reads: area grade D — affects rentability + tenant quality, not the cash-flow math above.
- Bensalem Township SD (suburban): math 21% / reading 34% proficiency, ranked #447 of 539 in PA (top 83%) — low school quality limits family demand, transient renter base, plan for 1-2y turnover.
- Zoned schools: Cornwells El Sch (math 19% / reading 33%, grade F, #1,171 of 1,518 statewide, top 77%, 553 students, 60% FRL); Robert K Shafer Ms (math 14% / reading 37%, grade F, #414 of 512 statewide, top 81%, 612 students, 62% FRL); Bensalem Twp Hs (math 61% / reading 10%, grade F, #308 of 437 statewide, top 71%, 2,120 students, 56% FRL) — zoned schools average 59% FRL vs 40% district-wide (19 pts higher); higher-poverty schools than district average — tighter screening recommended.
- Market conditions: Rents rising fast (+6.1%/yr); 147 active listings in the ZIP; 3 comparable units currently listed for rent nearby; rentals leasing fast (median 1d on market — plan ~1-2 weeks tenant-placement turnaround); solid renter incomes; 663 units permitted in Bucks County in 2024 (106 in 5+ unit buildings).
Forward outlook
- Local home prices are declining (-3.0%/yr); year-one equity from $2k of loan paydown is wiped out by about $8k of value loss. Plan a longer hold.
- Bucks County population projected to shrink 7% by 2050 — rents likely to lag national; underwrite the cash flow, not the appreciation.
Negotiation context
- Only 6 days on market — expect competitive offers; lowballing is unlikely to land.
- 5 sale attempts since 17y ago with the ask held roughly flat each time — persistent listings suggest the price (not the market) is what's stuck; bring a comps-based counter.
- Current owner paid $103k; list at $250k implies a 142% gain — meaningful room to come down on a strong offer.
Risks & watch-outs
- Watch-outs: built in 1950 — expect roof / HVAC / electrical / plumbing capex.
- Climate carrying-cost: major wind risk, 27% chance of damaging wind over 30y; extreme-heat days projected 7→15/yr by 2055 (HVAC capex compounding) — expect insurance premiums to compound above CPI over the hold.
Questions for the listing agent
- What do current leases actually rent for vs. the listed asking? Can we see a recent rent roll and the last 12 months of T-12 income?
- Built in 1950 — when were the roof, HVAC, electrical panel, plumbing, and water heater last replaced?
- Is there a deadline driving the sale (1031 exchange, divorce, estate, relocation)? That informs how much negotiation room exists.
- The area grade is low — what's the realistic commute time and amenity access for the typical tenant pool here? Any planned neighborhood developments (good or bad) we should know about?
- What's the average days-on-market for RENTAL listings here right now (not sales)? A rising rental-DOM trend means longer vacancies and softer asking-rent achievability than the comps imply.
- What's the recent tenant-quality profile in this submarket — average credit score on applications, eviction rate, late-payment / NSF rate, and stable-employment percentage? A property-management company in the area should have these aggregated.
- How much new for-sale + rental construction is in the pipeline within 1–3 miles? Heavy new supply typically softens prices + rents 12–24 months out; constrained supply supports both.
Investment metrics
- 1% rule
- 0.80% ✗
- Cap rate
- 5.82%
- Cash-on-cash
- -1.69%
- DSCR
- 0.93
- GRM
- 10.4
CMA / ARV
- ARV (on-the-fly)
- $322,812
- Comps found
- 4
Show comp detail 4 sales within ~0.75 mi
| Address | Dist | Beds/Ba | Sqft | Sold | Price | $/sf | Match |
|---|---|---|---|---|---|---|---|
| 1155 Highland Ave | 0.27mi | 3/2.0 (+1) | 1,066 (-3%) | 13mo | $360,000 | $338 | 62 |
| 1098 Whittier Ave | 0.14mi | 3/1.0 (+1) | 1,223 (+11%) | 12mo | $355,000 | $290 | 59 |
| 1122 Elwood Ave | 0.12mi | 3/1.0 (+1) | 1,236 (+13%) | 19mo | $364,000 | $294 | 53 |
| 824 Locust Ave | 0.53mi | 3/1.0 (+1) | 1,160 (+6%) | 19mo | $315,000 | $272 | 45 |
Match score weights: distance 35% · size 25% · config 20% · recency 20%. Top-matched comps best support the ARV.
Projected returns pro-forma
-3.0% appreciation · 6.14% rent growth · sell at horizon
- IRR
- -15.7%
- Equity multiple
- 0.43×
- Total profit
- $-40,208
- Equity at exit
- $37,276
- IRR
- -2.7%
- Equity multiple
- 0.80×
- Total profit
- $-14,345
- Equity at exit
- $21,615
Cash invested: $70,000 (down + closing). Projections, not guarantees.
Landlord ↔ Tenant lean methodology
- Overall (STATE)
- 62 Landlord-Friendly
- State Pennsylvania
- 62 Landlord-Friendly · EVEN
- County
- — inherits STATE
- City
- — inherits STATE
ZIP-level market 19020
- Rents YoY
- 6.1%
- Active inventory
- 147
- Price-to-rent
- 10.4×
Monthly cashflow live
- Estimated rent
- $2,012 medium interval (Pro) →
- Mortgage (P&I)
- −$1,311
- Tax from tax record
- −$273 /mo · $3,276/yr
- Insurance
- −$104
- HOA
- −$0
- Vacancy / Maint / Mgmt
- −$423
- Net cashflow
- $-98
Break-even live
UW: 25.0% down · 7.5% · 30yr · 1.5% tax · 5.0% vac · 8.0% maint · 8.0% mgmt
Financing live
Cash to close
- Down payment
- $62,500
- Closing costs
- $7,500
- Reserves months
- —
- Total cash needed
- —
Loan-product check · same deal, 3 products live
Conventional
25% down · 7.5% · 30yr
- Down + closing
- —
- Monthly P&I
- —
- Monthly cashflow
- —
- DSCR
- —
- Eligible?
- —
Personal DTI + credit; lowest rate.
DSCR
20% down · 8.5% · 30yr
- Down + closing
- —
- Monthly P&I
- —
- Monthly cashflow
- —
- DSCR
- —
- Eligible?
- —
No personal income docs; deal must DSCR.
Hard money
10% down · 12.0% · 12mo
- Down + closing
- —
- Monthly P&I
- —
- Monthly cashflow
- —
- DSCR
- —
- Eligible?
- —
Short-term bridge; refi at stabilization.
Rent comps 3 comps
| Address | Beds | Baths | Sqft | Rent | $/sqft | DOM | Units | Dist |
|---|---|---|---|---|---|---|---|---|
| 831 Cedar Ave Bensalem, PA | 1.0–2.0 | 1.0 | 647 | $1,595 | $2.46 | 1d | 5 | 0.47mi |
| 135A Federal St Bensalem, PA | 2.0 | 2.0 | 1460 | $2,800 | $1.92 | 1d | 1 | 1.37mi |
| 139 Easton St Andalusia, PA | 2.0 | 2.5 | 1416 | $2,700 | $1.91 | 1d | 1 | 1.49mi |
Listing history 5 events
-
2026-06-13statusdays on market $250,000 Pending 6 DOM
-
2026-06-09days on market $250,000 Active 4 DOM
-
2026-06-08days on market $250,000 Active 3 DOM
-
2026-06-07remarks 693-char remark
-
2026-06-07$250,000 Active 2 DOM
ⓘ Source: listings_history table (triggers on properties + properties_extension) + one-shot
backfill from property_details.listing_events for pre-trigger history.
Tax reassessment forecast PA · Partial reset (capped growth)
- Current annual tax
- $3,276 · $273/mo
- Projected year-2 tax
- $3,613 · $301/mo
- Expected delta
- +$337/yr (+$28/mo · 10.3%)
ⓘ Screening estimate from a state-policy table — verify with the county assessor before closing.
Climate risk First Street
- Flood 1/10 Low FEMA zone X (unshaded) · 0% chance over 30 yrs
- Wildfire 1/10 Low
- Heat 6/10 Major 7 d/yr ≥103°F today · 15 d/yr by 30 yrs out
- Wind 6/10 Major 27% chance of damaging wind over 30 yrs
- Air quality 5/10 Major 6 unhealthy d/yr today · 8 by 30 yrs out
Nearby sold comps map
Loading sold comps map…
Walkable amenities ~0.75 mi
Loading nearby amenities…
Taxation est. · year 1
- Rental income
- $24,150
- − Mortgage interest
- −$14,004
- − Property taxes
- −$3,276
- − Insurance
- −$1,250
- − Repairs & maintenance
- −$1,932
- − Management
- −$1,932
- − Depreciation
- −$7,273
- Taxable loss
- −$5,516
- Est. tax savings @ 24.0%
- +$1,324
- After-tax cash flow
- $144/yr
For passive investors: Depreciation is non-cash, so a rental often shows a tax loss while cash-flowing — sheltering income. Rental losses are passive: they offset passive income freely, and up to $25,000/yr can offset ordinary (W-2) income if you actively participate and your MAGI is under $100k (phasing out to $0 by $150k); unused losses carry forward. On sale, claimed depreciation is recaptured at up to 25%, and gains may owe capital-gains tax (a 1031 exchange can defer both). Figures are a year-1 estimate at your 24.0% rate — not tax advice; consult a CPA.
Schools (NCES district)
- District
- Bensalem Township SD
- NCES district ID
- 4203330
- Math proficiency
- 21% ▼ -16.00%
- Reading proficiency
- 34% ▼ -19.00%
- Median HH income
- $59,936
- Composite
- 25.03/100
- National rank
- #7554
- State rank
- #447 of 539 in PA
Livability — Andalusia
No livability data for this city. (Only ~50 U.S. cities are tracked.)
Census & demographics
- Census place
- Andalusia, PA
- County
- Bucks County · 506,477 people
- Metro
- Philadelphia-Camden-Wilmington, PA-NJ-DE-MD
- Population (ZIP)
- 56,809
- Household income
- $83,223
- Rent vs Own
- Severe rent burden
- 2323.0
Population outlook (Bucks County) Hauer SSP2
- Today (2025)
- 630,973 people
- By 2030
- 627,093 · -0.6%
- By 2040
- 609,680 · -3.4%
- By 2050
- 584,225 · -7.4%
- By 2075
- 539,840 · -14.4%
- By 2100
- 483,970 · -23.3%
Race, ethnicity, and origin ACS 2023
- Neighborhood character
- Diverse neighborhood (Simpson 0.56)
- Race & ethnicity
- White 63% Hispanic / Latino 13% Asian 13% Two or more races 8% Black 7%
- Hispanic origin (detail)
- Mexican 4% Puerto Rican 4%
- Common ancestry
- Romanian 7% Subsaharan African 2% Scotch-Irish 1%
- Foreign-born
- 20% · Canada, China, South Korea
- Languages at home
- 74% English-only · Other Indo-European 10% Spanish 9% Russian/Polish/Slavic 3%
Political lean MEDSL · Bucks
- 2024 margin
- Toss-up / Even · D 49.5% · R 49.5%
- 2008→2024 swing
- -8.7pp toward R · 2008: 8.7pp · 2024: -0.1pp
- All cycles
- 2024: R+0.1 2020: D+4.4 2016: D+0.6 2012: D+1.2 2008: D+8.7
Not yet ingested
- Civics
- —
Market trends
- HPI YoY
- ▼ -363.70%
- Current HPI
- 284.9207
- Rent YoY
- ▲ 6.14%
- Metro
- Philadelphia-Camden-Wilmington, PA-NJ-DE-MD
- State GDP YoY
- ▲ 1.68%
- F500 in state
- 34
Industry mix (Fortune 500 HQ in PA)
| Industry | F500 HQs | Revenue |
|---|---|---|
| Healthcare | 2 | $309B |
|
||
| Insurance | 2 | $27B |
|
||
| Telecommunications / Media | 1 | $124B |
|
||
| Industrial Distribution | 1 | $22B |
|
||
| Financial Services | 1 | $20B |
|
||
| Chemicals / Materials | 1 | $18B |
|
||
Price history
+13.7% since first listed15 events — show timeline
- 2026-06-06 Listed $250,000 BRIGHT MLS
- 2026-06-05 Coming Soon $250,000 BRIGHT MLS
- 2016-04-18 Sold (MLS) $103,100 BRIGHT MLS
- 2016-04-18 Sold (MLS) $103,100 TREND
- 2016-03-11 Pending — TREND
- 2016-03-04 Contingent — TREND
- 2016-03-02 Listing Removed — BRIGHT MLS
- 2015-11-23 Listed $105,600 TREND
- 2015-11-15 Listed $105,600 BRIGHT MLS
- 2009-12-09 Sold (Public Records) $219,900 Public Records
- 2009-11-30 Sold (MLS) $219,900 TREND
- 2009-11-30 Sold (MLS) $219,900 BRIGHT MLS
- 2009-10-30 Listing Removed — BRIGHT MLS
- 2009-10-21 Listed $219,900 TREND
- 2009-10-21 Listed $219,900 BRIGHT MLS
Property tax history
+1.7%/yrLatest (2026): $3,276 · +2.8% YoY. Source: county tax records.
Cash-flow waterfall
monthlySold comps — $/sqft
last 12 mo · ≤1 miLoading sold comps…