1701 Pinehurst Rd · Dunedin, FL
Flood risk 5/10 · Moderate
- FEMA flood zone
- X (unshaded)
- Chance of flooding over 30 yrs
- 0.66%
- Est. flood insurance / yr
- $507 – $1,088
Fire risk 1/10 · Minimal
- Est. fire insurance / yr
- $947 – $1,759
Heat risk 10/10 · Severe
- Hot days now (above 107°F)
- 7 days/yr
- Hot days in 30 yrs
- 27 days/yr
Wind risk 10/10 · Severe
- Chance of severe wind over 30 yrs
- 99.0%
Air-quality risk 3/10 · Minor
- Unhealthy air days now
- 2 days/yr
- Unhealthy air days in 30 yrs
- 3 days/yr
Risk factors via First Street. Map © Google.
Why this score? — see what drove the D- grade
The composite is a weighted blend of 9 inputs, each scored 0–100. Each bar is that input's sub-score; the figure is the points it added to the 100-point composite (weight × sub-score).
- ARV discount +7.5/15.0
- Cash flow +6.8/30.0
- 1% rule +6.0/10.0
- Schools +4.3/10.0
- Livability +4.3/5.0
- Rent growth +3.2/5.0
- Condition / age +2.5/5.0
- DSCR +1.0/10.0
- Appreciation +0.0/10.0
$149,900
🖨 Deal sheet (PDF) 📄 Offer letter ✓ Due diligence
Listing remarks MLS
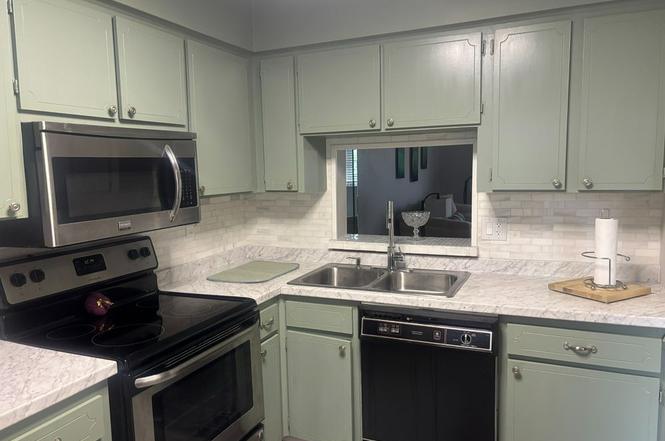
Furnished and clean! The unit has an enclosed porch to the rear with a stack washer/dryer in the closet. This development is for those over the age of 55 years and there are leasing limitations of must occupy for one year prior to leasinga unit. No dogs, a cat or bird is OK. This is a perfect unit for a winter resident/owner or retiree. Don't wait, this unit is priced to sell.
Key facts
- Clubhouse
- Sunroom
- In unit laundry
Tags
Property features AI
Exterior
- Home design: Condo
- Exterior features: Condo site with 645 sq ft lot size
Neighborhood map
What this means for you Summary
Snapshot
- This is a 1-bed/1.0-bath condo listed at $150k.
Deal economics
- At list price, monthly cash flow is $-232 ($-3k/yr) — negative.
- The deal already cash-flows at list — no discount required.
- Meets the 1% rule at list price ($2k rent vs $150k).
- Recommended offer: $132k (12.0% below list) — sets the bar for market timing.
- Cap rate 4.4% vs local median 2.8% in Dunedin — top-decile yield for the area; either an underpriced asset or a hidden risk that comps aren't pricing in. Stress-test before assuming the spread holds.
Location & tenants
- Location reads 86/100 on livability (#15 in FL, #411 nationally) — a professional / high-income tenant draw. Strengths: crime A+, commute A+, housing A+; Watch: employment C-, amenities D.
- Pinellas (suburban): math 51% / reading 51% proficiency, ranked #31 of 73 in FL (top 42%) — acceptable for families but not a draw, mixed tenant base, ~2y average lease.
- Market conditions: Rents rising (+2.7%/yr); 478 active listings in the ZIP; 15 comparable units currently listed for rent nearby; rentals at typical pace (median 25d on market — plan ~3-4 weeks tenant-placement turnaround); 2,676 units permitted in Pinellas County in 2024 (1,422 in 5+ unit buildings).
Forward outlook
- Local home prices are declining (-3.0%/yr); year-one equity from $1k of loan paydown is wiped out by about $4k of value loss. Plan a longer hold.
- Pinellas County population projected at +14% by 2050 — modest demand growth; plan on rents tracking national, not racing it.
Negotiation context
- It's been on market 206 days — a 12% lower offer ($132k) is reasonable based on typical stale-listing flexibility.
- 8 sale attempts since 20y ago with the ask held roughly flat each time — persistent listings suggest the price (not the market) is what's stuck; bring a comps-based counter.
- Current owner paid $28k; list at $150k implies a 435% gain — meaningful room to come down on a strong offer.
Risks & watch-outs
- Watch-outs: HOA is 30% of rent.
- Climate carrying-cost: moderate flood risk; severe wind risk, 99% chance of damaging wind over 30y; extreme-heat days projected 7→27/yr by 2055 (HVAC capex compounding) — expect insurance premiums to compound above CPI over the hold.
Questions for the listing agent
- What do current leases actually rent for vs. the listed asking? Can we see a recent rent roll and the last 12 months of T-12 income?
- It's been on market 206 days. Have you received any prior offers? Is the seller open to a 12% concession, seller financing, or rate buy-down credit?
- Built in 1976 — when were the roof, HVAC, electrical panel, plumbing, and water heater last replaced?
- What does the HOA fee cover, when was the last increase, and are there any pending special assessments or reserve-fund shortfalls?
- Any open or pending special assessments — roof, HVAC, plumbing, elevator, façade? What's the per-unit balance and payoff schedule, and is the seller paying it off at close or rolling it to the buyer?
- Why hasn't it sold? Are there any deal-killer items the seller is aware of (foundation, flood, title, zoning, code violations)?
- Is there a deadline driving the sale (1031 exchange, divorce, estate, relocation)? That informs how much negotiation room exists.
- Schools are A-rated — typically a magnet for longer-tenancy family renters. What's the average tenant stay here, and is there a school-zone premium baked into asking?
- The area grade is low — what's the realistic commute time and amenity access for the typical tenant pool here? Any planned neighborhood developments (good or bad) we should know about?
- What's the average days-on-market for RENTAL listings here right now (not sales)? A rising rental-DOM trend means longer vacancies and softer asking-rent achievability than the comps imply.
- What's the recent tenant-quality profile in this submarket — average credit score on applications, eviction rate, late-payment / NSF rate, and stable-employment percentage? A property-management company in the area should have these aggregated.
- How much new apartment / multifamily construction is in the pipeline within 1–3 miles? Heavy new supply (>2% of stock underway) typically softens rents 12–24 months out; light construction supports rent growth.
Investment metrics
- 1% rule
- 1.10% ✓
- Cap rate
- 4.43%
- Cash-on-cash
- -6.64%
- DSCR
- 0.70
- GRM
- 7.5
CMA / ARV
No comps found within radius.
Projected returns pro-forma
-3.0% appreciation · 2.69% rent growth · sell at horizon
- IRR
- -28.0%
- Equity multiple
- 0.06×
- Total profit
- $-39,253
- Equity at exit
- $22,351
- IRR
- -27.4%
- Equity multiple
- -0.29×
- Total profit
- $-53,955
- Equity at exit
- $12,961
Cash invested: $41,972 (down + closing). Projections, not guarantees.
Landlord ↔ Tenant lean methodology
- Overall (STATE)
- 87 Strongly Landlord-Friendly
- State Florida
- 87 Strongly Landlord-Friendly · R+3
- County
- — inherits STATE
- City
- — inherits STATE
ZIP-level market 34698
- Rents YoY
- 2.7%
- Active inventory
- 478
- Price-to-rent
- 7.5×
Monthly cashflow live
- Estimated rent
- $1,655 high interval (Pro) →
- Mortgage (P&I)
- −$786
- Tax est. 1.5%
- −$187 /mo · $2,248/yr
- Insurance
- −$62
- HOA est. from 5 same-building comps
- −$504
- Vacancy / Maint / Mgmt
- −$348
- Net cashflow
- $-232
Break-even live
Sensitivity live
| Price | -10% $-129 | -5% $-180 | +0% $-232 | +5% $-284 | +10% $-336 |
|---|---|---|---|---|---|
| Rent | -10% $-363 | -5% $-297 | +0% $-232 | +5% $-167 | +10% $-101 |
| Rate | -1.0pp $-157 | -0.5pp $-194 | base $-232 | +0.5pp $-271 | +1.0pp $-310 |
UW: 25.0% down · 7.5% · 30yr · 1.5% tax · 5.0% vac · 8.0% maint · 8.0% mgmt
Financing live
Cash to close
- Down payment
- $37,475
- Closing costs
- $4,497
- Reserves months
- —
- Total cash needed
- —
Loan-product check · same deal, 3 products live
Conventional
25% down · 7.5% · 30yr
- Down + closing
- —
- Monthly P&I
- —
- Monthly cashflow
- —
- DSCR
- —
- Eligible?
- —
Personal DTI + credit; lowest rate.
DSCR
20% down · 8.5% · 30yr
- Down + closing
- —
- Monthly P&I
- —
- Monthly cashflow
- —
- DSCR
- —
- Eligible?
- —
No personal income docs; deal must DSCR.
Hard money
10% down · 12.0% · 12mo
- Down + closing
- —
- Monthly P&I
- —
- Monthly cashflow
- —
- DSCR
- —
- Eligible?
- —
Short-term bridge; refi at stabilization.
Rent comps 15 comps
| Address | Beds | Baths | Sqft | Rent | $/sqft | DOM | Units | Dist |
|---|---|---|---|---|---|---|---|---|
| 1515 County Road 1 Dunedin, FL | 1.0–2.0 | 1.0 | 719 | $1,250 | $1.74 | 8d | 1 | 0.63mi |
| 1196 Angle Rd Dunedin, FL | 1.0 | 1.0 | 700 | $1,675 | $2.39 | 5d | 1 | 0.84mi |
| 639 Michigan Blvd Unit 1800 Dunedin, FL | 1.0 | 1.0 | 616 | $1,200 | $1.95 | 25d | 1 | 0.88mi |
| 690 Regina Rd Dunedin, FL | 2.0 | 1.0 | 745 | $2,195 | $2.95 | 5d | 1 | 0.95mi |
| 905 Patricia Ave Dunedin, FL | 1.0 | 1.0 | 550 | $1,800 | $3.27 | 25d | 1 | 1.09mi |
| 612 Bass Ct Dunedin, FL | 1.0–2.0 | 1.0 | 698 | $1,479 | $2.12 | 2d | 6 | 1.17mi |
| 1600 Pasadena Dr Unit B Dunedin, FL | 1.0 | 1.0 | 400 | $1,450 | $3.62 | 25d | 1 | 1.17mi |
| 1600 Pasadena Dr Unit A Dunedin, FL | 1.0 | 1.0 | 385 | $1,250 | $3.25 | 14d | 1 | 1.17mi |
| 1523 Bayshore Blvd Unit 3 Dunedin, FL | 1.0 | 1.0 | 640 | $2,750 | $4.30 | 25d | 1 | 1.25mi |
| 580 Skinner Blvd Unit 4 Dunedin, FL | 2.0 | 1.0 | 750 | $2,045 | $2.73 | 25d | 1 | 1.32mi |
| 602 Skinner Blvd Dunedin, FL | 1.0 | 1.5 | 448 | $2,750 | $6.14 | 25d | 1 | 1.33mi |
| 3055 Belcher Rd Dunedin, FL | 2.0 | 1.0 | 750 | $1,345 | $1.79 | 22d | 1 | 1.43mi |
| 451 Skinner Blvd Unit A Dunedin, FL | 2.0 | 1.0 | 750 | $1,500 | $2.00 | 8d | 1 | 1.47mi |
| 416 Skinner Blvd Unit B Dunedin, FL | 1.0 | 1.0 | 620 | $1,795 | $2.90 | 25d | 1 | 1.48mi |
| 3071 Park Ln Unit C Dunedin, FL | 1.0 | 1.0 | 690 | $1,195 | $1.73 | 25d | 1 | 1.49mi |
HOA detail condo
- Monthly dues
- $0 · $0/yr
- Assessments
- None detected in remarks — confirm with the listing agent.
Listing history 26 events
-
2026-06-18days on market $149,900 Active 206 DOM
-
2026-06-17days on market $149,900 Active 205 DOM
-
2026-06-16days on market $149,900 Active 204 DOM
-
2026-06-15days on market $149,900 Active 203 DOM
-
2026-06-13days on market $149,900 Active 201 DOM
-
2026-06-09days on market $149,900 Active 197 DOM
-
2026-06-08days on market $149,900 Active 196 DOM
-
2026-06-07days on market $149,900 Active 195 DOM
-
2026-06-04days on market $149,900 Active 192 DOM
-
2026-06-03days on market $149,900 Active 191 DOM
-
2026-06-01days on market $149,900 Active 189 DOM
-
2026-05-31days on market $149,900 Active 188 DOM
-
2025-11-24$149,900 Active
-
2024-03-14historical $1,550
-
2024-01-20$1,550
-
2011-07-25historical
-
2011-07-15soldstatus $28,000 380-char remark
Show marketing remark (380 chars)
Furnished and clean! The unit has an enclosed porch to the rear with a stack washer/dryer in the closet. This development is for those over the age of 55 years and there are leasing limitations of must occupy for one year prior to leasinga unit. No dogs, a cat or bird is OK. This is a perfect unit for a winter resident/owner or retiree. Don't wait, this unit is priced to sell.
-
2011-02-21$38,500
-
2010-10-14$31,500 380-char remark
Show marketing remark (380 chars)
Furnished and clean! The unit has an enclosed porch to the rear with a stack washer/dryer in the closet. This development is for those over the age of 55 years and there are leasing limitations of must occupy for one year prior to leasinga unit. No dogs, a cat or bird is OK. This is a perfect unit for a winter resident/owner or retiree. Don't wait, this unit is priced to sell.
-
2009-05-22soldstatus $43,000
-
2009-04-02$49,900
-
2007-05-01soldstatus $68,500
-
2007-04-06$73,000
-
2006-10-25historical
-
2006-07-10$99,900
-
2006-01-11$104,900
ⓘ Source: listings_history table (triggers on properties + properties_extension) + one-shot
backfill from property_details.listing_events for pre-trigger history.
Climate risk First Street
- Flood 5/10 Major FEMA zone X (unshaded) · 66% chance over 30 yrs
- Wildfire 1/10 Low
- Heat 10/10 Extreme 7 d/yr ≥107°F today · 27 d/yr by 30 yrs out
- Wind 10/10 Extreme 99% chance of damaging wind over 30 yrs
- Air quality 3/10 Moderate 2 unhealthy d/yr today · 3 by 30 yrs out
Nearby sold comps map
Loading sold comps map…
Walkable amenities ~0.75 mi
Loading nearby amenities…
Taxation est. · year 1
- Rental income
- $19,866
- − Mortgage interest
- −$8,397
- − Property taxes
- −$2,248
- − Insurance
- −$750
- − Repairs & maintenance
- −$1,589
- − Management
- −$1,589
- − HOA
- −$6,048
- − Depreciation
- −$4,361
- Taxable loss
- −$5,116
- Est. tax savings @ 24.0%
- +$1,228
- After-tax cash flow
- $-1,557/yr
For passive investors: Depreciation is non-cash, so a rental often shows a tax loss while cash-flowing — sheltering income. Rental losses are passive: they offset passive income freely, and up to $25,000/yr can offset ordinary (W-2) income if you actively participate and your MAGI is under $100k (phasing out to $0 by $150k); unused losses carry forward. On sale, claimed depreciation is recaptured at up to 25%, and gains may owe capital-gains tax (a 1031 exchange can defer both). Figures are a year-1 estimate at your 24.0% rate — not tax advice; consult a CPA.
Schools (NCES district)
- District
- Pinellas
- NCES district ID
- 1201560
- Math proficiency
- 51% ▼ -5.00%
- Reading proficiency
- 51% ▼ -3.00%
- Median HH income
- $46,270
- Composite
- 43.27/100
- National rank
- #3046
- State rank
- #31 of 73 in FL
Livability — Dunedin
- Score
- 86/100
- State rank
- #15
- US rank
- #411
Category grades
Schools grade is shown separately in the Schools card above.
Census & demographics
- Census place
- Dunedin, FL
- County
- Pinellas County · 939,478 people
- City population
- 38,171
- Metro
- Tampa-St. Petersburg-Clearwater, FL
- Population (ZIP)
- 38,171
- Household income
- $74,078
- Rent vs Own
- Severe rent burden
- 1390.0
Population outlook (Pinellas County) Hauer SSP2
- Today (2025)
- 1,027,532 people
- By 2030
- 1,063,586 · +3.5%
- By 2040
- 1,125,020 · +9.5%
- By 2050
- 1,168,637 · +13.7%
- By 2075
- 1,265,188 · +23.1%
- By 2100
- 1,260,357 · +22.7%
Race, ethnicity, and origin ACS 2023
- Neighborhood character
- Predominantly White (83%)
- Race & ethnicity
- White 83% Two or more races 7% Hispanic / Latino 6% Black 5% Asian 1%
- Hispanic origin (detail)
- Mexican 2% Puerto Rican 2%
- Common ancestry
- Lithuanian 4% Slovak 3% Romanian 3%
- Foreign-born
- 8% · Canada, South Korea
- Languages at home
- 92% English-only · Spanish 3% Other Indo-European 2% Russian/Polish/Slavic 1%
Political lean MEDSL · Pinellas
- 2024 margin
- Lean R (+5.2) · D 46.9% · R 52.1%
- 2008→2024 swing
- -13.5pp toward R · 2008: 8.3pp · 2024: -5.2pp
- All cycles
- 2024: R+5.2 2020: D+0.2 2016: R+1.1 2012: D+5.6 2008: D+8.3
Not yet ingested
- Civics
- —
Market trends
- HPI YoY
- ▼ -515.66%
- Current HPI
- 387.4694
- Rent YoY
- ▲ 2.69%
- Metro
- Tampa-St. Petersburg-Clearwater, FL
- State GDP YoY
- ▲ 3.28%
- F500 in state
- 36
Industry mix (Fortune 500 HQ in FL)
| Industry | F500 HQs | Revenue |
|---|---|---|
| Industrial Technology | 2 | $29B |
|
||
| Insurance | 2 | $17B |
|
||
| Retail | 1 | $60B |
|
||
| Technology Distribution | 1 | $58B |
|
||
| Homebuilding | 1 | $35B |
|
||
| Technology Manufacturing | 1 | $35B |
|
||
Price history
+42.9% since first listed14 events — show timeline
- 2025-11-24 Listed $149,900 ForSaleByOwner.com
- 2024-03-14 Rental Removed $1,550 APPFOLIO
- 2024-01-20 Listed for Rent $1,550 APPFOLIO
- 2011-07-25 Listing Removed — Stellar MLS as Distributed by MLS Grid
- 2011-07-15 Sold (MLS) $28,000 Stellar MLS as Distributed by MLS Grid
- 2011-02-21 Listed $38,500 Stellar MLS as Distributed by MLS Grid
- 2010-10-14 Listed $31,500 Stellar MLS as Distributed by MLS Grid
- 2009-05-22 Sold (MLS) $43,000 Stellar MLS as Distributed by MLS Grid
- 2009-04-02 Listed $49,900 Stellar MLS as Distributed by MLS Grid
- 2007-05-01 Sold (MLS) $68,500 Stellar MLS as Distributed by MLS Grid
- 2007-04-06 Listed $73,000 Stellar MLS as Distributed by MLS Grid
- 2006-10-25 Listing Removed — Stellar MLS as Distributed by MLS Grid
- 2006-07-10 Listed $99,900 Stellar MLS as Distributed by MLS Grid
- 2006-01-11 Listed $104,900 Stellar MLS as Distributed by MLS Grid
Cash-flow waterfall
monthlySold comps — $/sqft
last 12 mo · ≤1 miLoading sold comps…