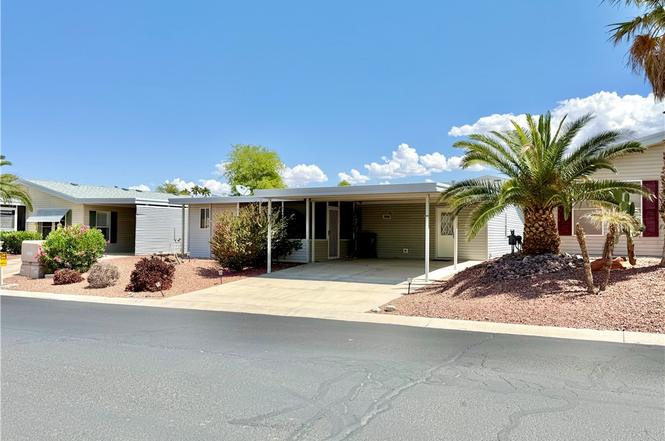
2350 Adobe Road #68 Rd · Bullhead City, AZ
Flood risk 1/10 · Minimal
- FEMA flood zone
- X (unshaded)
- Chance of flooding over 30 yrs
- 0.0%
- Est. flood insurance / yr
- $507 – $1,088
Fire risk 4/10 · Minor
- Est. fire insurance / yr
- $610 – $1,132
Heat risk 9/10 · Severe
- Hot days now (above 114°F)
- 6 days/yr
- Hot days in 30 yrs
- 13 days/yr
Wind risk 1/10 · Minimal
- Chance of severe wind over 30 yrs
- —
Air-quality risk 1/10 · Minimal
- Unhealthy air days now
- 0 days/yr
- Unhealthy air days in 30 yrs
- 0 days/yr
Risk factors via First Street. Map © Google.
Why this score? — see what drove the B grade
The composite is a weighted blend of 9 inputs, each scored 0–100. Each bar is that input's sub-score; the figure is the points it added to the 100-point composite (weight × sub-score).
- Cash flow +30.0/30.0
- ARV discount +14.0/15.0
- DSCR +10.0/10.0
- 1% rule +9.7/10.0
- Livability +3.2/5.0
- Condition / age +2.5/5.0
- Rent growth +2.3/5.0
- Schools +1.6/10.0
- Appreciation +0.0/10.0
$94,000
🖨 Deal sheet (PDF) 📄 Offer letter ✓ Due diligence
Listing remarks MLS
Very well maintained home in all adult community, land lease, Resort atmosphere with two pools, spa, fitness center, planned activities and clubhouse all with common area beautiful landscaping. House features dining area and breakfast bar with split bedrooms.
Key facts
- Primary suite
- Walk in closet
- Walk in shower
Tags
Property features AI
Finance
- Financial info: Land is leased
- HOA & community: Community pool; Clubhouse; Fitness center; Senior community
Exterior
- Parking: Carport (2 spaces)
- Security: Gated community
- Utilities: Public water; Public sewer
- Home design: Manufactured double-wide home; Residential property; Single-story (manufactured home style)
- Construction: Shingle roof; Accessible full bath noted
- Exterior features: Covered, enclosed patio; Patio; Shed(s); Water-smart landscaping; Pets allowed
Interior
- Kitchen: Gas oven; Gas range; Microwave; Dishwasher; Garbage disposal; Refrigerator; Water softener
- Flooring: Carpet
- Bathrooms: 2 full bathrooms; Accessible full bath
- Heating & cooling: Central air; Electric cooling; Ceiling fans
- Interior features: Breakfast bar; Ceiling fans; Laminate counters; Open floor plan; Walk-in closet(s); Window coverings; Furnished
- Laundry & utility: Washer and dryer included; Gas dryer hookup; Inside laundry
Neighborhood map
What this means for you Summary
Snapshot
- This is a 2-bed/2.0-bath manufactured listed at $94k.
Deal economics
- At list price, monthly cash flow is $442 ($5k/yr) — positive.
- The deal already cash-flows at list — no discount required.
- Meets the 1% rule at list price ($1k rent vs $94k).
- Recommended offer: $83k (12.0% below list) — sets the bar for market timing.
- Cap rate 11.9% vs local median 3.7% in Bullhead City — top-decile yield for the area; either an underpriced asset or a hidden risk that comps aren't pricing in. Stress-test before assuming the spread holds.
Location & tenants
- Location reads 64/100 on livability (#103 in AZ) — a middle-class / working-renter tenant base. Strengths: cost of living A+, housing A+; Watch: health & safety C-, employment D, schools F.
- Bullhead City School District (4378) (town): math 16% / reading 22% proficiency, ranked #189 of 249 in AZ (top 76%) — low school quality limits family demand, transient renter base, plan for 1-2y turnover; 68% free/reduced lunch — lower-income household profile, screen leases tightly.
- Market conditions: Rents soft (-0.9%/yr); 710 active listings in the ZIP; 1 comparable units currently listed for rent nearby; 2,543 units permitted in Mohave County in 2024 (33 in 5+ unit buildings).
- This rent runs 34% of the median local income ($48k/yr) — at the standard rent-burdened threshold; future hikes will face affordability resistance.
Forward outlook
- Local home prices are declining (-3.0%/yr); year-one equity from $650 of loan paydown is wiped out by about $3k of value loss. Plan a longer hold.
- Mohave County population projected to shrink 6% by 2050 — rents likely to lag national; underwrite the cash flow, not the appreciation.
- At projected returns (-3.0% appreciation + 0.0% rent growth), your $26k cash investment doubles in ~8 years — after that, you're playing with house money.
Negotiation context
- It's been on market 176 days — a 12% lower offer ($83k) is reasonable based on typical stale-listing flexibility.
- 2 sale attempts since 12y ago; this cycle's ask has dropped $21k (18%) from the opening price — seller is motivated, your offer sets the floor, not the list.
- Current owner paid $43k; list at $94k implies a 119% gain — meaningful room to come down on a strong offer.
Risks & watch-outs
- Climate carrying-cost: extreme-heat days projected 6→13/yr by 2055 (HVAC capex compounding) — expect insurance premiums to compound above CPI over the hold.
Questions for the listing agent
- It's been on market 176 days. Have you received any prior offers? Is the seller open to a 12% concession, seller financing, or rate buy-down credit?
- Why hasn't it sold? Are there any deal-killer items the seller is aware of (foundation, flood, title, zoning, code violations)?
- Is there a deadline driving the sale (1031 exchange, divorce, estate, relocation)? That informs how much negotiation room exists.
- Schools are F-rated, which usually means shorter tenancies and higher turnover. Who's the typical renter profile here, and what's been the actual vacancy rate?
- Crime grade is D in this area — have there been break-ins, vandalism, or insurance claims at this property in the last 3 years? What carrier currently insures it and at what premium?
- What's the average days-on-market for RENTAL listings here right now (not sales)? A rising rental-DOM trend means longer vacancies and softer asking-rent achievability than the comps imply.
- What's the recent tenant-quality profile in this submarket — average credit score on applications, eviction rate, late-payment / NSF rate, and stable-employment percentage? A property-management company in the area should have these aggregated.
- How much new for-sale + rental construction is in the pipeline within 1–3 miles? Heavy new supply typically softens prices + rents 12–24 months out; constrained supply supports both.
Investment metrics
- 1% rule
- 1.47% ✓
- Cap rate
- 11.93%
- Cash-on-cash
- 20.14%
- DSCR
- 1.90
- GRM
- 5.7
CMA / ARV
- ARV (on-the-fly)
- $109,824
- Comps found
- 12
Show comp detail 12 sales within ~0.75 mi
| Address | Dist | Beds/Ba | Sqft | Sold | Price | $/sf | Match |
|---|---|---|---|---|---|---|---|
| 2350 Adobe Rd #97 | 0.00mi | 2/2.0 | 1,056 (0%) | 3mo | $110,000 | $104 | 97 |
| 2350 Adobe Road #87 Rd | 0.17mi | 2/2.0 | 1,056 (0%) | 0mo | $110,000 | $104 | 92 |
| 2350 Adobe Rd #84 | 0.00mi | 2/2.0 | 1,056 (0%) | 14mo | $157,000 | $149 | 89 |
| 2350 Adobe Rd Unit 133-2 | 0.00mi | 2/2.0 | 1,056 (0%) | 19mo | $150,000 | $142 | 84 |
| 2350 Adobe Rd Lot 2 | 0.11mi | 2/2.0 | 1,119 (+6%) | 1mo | $85,000 | $76 | 84 |
| 2350 Adobe Rd #158 | 0.00mi | 2/2.0 | 1,056 (0%) | 20mo | $160,000 | $152 | 83 |
| 2350 Adobe Rd #17 | 0.00mi | 2/2.0 | 1,200 (+14%) | 4mo | $97,000 | $81 | 74 |
| 2350 Adobe Rd #3 | 0.00mi | 2/2.0 | 1,100 (+4%) | 23mo | $125,000 | $114 | 74 |
| 2350 Adobe Rd #8 | 0.00mi | 2/2.0 | 1,197 (+13%) | 6mo | $80,000 | $67 | 73 |
| 2350 Adobe Rd #268 | 0.11mi | 2/2.0 | 1,170 (+11%) | 11mo | $122,500 | $105 | 68 |
| 2350 Adobe Rd #102 | 0.00mi | 2/2.0 | 1,202 (+14%) | 11mo | $120,000 | $100 | 68 |
| 2350 Adobe Rd #39 | 0.00mi | 2/2.0 | 1,200 (+14%) | 21mo | $110,000 | $92 | 60 |
Match score weights: distance 35% · size 25% · config 20% · recency 20%. Top-matched comps best support the ARV.
Projected returns pro-forma
-3.0% appreciation · 0.0% rent growth · sell at horizon
- IRR
- 8.9%
- Equity multiple
- 1.34×
- Total profit
- $8,874
- Equity at exit
- $14,016
- IRR
- 15.4%
- Equity multiple
- 2.08×
- Total profit
- $28,392
- Equity at exit
- $8,127
Cash invested: $26,320 (down + closing). Projections, not guarantees.
Landlord ↔ Tenant lean methodology
- Overall (STATE)
- 87 Strongly Landlord-Friendly
- State Arizona
- 87 Strongly Landlord-Friendly · R+3
- County
- — inherits STATE
- City
- — inherits STATE
ZIP-level market 86442
- Home prices YoY
- -27.0%
- Rents YoY
- -0.9%
- Active inventory
- 710
- Price-to-rent
- 5.7×
Monthly cashflow live
- Estimated rent
- $1,381 medium interval (Pro) →
- Mortgage (P&I)
- −$493
- Tax est. 1.5%
- −$118 /mo · $1,410/yr
- Insurance
- −$39
- HOA
- −$0
- Vacancy / Maint / Mgmt
- −$290
- Net cashflow
- $442
Break-even live
Sensitivity live
| Price | -10% $507 | -5% $474 | +0% $442 | +5% $409 | +10% $377 |
|---|---|---|---|---|---|
| Rent | -10% $333 | -5% $387 | +0% $442 | +5% $496 | +10% $551 |
| Rate | -1.0pp $489 | -0.5pp $466 | base $442 | +0.5pp $417 | +1.0pp $393 |
UW: 25.0% down · 7.5% · 30yr · 1.5% tax · 5.0% vac · 8.0% maint · 8.0% mgmt
Financing live
Cash to close
- Down payment
- $23,500
- Closing costs
- $2,820
- Reserves months
- —
- Total cash needed
- —
Loan-product check · same deal, 3 products live
Conventional
25% down · 7.5% · 30yr
- Down + closing
- —
- Monthly P&I
- —
- Monthly cashflow
- —
- DSCR
- —
- Eligible?
- —
Personal DTI + credit; lowest rate.
DSCR
20% down · 8.5% · 30yr
- Down + closing
- —
- Monthly P&I
- —
- Monthly cashflow
- —
- DSCR
- —
- Eligible?
- —
No personal income docs; deal must DSCR.
Hard money
10% down · 12.0% · 12mo
- Down + closing
- —
- Monthly P&I
- —
- Monthly cashflow
- —
- DSCR
- —
- Eligible?
- —
Short-term bridge; refi at stabilization.
Rent comps 1 comps
| Address | Beds | Baths | Sqft | Rent | $/sqft | DOM | Units | Dist |
|---|---|---|---|---|---|---|---|---|
| 2350 Adobe Rd Unit 29 Bullhead City, AZ | 2.0 | 2.0 | 1097 | $1,350 | $1.23 | 14d | 1 | 0.27mi |
Listing history 22 events
-
2026-06-18days on market $94,000 Active 176 DOM
-
2026-06-17days on market $94,000 Active 175 DOM
-
2026-06-16days on market $94,000 Active 174 DOM
-
2026-06-15days on market $94,000 Active 173 DOM
-
2026-06-14days on market $94,000 Active 171 DOM
-
2026-06-13days on market $94,000 Active 170 DOM
-
2026-06-10days on market $94,000 Active 168 DOM
-
2026-06-09days on market $94,000 Active 167 DOM
-
2026-06-08days on market $94,000 Active 166 DOM
-
2026-06-07days on market $94,000 Active 165 DOM
-
2026-06-05days on market $94,000 Active 162 DOM
-
2026-06-02days on market $94,000 Active 160 DOM
-
2026-06-01days on market $94,000 Active 159 DOM
-
2026-05-31days on market $94,000 Active 158 DOM
-
2026-05-30days on market $94,000 Active 157 DOM
-
2026-05-15price $94,000
-
2026-04-14price $95,900
-
2026-04-02price $97,900
-
2026-02-23price $99,900
-
2025-12-23$115,000 Active
-
2015-03-03soldstatus $43,000 259-char remark
Show marketing remark (259 chars)
Very well maintained home in all adult community, land lease, Resort atmosphere with two pools, spa, fitness center, planned activities and clubhouse all with common area beautiful landscaping. House features dining area and breakfast bar with split bedrooms.
-
2014-10-10$52,900 259-char remark
Show marketing remark (259 chars)
Very well maintained home in all adult community, land lease, Resort atmosphere with two pools, spa, fitness center, planned activities and clubhouse all with common area beautiful landscaping. House features dining area and breakfast bar with split bedrooms.
ⓘ Source: listings_history table (triggers on properties + properties_extension) + one-shot
backfill from property_details.listing_events for pre-trigger history.
Climate risk First Street
- Flood 1/10 Low FEMA zone X (unshaded) · 0% chance over 30 yrs
- Wildfire 4/10 Moderate
- Heat 9/10 Extreme 6 d/yr ≥114°F today · 13 d/yr by 30 yrs out
- Wind 1/10 Low
- Air quality 1/10 Low 0 unhealthy d/yr today · 0 by 30 yrs out
Nearby sold comps map
Loading sold comps map…
Walkable amenities ~0.75 mi
Loading nearby amenities…
Taxation est. · year 1
- Rental income
- $16,577
- − Mortgage interest
- −$5,265
- − Property taxes
- −$1,410
- − Insurance
- −$470
- − Repairs & maintenance
- −$1,326
- − Management
- −$1,326
- − Depreciation
- −$2,735
- Taxable income
- $4,045
- Est. tax owed @ 24.0%
- −$971
- After-tax cash flow
- $4,330/yr
For passive investors: Depreciation is non-cash, so a rental often shows a tax loss while cash-flowing — sheltering income. Rental losses are passive: they offset passive income freely, and up to $25,000/yr can offset ordinary (W-2) income if you actively participate and your MAGI is under $100k (phasing out to $0 by $150k); unused losses carry forward. On sale, claimed depreciation is recaptured at up to 25%, and gains may owe capital-gains tax (a 1031 exchange can defer both). Figures are a year-1 estimate at your 24.0% rate — not tax advice; consult a CPA.
Schools (NCES district)
- District
- Bullhead City School District (4378)
- NCES district ID
- 0401500
- Math proficiency
- 16% ▼ -11.00%
- Reading proficiency
- 22% ▼ -6.00%
- Median HH income
- $37,109
- Composite
- 15.83/100
- National rank
- #9263
- State rank
- #189 of 249 in AZ
Livability — Bullhead City
- Score
- 64/100
- State rank
- #103
- US rank
- #14458
Category grades
Schools grade is shown separately in the Schools card above.
Census & demographics
- Census place
- Bullhead City, AZ
- County
- Mohave County · 181,906 people
- City population
- 43,354
- Metro
- Lake Havasu City-Kingman, AZ
- Population (ZIP)
- 34,735
- Household income
- $48,081
- Rent vs Own
- Severe rent burden
- 1040.0
Population outlook (Mohave County) Hauer SSP2
- Today (2025)
- 209,184 people
- By 2030
- 209,674 · +0.2%
- By 2040
- 205,897 · -1.6%
- By 2050
- 196,810 · -5.9%
- By 2075
- 169,454 · -19.0%
- By 2100
- 136,630 · -34.7%
Race, ethnicity, and origin ACS 2023
- Neighborhood character
- Predominantly White (68%)
- Race & ethnicity
- White 68% Hispanic / Latino 22% Two or more races 12% Black 2% Asian 2%
- Hispanic origin (detail)
- Mexican 19%
- Common ancestry
- Portuguese 3% Romanian 2% Lithuanian 2%
- Foreign-born
- 9% · Canada, South Korea
- Languages at home
- 87% English-only · Spanish 11%
Political lean MEDSL · Mohave
- 2024 margin
- Solid R (+55.8) · D 21.8% · R 77.6%
- 2008→2024 swing
- -22.9pp toward R · 2008: -32.9pp · 2024: -55.8pp
- All cycles
- 2024: R+55.8 2020: R+51.3 2016: R+51.5 2012: R+42.6 2008: R+32.9
Not yet ingested
- Civics
- —
Market trends
- HPI YoY
- ▼ -100.11%
- Current HPI
- 270.3297
- Rent YoY
- ▼ -0.90%
- Metro
- Lake Havasu City-Kingman, AZ
- State GDP YoY
- ▲ 4.54%
- F500 in state
- 20
Industry mix (Fortune 500 HQ in AZ)
| Industry | F500 HQs | Revenue |
|---|---|---|
| Technology | 2 | $13B |
|
||
| Mining / Metals | 1 | $23B |
|
||
| Environmental Services | 1 | $16B |
|
||
| Metals / Steel | 1 | $14B |
|
||
| Technology Distribution | 1 | $9B |
|
||
| Homebuilding | 1 | $8B |
|
||
Price history
+77.7% since first listed7 events — show timeline
- 2026-05-15 Price Changed $94,000 WARDEX
- 2026-04-14 Price Changed $95,900 WARDEX
- 2026-04-02 Price Changed $97,900 WARDEX
- 2026-02-23 Price Changed $99,900 WARDEX
- 2025-12-23 Listed $115,000 WARDEX
- 2015-03-03 Sold (MLS) $43,000 WARDEX
- 2014-10-10 Listed $52,900 WARDEX
Cash-flow waterfall
monthlySold comps — $/sqft
last 12 mo · ≤1 miLoading sold comps…