 🔨 Auction
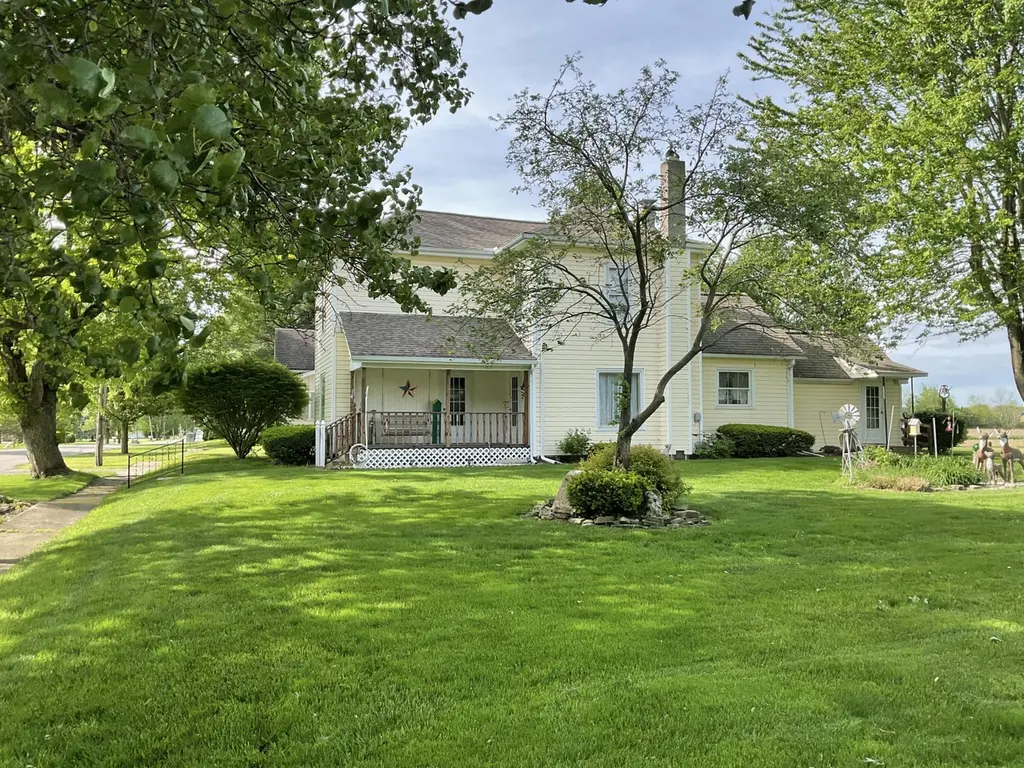
360 S Main St · West Mansfield, OH
Flood risk 1/10 · Minimal
- FEMA flood zone
- X (unshaded)
- Chance of flooding over 30 yrs
- 0.0%
- Est. flood insurance / yr
- $473 – $860
Fire risk 1/10 · Minimal
- Est. fire insurance / yr
- $713 – $1,323
Heat risk 3/10 · Minor
- Hot days now (above 100°F)
- 7 days/yr
- Hot days in 30 yrs
- 18 days/yr
Wind risk 2/10 · Minimal
- Chance of severe wind over 30 yrs
- —
Air-quality risk 2/10 · Minimal
- Unhealthy air days now
- 1 days/yr
- Unhealthy air days in 30 yrs
- 2 days/yr
Risk factors via First Street. Map © Google.
Why this score? — see what drove the F grade
The composite is a weighted blend of 9 inputs, each scored 0–100. Each bar is that input's sub-score; the figure is the points it added to the 100-point composite (weight × sub-score).
- ARV discount +7.5/15.0
- Cash flow +6.3/30.0
- Schools +5.6/10.0
- Livability +3.1/5.0
- Rent growth +2.5/5.0
- Condition / age +2.5/5.0
- 1% rule +1.5/10.0
- DSCR +0.6/10.0
- Appreciation +0.0/10.0
$100
🖨 Deal sheet (PDF) 📄 Offer letter ✓ Due diligence
Listing remarks
Outstanding Opportunity - Investment or Family Home! Offering two parcels in a desirable location with multiple possibilities. These properties will be offered using the Multi-Parcel Auction Method--bid on each tract individually and in combination, selling whichever way brings the highest return. Open House Thursday May 14th, and Thursday May 28th , 4:30-6:30 pm Tract 1 - Building Lot with Finished Garage (Parcel 07-083-08-08-018-000) 66' x 166' lot 28' x 28' garage - fully finished interior Propane furnace Two overhead doors (10'x8' and 8'x8') Separate 100-amp electric service Water currently supplied from Tract 2 (buyer responsible for separate s
Key facts
- 7,840 sq ft lot
- 2 garage spots
- Built 1920
Property features AI
Exterior
- Parking: 2-car garage
- Utilities: Public sewer; Supplied water
- Home design: Single-family residence; Residential property built in 1920
- Construction: Vinyl siding; Cellar foundation
- Exterior features: Residential lot; Lot dimensions approximately 58 x 150
Interior
- Kitchen: Kitchen (12 x 12)
- Bedrooms: Bedroom (12 x 12)
- Flooring: Carpet; Hardwood
- Bathrooms: 1 full bathroom
- Heating & cooling: Hot water heating
- Interior features: Wood-burning stove fireplace; Partial basement; 2 total rooms
Neighborhood map
What this means for you Summary
Snapshot
- This is a 4-bed/1.0-bath single-family listed at $100.
Deal economics
- At list price, monthly cash flow is $-381 ($-5k/yr) — negative.
- The deal already cash-flows at list — no discount required.
- Meets the 1% rule at list price ($1k rent vs $100).
- Recommended offer: $97 (3.0% below list) — sets the bar for market timing.
Location & tenants
- Location reads 62/100 on livability (#866 in OH) — a middle-class / working-renter tenant base. Strengths: cost of living A+, housing A+; Watch: amenities F, commute F, health & safety F.
- Benjamin Logan Local (rural): math 64% / reading 66% proficiency, ranked #197 of 656 in OH (top 30%) — acceptable for families but not a draw, mixed tenant base, ~2y average lease.
- Zoned schools: Benjamin Logan Elementary School (math 64% / reading 69%, grade B+, #500 of 1,584 statewide, top 32%, 644 students, 28% FRL); Benjamin Logan Middle School (math 68% / reading 63%, grade A-, #186 of 654 statewide, top 29%, 503 students, 22% FRL); Benjamin Logan High School (math 47% / reading 72%, grade C+, #243 of 781 statewide, top 33%, 518 students, 18% FRL) — zoned schools at 23% FRL track the district average.
- Market conditions: 7 active listings in the ZIP; solid renter incomes; 121 units permitted in Logan County in 2024 (0 in 5+ unit buildings).
Forward outlook
- Local home prices are declining (-3.0%/yr); year-one equity from $1k of loan paydown is wiped out by about $6k of value loss. Plan a longer hold.
- Logan County population projected at -15% by 2050 — secular population decline; favor cash flow + early exit over multi-decade hold.
Negotiation context
- It's been on market 43 days — a 3% lower offer ($97) is reasonable based on typical stale-listing flexibility.
Risks & watch-outs
- Watch-outs: property tax is 3225.7% of price; built in 1920 — expect roof / HVAC / electrical / plumbing capex.
Questions for the listing agent
- What do current leases actually rent for vs. the listed asking? Can we see a recent rent roll and the last 12 months of T-12 income?
- It's been on market 43 days. Have you received any prior offers? Is the seller open to a 3% concession, seller financing, or rate buy-down credit?
- Built in 1920 — when were the roof, HVAC, electrical panel, plumbing, and water heater last replaced?
- Property tax is high relative to price — has the assessment been appealed recently, and will the sale trigger a re-assessment?
- Is there a deadline driving the sale (1031 exchange, divorce, estate, relocation)? That informs how much negotiation room exists.
- Schools are F-rated, which usually means shorter tenancies and higher turnover. Who's the typical renter profile here, and what's been the actual vacancy rate?
- The area grade is low — what's the realistic commute time and amenity access for the typical tenant pool here? Any planned neighborhood developments (good or bad) we should know about?
- What's the average days-on-market for RENTAL listings here right now (not sales)? A rising rental-DOM trend means longer vacancies and softer asking-rent achievability than the comps imply.
- What's the recent tenant-quality profile in this submarket — average credit score on applications, eviction rate, late-payment / NSF rate, and stable-employment percentage? A property-management company in the area should have these aggregated.
- How much new for-sale + rental construction is in the pipeline within 1–3 miles? Heavy new supply typically softens prices + rents 12–24 months out; constrained supply supports both.
Investment metrics
- 1% rule
- 0.65% ✗
- Cap rate
- 4.16%
- Cash-on-cash
- -7.60%
- DSCR
- 0.66
- GRM
- 12.8
CMA / ARV
- ARV (median comp)
- $215,050
- List price
- $100
- Delta
- -99.95%
- Verdict
- UNDERPRICED
- Comps
- 20 within 1.0 mi
Show comp detail 8 sales within ~0.75 mi
| Address | Dist | Beds/Ba | Sqft | Sold | Price | $/sf | Match |
|---|---|---|---|---|---|---|---|
| 262 S Main St | 0.10mi | 4/1.0 | 1,756 (-3%) | 2mo | $236,000 | $134 | 89 |
| 431 W Center St | 0.37mi | 4/2.0 | 1,875 (+4%) | 1mo | $189,900 | $101 | 71 |
| 130 Vance St | 0.25mi | 4/2.0 | 1,812 (+0%) | 19mo | $228,000 | $126 | 68 |
| 247 W State St | 0.20mi | 3/1.0 (-1) | 1,646 (-9%) | 10mo | $197,500 | $120 | 63 |
| 184 E Mann St | 0.39mi | 3/2.0 (-1) | 1,782 (-1%) | 10mo | $349,900 | $196 | 62 |
| 289 E E Center St. St | 0.33mi | 4/2.0 | 1,552 (-14%) | 5mo | $252,000 | $162 | 53 |
| 162 E Center St | 0.26mi | 3/1.5 (-1) | 1,648 (-9%) | 16mo | $185,000 | $112 | 53 |
| 243 E Center St | 0.31mi | 3/2.0 (-1) | 2,026 (+12%) | 24mo | $230,000 | $114 | 36 |
Match score weights: distance 35% · size 25% · config 20% · recency 20%. Top-matched comps best support the ARV.
Projected returns pro-forma
-3.0% appreciation · 3.0% rent growth · sell at horizon
- IRR
- -29.6%
- Equity multiple
- 0.02×
- Total profit
- $-59,120
- Equity at exit
- $32,065
- IRR
- -30.3%
- Equity multiple
- -0.37×
- Total profit
- $-82,678
- Equity at exit
- $18,594
Cash invested: $60,214 (down + closing). Projections, not guarantees.
Landlord ↔ Tenant lean methodology
- Overall (STATE)
- 73 Landlord-Friendly
- State Ohio
- 73 Landlord-Friendly · R+6
- County
- — inherits STATE
- City
- — inherits STATE
ZIP-level market 43358
- Home prices YoY
- -20.2%
- Active inventory
- 7
Monthly cashflow live
- Estimated rent
- $1,398 medium interval (Pro) →
- Mortgage (P&I)
- −$1,128
- Tax est. 1.5%
- −$269 /mo · $3,226/yr
- Insurance
- −$90
- HOA
- −$0
- Vacancy / Maint / Mgmt
- −$294
- Net cashflow
- $-381
Break-even live
Sensitivity live
| Price | -10% $-233 | -5% $-307 | +0% $-381 | +5% $-456 | +10% $-530 |
|---|---|---|---|---|---|
| Rent | -10% $-492 | -5% $-437 | +0% $-381 | +5% $-326 | +10% $-271 |
| Rate | -1.0pp $-273 | -0.5pp $-327 | base $-381 | +0.5pp $-437 | +1.0pp $-494 |
UW: 25.0% down · 7.5% · 30yr · 1.5% tax · 5.0% vac · 8.0% maint · 8.0% mgmt
Financing live
Cash to close
- Down payment
- $53,762
- Closing costs
- $6,451
- Reserves months
- —
- Total cash needed
- —
Loan-product check · same deal, 3 products live
Conventional
25% down · 7.5% · 30yr
- Down + closing
- —
- Monthly P&I
- —
- Monthly cashflow
- —
- DSCR
- —
- Eligible?
- —
Personal DTI + credit; lowest rate.
DSCR
20% down · 8.5% · 30yr
- Down + closing
- —
- Monthly P&I
- —
- Monthly cashflow
- —
- DSCR
- —
- Eligible?
- —
No personal income docs; deal must DSCR.
Hard money
10% down · 12.0% · 12mo
- Down + closing
- —
- Monthly P&I
- —
- Monthly cashflow
- —
- DSCR
- —
- Eligible?
- —
Short-term bridge; refi at stabilization.
Listing history 16 events
-
2026-06-21statusdays on market $100 Pending 43 DOM
-
2026-06-18days on market $100 Active 42 DOM
-
2026-06-17days on market $100 Active 41 DOM
-
2026-06-16days on market $100 Active 40 DOM
-
2026-06-15days on market $100 Active 39 DOM
-
2026-06-13days on market $100 Active 37 DOM
-
2026-06-13days on market $100 Active 36 DOM
-
2026-06-09days on market $100 Active 33 DOM
-
2026-06-08days on market $100 Active 32 DOM
-
2026-06-07days on market $100 Active 31 DOM
-
2026-06-05days on market $100 Active 28 DOM
-
2026-06-03days on market $100 Active 27 DOM
-
2026-06-02days on market $100 Active 26 DOM
-
2026-06-01days on market $100 Active 25 DOM
-
2026-05-31days on market $100 Active 24 DOM
-
2026-05-05$100 Active 1783-char remark
ⓘ Source: listings_history table (triggers on properties + properties_extension) + one-shot
backfill from property_details.listing_events for pre-trigger history.
Climate risk First Street
- Flood 1/10 Low FEMA zone X (unshaded) · 0% chance over 30 yrs
- Wildfire 1/10 Low
- Heat 3/10 Moderate 7 d/yr ≥100°F today · 18 d/yr by 30 yrs out
- Wind 2/10 Low
- Air quality 2/10 Low 1 unhealthy d/yr today · 2 by 30 yrs out
Nearby sold comps map
Loading sold comps map…
Walkable amenities ~0.75 mi
Loading nearby amenities…
Taxation est. · year 1
- Rental income
- $16,781
- − Mortgage interest
- −$12,046
- − Property taxes
- −$3,226
- − Insurance
- −$1,075
- − Repairs & maintenance
- −$1,342
- − Management
- −$1,342
- − Depreciation
- −$6,256
- Taxable loss
- −$8,507
- Est. tax savings @ 24.0%
- +$2,042
- After-tax cash flow
- $-2,536/yr
For passive investors: Depreciation is non-cash, so a rental often shows a tax loss while cash-flowing — sheltering income. Rental losses are passive: they offset passive income freely, and up to $25,000/yr can offset ordinary (W-2) income if you actively participate and your MAGI is under $100k (phasing out to $0 by $150k); unused losses carry forward. On sale, claimed depreciation is recaptured at up to 25%, and gains may owe capital-gains tax (a 1031 exchange can defer both). Figures are a year-1 estimate at your 24.0% rate — not tax advice; consult a CPA.
Schools (NCES district)
- District
- Benjamin Logan Local
- NCES district ID
- 3904807
- Math proficiency
- 64% ▼ -9.00%
- Reading proficiency
- 66% ▼ -3.00%
- Median HH income
- $59,496
- Composite
- 56.13/100
- National rank
- #1181
- State rank
- #197 of 656 in OH
Livability — West Mansfield
- Score
- 62/100
- State rank
- #866
- US rank
- #16392
Category grades
Schools grade is shown separately in the Schools card above.
Census & demographics
- Census place
- West Mansfield, OH
- County
- Logan · 47,256 people
- Population (ZIP)
- 2,628
- Household income
- $86,742
- Rent vs Own
- Severe rent burden
- 1.9
Population outlook (Logan County) Hauer SSP2
- Today (2025)
- 44,240 people
- By 2030
- 43,166 · -2.4%
- By 2040
- 40,495 · -8.5%
- By 2050
- 37,511 · -15.2%
- By 2075
- 30,453 · -31.2%
- By 2100
- 23,081 · -47.8%
Race, ethnicity, and origin ACS 2023
- Neighborhood character
- Predominantly White (89%)
- Race & ethnicity
- White 89% Two or more races 10%
- Common ancestry
- Italian 2% Lithuanian 2% Slovak 1%
- Foreign-born
- 1%
- Languages at home
- 98% English-only · Other Asian/Pacific 1%
Political lean MEDSL · Logan
- 2024 margin
- Solid R (+56.2) · D 21.5% · R 77.7%
- 2008→2024 swing
- -29.6pp toward R · 2008: -26.6pp · 2024: -56.2pp
- All cycles
- 2024: R+56.2 2020: R+55.2 2016: R+52.6 2012: R+31.8 2008: R+26.6
Not yet ingested
- Civics
- —
Market trends
- HPI YoY
- ▼ -71.86%
- Current HPI
- 283.1267
- Rent YoY
- —
- Metro
- —
- State GDP YoY
- ▲ 1.98%
- F500 in state
- 48
Industry mix (Fortune 500 HQ in OH)
| Industry | F500 HQs | Revenue |
|---|---|---|
| Insurance | 3 | $145B |
|
||
| Industrial Machinery | 3 | $49B |
|
||
| Financial Services | 3 | $24B |
|
||
| Consumer Goods | 2 | $93B |
|
||
| Aerospace / Defense | 2 | $47B |
|
||
| Utilities | 2 | $33B |
|
||
Property tax history
+6.3%/yrLatest (2025): $1,518 · +14.5% YoY. Source: county tax records.
Cash-flow waterfall
monthlySold comps — $/sqft
last 12 mo · ≤1 miLoading sold comps…