3835 Edge Rd · Preston, TX
Flood risk No data
- FEMA flood zone
- —
- Chance of flooding over 30 yrs
- —
- Est. flood insurance / yr
- —
Fire risk No data
- Est. fire insurance / yr
- —
Heat risk No data
- Hot days now (above threshold)
- —
- Hot days in 30 yrs
- —
Wind risk No data
- Chance of severe wind over 30 yrs
- —
Air-quality risk No data
- Unhealthy air days now
- —
- Unhealthy air days in 30 yrs
- —
Risk factors via First Street. Map © Google.
Why this score? — see what drove the B+ grade
The composite is a weighted blend of 9 inputs, each scored 0–100. Each bar is that input's sub-score; the figure is the points it added to the 100-point composite (weight × sub-score).
- Cash flow +26.4/30.0
- ARV discount +15.0/15.0
- Appreciation +10.0/10.0
- DSCR +9.0/10.0
- 1% rule +6.4/10.0
- Condition / age +4.0/5.0
- Livability +2.8/5.0
- Rent growth +2.5/5.0
- Schools +2.5/10.0
$199,999
🖨 Deal sheet (PDF) 📄 Offer letter ✓ Due diligence
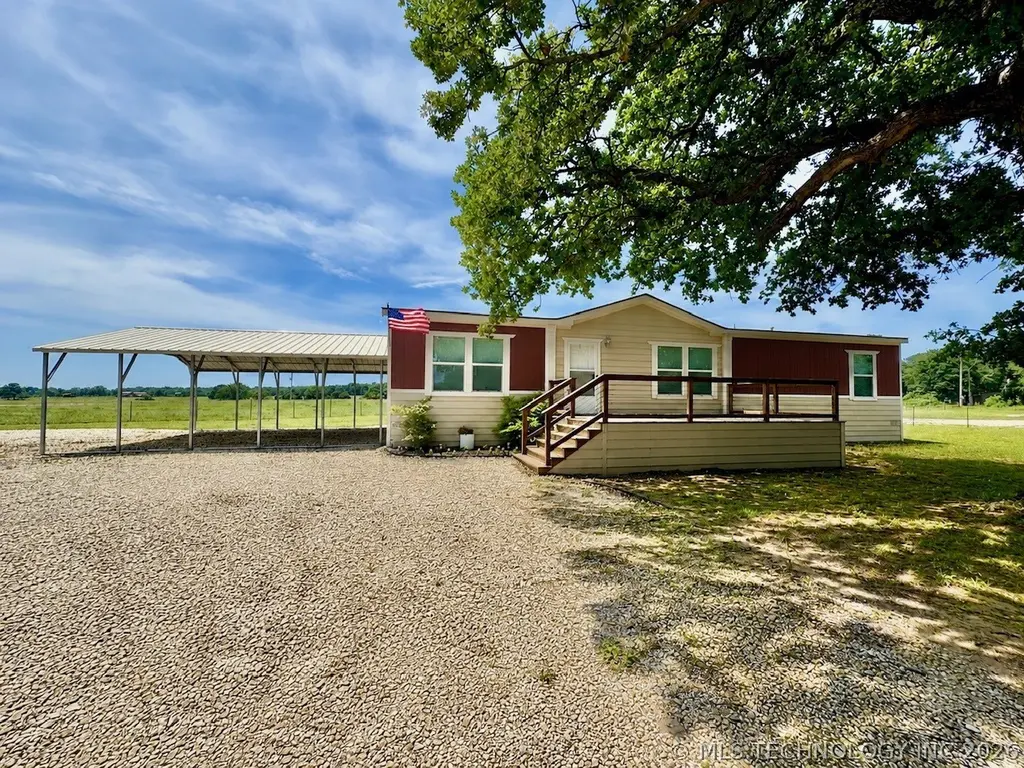
Listing remarks
New lake home close to the amazing sandy beaches of Lake Texoma! Here is your opportunity to own a brand-new, never-lived-in home at an affordable price point. Move-in ready with no hassle of setting anything up, this home features an open concept design with custom accents throughout. Enjoy the custom entertainment center in the living room, coffee nook in the kitchen, full pantry, and spacious primary suite with a large walk-in shower and soaking tub. Outside, you’ll find a shaded front patio, beautiful landscaping, covered carport, and circle driveway. Situated on an oversized . 75-acre corner lot with mature trees, this property offers plenty of room to relax and enjoy lake living
Key facts
- Covered carport
- Full pantry
- Open concept design
Tags
Property features AI
Exterior
- Parking: 2-car garage; Carport
- Security: Smoke detectors; No safety shelter
- Utilities: Electricity available; Water available (rural); Septic tank
- Home design: Double wide manufactured home; Single-story; Faces northeast; Permanent slab foundation with tie-downs
- Construction: HardiPlank-type siding; Manufactured construction; Asphalt/fiberglass roof; Built by builder (year built source: builder)
- Exterior features: Patio; Porch; Gravel driveway; Outdoor lighting; Wire fencing; Beach access and water access to Texoma Lake; Boat ramp/lift access; Corner lot with mature trees
Interior
- Kitchen: Eat-in kitchen with island and pantry; Convection oven; Cooktop; Oven; Range; Microwave; Dishwasher; Refrigerator
- Bedrooms: Master bedroom with private bath and walk-in closet (First level); Additional bedrooms (First level)
- Flooring: Carpet; Vinyl
- Bathrooms: Master bath with separate shower, bathtub and double sink (First level); Hall full bathroom with bathtub (First level); Total of 2 full bathrooms
- Heating & cooling: Central heating (electric); Central air conditioning
- Interior features: Wet bar; Laminate counters; Vaulted ceilings; Ceiling fans; Electric oven and range connections; Programmable thermostat; Vinyl insulated windows
- Laundry & utility: Washer hookup; Electric dryer hookup
Neighborhood map
What this means for you Summary
Snapshot
- This is a 3-bed/2.0-bath manufactured listed at $200k. Condition is rated good.
Deal economics
- At list price, monthly cash flow is $526 ($6k/yr) — positive.
- The deal already cash-flows at list — no discount required.
- Meets the 1% rule at list price ($2k rent vs $200k).
- Recommended offer: $194k (3.0% below list) — sets the bar for market timing.
- Cap rate 9.4% vs local median 2.9% in Preston — top-decile yield for the area; either an underpriced asset or a hidden risk that comps aren't pricing in. Stress-test before assuming the spread holds.
Location & tenants
- Location reads 56/100 on livability (#1,306 in TX) — a working-class tenant base; expect higher turnover. Strengths: crime A+, cost of living A+, housing A+; Watch: employment D, amenities F, commute F.
- Kingston (rural): math 27% / reading 32% proficiency, ranked #70 of 270 in OK (top 26%) — low school quality limits family demand, transient renter base, plan for 1-2y turnover; 76% free/reduced lunch — lower-income household profile, screen leases tightly.
- Zoned schools: Kingston Es (math 33% / reading 32%, grade F, #210 of 845 statewide, top 25%, 620 students, 0% FRL); Kingston Ms (math 23% / reading 34%, grade F, #57 of 345 statewide, top 18%, 286 students, 0% FRL); Kingston Hs (math 22% / reading 27%, grade F, #150 of 447 statewide, top 48%, 362 students, 0% FRL) — zoned schools average 0% FRL vs 76% district-wide (76 pts lower); this property's tenant base skews higher-income than the district average.
- Market conditions: 42 units permitted in Marshall County in 2024 (0 in 5+ unit buildings).
Forward outlook
- In year one you build about $21k of equity ($1k loan paydown + $20k appreciation (10.0% local appreciation)).
- Marshall County population projected at +22% by 2050 — long-run rental-demand tailwind backs the buy-and-hold thesis.
- At projected returns (10.0% appreciation + 3.0% rent growth), your $56k cash investment doubles in ~2 years — after that, you're playing with house money.
- By year 2, paydown + projected appreciation supports a ~$34k cash-out refi (75% LTV) — recoverable capital for the next deal without selling this one.
Negotiation context
- It's been on market 42 days — a 3% lower offer ($194k) is reasonable based on typical stale-listing flexibility.
- 3 sale attempts with the ask held roughly flat each time — persistent listings suggest the price (not the market) is what's stuck; bring a comps-based counter.
Questions for the listing agent
- It's been on market 42 days. Have you received any prior offers? Is the seller open to a 3% concession, seller financing, or rate buy-down credit?
- Is there a deadline driving the sale (1031 exchange, divorce, estate, relocation)? That informs how much negotiation room exists.
- Schools are F-rated, which usually means shorter tenancies and higher turnover. Who's the typical renter profile here, and what's been the actual vacancy rate?
- What's the average days-on-market for RENTAL listings here right now (not sales)? A rising rental-DOM trend means longer vacancies and softer asking-rent achievability than the comps imply.
- What's the recent tenant-quality profile in this submarket — average credit score on applications, eviction rate, late-payment / NSF rate, and stable-employment percentage? A property-management company in the area should have these aggregated.
- How much new for-sale + rental construction is in the pipeline within 1–3 miles? Heavy new supply typically softens prices + rents 12–24 months out; constrained supply supports both.
Investment metrics
- 1% rule
- 1.14% ✓
- Cap rate
- 9.45%
- Cash-on-cash
- 11.26%
- DSCR
- 1.50
- GRM
- 7.3
CMA / ARV
- ARV (on-the-fly)
- $276,024
- Comps found
- 2
Show comp detail 2 sales within ~0.75 mi
| Address | Dist | Beds/Ba | Sqft | Sold | Price | $/sf | Match |
|---|---|---|---|---|---|---|---|
| 10856 E Pecan Rd | 0.16mi | 4/2.0 (+1) | 1,493 (-14%) | 19mo | $180,000 | $121 | 48 |
| 3373 Scotty Ln | 0.64mi | 3/2.0 | 1,512 (-13%) | 11mo | $240,000 | $159 | 40 |
Match score weights: distance 35% · size 25% · config 20% · recency 20%. Top-matched comps best support the ARV.
Projected returns pro-forma
10.0% appreciation · 3.0% rent growth · sell at horizon
- IRR
- 32.5%
- Equity multiple
- 3.54×
- Total profit
- $142,367
- Equity at exit
- $180,175
- IRR
- 28.1%
- Equity multiple
- 8.02×
- Total profit
- $392,851
- Equity at exit
- $388,554
Cash invested: $56,000 (down + closing). Projections, not guarantees.
Landlord ↔ Tenant lean methodology
- Overall (STATE)
- 87 Strongly Landlord-Friendly
- State Texas
- 87 Strongly Landlord-Friendly · R+5
- County
- — inherits STATE
- City
- — inherits STATE
ZIP-level market 73439
- Home prices YoY
- 12.3%
- Price-to-rent
- 7.3×
Monthly cashflow live
- Estimated rent
- $2,272 medium interval (Pro) →
- Mortgage (P&I)
- −$1,049
- Tax from tax record
- −$137 /mo · $1,641/yr
- Insurance
- −$83
- HOA
- −$0
- Vacancy / Maint / Mgmt
- −$477
- Net cashflow
- $526
Break-even live
Sensitivity live
| Price | -10% $639 | -5% $582 | +0% $526 | +5% $469 | +10% $412 |
|---|---|---|---|---|---|
| Rent | -10% $346 | -5% $436 | +0% $526 | +5% $615 | +10% $705 |
| Rate | -1.0pp $626 | -0.5pp $577 | base $526 | +0.5pp $474 | +1.0pp $421 |
UW: 25.0% down · 7.5% · 30yr · 1.5% tax · 5.0% vac · 8.0% maint · 8.0% mgmt
Financing live
Cash to close
- Down payment
- $50,000
- Closing costs
- $6,000
- Reserves months
- —
- Total cash needed
- —
Loan-product check · same deal, 3 products live
Conventional
25% down · 7.5% · 30yr
- Down + closing
- —
- Monthly P&I
- —
- Monthly cashflow
- —
- DSCR
- —
- Eligible?
- —
Personal DTI + credit; lowest rate.
DSCR
20% down · 8.5% · 30yr
- Down + closing
- —
- Monthly P&I
- —
- Monthly cashflow
- —
- DSCR
- —
- Eligible?
- —
No personal income docs; deal must DSCR.
Hard money
10% down · 12.0% · 12mo
- Down + closing
- —
- Monthly P&I
- —
- Monthly cashflow
- —
- DSCR
- —
- Eligible?
- —
Short-term bridge; refi at stabilization.
Listing history 22 events
-
2026-06-19days on market $199,999 Active 42 DOM
-
2026-06-18days on market $199,999 Active 41 DOM
-
2026-06-17days on market $199,999 Active 40 DOM
-
2026-06-16days on market $199,999 Active 39 DOM
-
2026-06-15days on market $199,999 Active 38 DOM
-
2026-06-14days on market $199,999 Active 36 DOM
-
2026-06-13days on market $199,999 Active 35 DOM
-
2026-06-10days on market $199,999 Active 33 DOM
-
2026-06-09days on market $199,999 Active 32 DOM
-
2026-06-08days on market $199,999 Active 31 DOM
-
2026-06-07days on market $199,999 Active 30 DOM
-
2026-06-05days on market $199,999 Active 27 DOM
-
2026-06-02days on market $199,999 Active 25 DOM
-
2026-06-01days on market $199,999 Active 24 DOM
-
2026-05-31days on market $199,999 Active 23 DOM
-
2026-05-30days on market $199,999 Active 22 DOM
-
2026-05-08$199,999 Active
-
2026-05-06historical
-
2026-01-08$199,999 Active
-
2025-12-07historical
-
2025-08-23price $225,000
-
2025-06-06$249,999 Active
ⓘ Source: listings_history table (triggers on properties + properties_extension) + one-shot
backfill from property_details.listing_events for pre-trigger history.
Tax reassessment forecast TX · Resets to sale price
- Current annual tax
- $1,641 · $137/mo
- Projected year-2 tax
- $3,660 · $305/mo
- Expected delta
- +$2,019/yr (+$168/mo · 123.0%)
ⓘ Screening estimate from a state-policy table — verify with the county assessor before closing.
Nearby sold comps map
Loading sold comps map…
Walkable amenities ~0.75 mi
Loading nearby amenities…
Taxation est. · year 1
- Rental income
- $27,259
- − Mortgage interest
- −$11,203
- − Property taxes
- −$1,641
- − Insurance
- −$1,000
- − Repairs & maintenance
- −$2,181
- − Management
- −$2,181
- − Depreciation
- −$5,818
- Taxable income
- $3,235
- Est. tax owed @ 24.0%
- −$776
- After-tax cash flow
- $5,531/yr
For passive investors: Depreciation is non-cash, so a rental often shows a tax loss while cash-flowing — sheltering income. Rental losses are passive: they offset passive income freely, and up to $25,000/yr can offset ordinary (W-2) income if you actively participate and your MAGI is under $100k (phasing out to $0 by $150k); unused losses carry forward. On sale, claimed depreciation is recaptured at up to 25%, and gains may owe capital-gains tax (a 1031 exchange can defer both). Figures are a year-1 estimate at your 24.0% rate — not tax advice; consult a CPA.
Condition & rehab AI · 12 photos
This move-in ready manufactured home is in excellent condition with modern finishes and a prime location by the lake. It offers a great opportunity for a new owner to enjoy lake living.
Value-add opportunities
- Both Landscaping and curb appeal improvements — Enhances curb appeal and could attract more buyers
- Both Add a smart home system — Improves convenience and energy efficiency
Renovation cost estimate screening
Value-add ROI direction
- Both Landscaping and curb appeal improvements — Enhances curb appeal and could attract more buyers ↑
- Both Add a smart home system — Improves convenience and energy efficiency ↑
ⓘ Cost ranges are severity-bucket heuristics (US national rule-of-thumb). Get contractor quotes + a written scope before underwriting a rehab budget.
Schools (NCES district)
- District
- Kingston
- NCES district ID
- 4016590
- Math proficiency
- 27% ▼ -7.00%
- Reading proficiency
- 32% ▼ -7.00%
- Median HH income
- $40,655
- Composite
- 24.88/100
- National rank
- #7585
- State rank
- #70 of 270 in OK
Livability — Preston
- Score
- 56/100
- State rank
- #1306
- US rank
- #22637
Category grades
Schools grade is shown separately in the Schools card above.
Census & demographics
- Population (ZIP)
- 7,011
Population outlook (Marshall County) Hauer SSP2
- Today (2025)
- 17,405 people
- By 2030
- 18,038 · +3.6%
- By 2040
- 19,513 · +12.1%
- By 2050
- 21,283 · +22.3%
- By 2075
- 27,884 · +60.2%
- By 2100
- 35,435 · +103.6%
Race, ethnicity, and origin ACS 2023
- Neighborhood character
- Predominantly White (75%)
- Race & ethnicity
- White 75% Two or more races 16% Native American 5% Hispanic / Latino 4%
- Common ancestry
- Lithuanian 3% Italian 2% Serbian 1%
- Foreign-born
- 1% · Canada
- Languages at home
- 97% English-only · Spanish 3%
Political lean MEDSL · Marshall
- 2024 margin
- Solid R (+63.4) · D 17.7% · R 81.2% · Other 1.1%
- 2008→2024 swing
- -24.6pp toward R · 2008: -38.8pp · 2024: -63.4pp
- All cycles
- 2024: R+63.4 2020: R+62.5 2016: R+56.6 2012: R+45.7 2008: R+38.8
Not yet ingested
- Civics
- —
Market trends
- HPI YoY
- ▲ 26.96%
- Current HPI
- 246.2253
- Rent YoY
- —
- Metro
- —
- State GDP YoY
- ▲ 3.95%
- F500 in state
- 110
Industry mix (Fortune 500 HQ in TX)
| Industry | F500 HQs | Revenue |
|---|---|---|
| Energy | 16 | $1,198B |
|
||
| Technology | 5 | $198B |
|
||
| Engineering / Construction | 4 | $72B |
|
||
| Energy Services | 3 | $60B |
|
||
| Utilities | 3 | $41B |
|
||
| Healthcare | 2 | $330B |
|
||
Price history
-20.0% since first listed6 events — show timeline
- 2026-05-08 Listed $199,999 MLS Technology, Inc.
- 2026-05-06 Listing Removed — MLS Technology, Inc.
- 2026-01-08 Listed $199,999 MLS Technology, Inc.
- 2025-12-07 Listing Removed — MLS Technology, Inc.
- 2025-08-23 Price Changed $225,000 MLS Technology, Inc.
- 2025-06-06 Listed $249,999 MLS Technology, Inc.
Property tax history
+334.1%/yrLatest (2025): $1,641 · +334.1% YoY. Source: county tax records.
Cash-flow waterfall
monthlySold comps — $/sqft
last 12 mo · ≤1 miLoading sold comps…