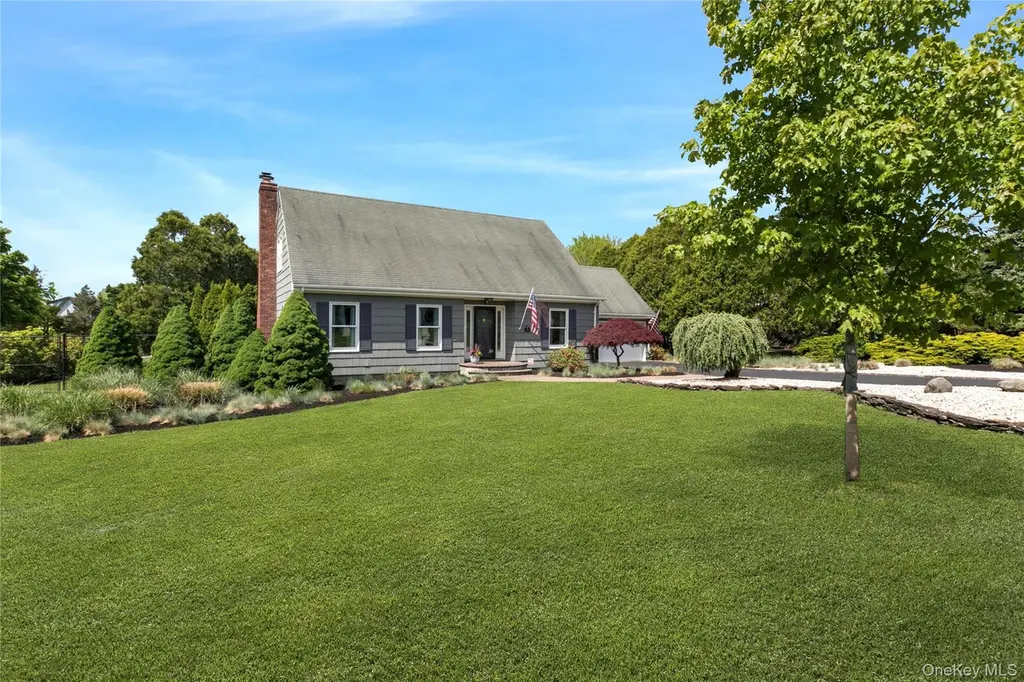
450 Maple Ln · Greenport West, NY
Flood risk No data
- FEMA flood zone
- —
- Chance of flooding over 30 yrs
- —
- Est. flood insurance / yr
- —
Fire risk No data
- Est. fire insurance / yr
- —
Heat risk No data
- Hot days now (above threshold)
- —
- Hot days in 30 yrs
- —
Wind risk No data
- Chance of severe wind over 30 yrs
- —
Air-quality risk No data
- Unhealthy air days now
- —
- Unhealthy air days in 30 yrs
- —
Risk factors via First Street. Map © Google.
Why this score? — see what drove the C+ grade
The composite is a weighted blend of 9 inputs, each scored 0–100. Each bar is that input's sub-score; the figure is the points it added to the 100-point composite (weight × sub-score).
- Cash flow +26.2/30.0
- DSCR +8.9/10.0
- ARV discount +7.2/15.0
- 1% rule +6.2/10.0
- Schools +4.5/10.0
- Livability +2.9/5.0
- Rent growth +2.5/5.0
- Condition / age +2.5/5.0
- Appreciation +0.0/10.0
$1,150,000
🖨 Deal sheet 📄 Offer letter ✓ Due diligence
Listing remarks
Welcome to North Fork living at its finest! This beautifully maintained 3-bedroom 2 1/2-bath home offers the perfect blend of coastal charm and comfort, ideally located just moments from the golf course and with private beach access. Surrounded by stunning, professionally landscaped grounds, the property features an inviting deck and spacious patio-perfect for outdoor entertaining or relaxing in a peaceful setting. Inside you will find a layout designed for both everyday living and weekend getaways. Whether you're seeking a year-round residence or a serene retreat, this exceptional home captures the best of the North Fork lifestyle
Key facts
- Inviting deck
- Private beach access
- Spacious patio
Tags
Property features AI
Finance
- HOA & community: Membership in Cleaves Pt association (annual fee $450)
Exterior
- Parking: Driveway; 2-car garage
- Security: Security system; Smoke detectors
- Utilities: Cesspool septic; Cable connected; Electricity connected; Water connected
- Home design: Single family residence
- Construction: Crawl and dormer attic; Basement with full height, Bilco door(s) and storage space; Construction materials: Unknown
- Exterior features: Awning(s); Chain-link and backyard fencing; Corner lot; Landscaped grounds; Near golf course
Interior
- Kitchen: Dishwasher; Gas cooktop; Gas oven; Microwave; Refrigerator; Stainless steel appliances; Kitchen island
- Bedrooms: Total rooms: 7 (includes bedrooms and living spaces)
- Flooring: Carpet; Hardwood; Laminate; Tile
- Bathrooms: 2 full bathrooms; 1 half bathroom
- Heating & cooling: Baseboard heating (oil); Central air conditioning
- Interior features: Ceiling fans; Central vacuum; Crown molding; Entrance foyer; Formal dining room; Kitchen island; Primary bathroom; Walk-in closet(s); Double-pane windows
- Laundry & utility: Dedicated laundry room; Generator on property
Neighborhood map
What this means for you Summary
Snapshot
- This is a 3-bed/2.5-bath single-family listed at $1.15M.
Deal economics
- At list price, monthly cash flow is $3k ($35k/yr) — positive.
- The deal already cash-flows at list — no discount required.
- Meets the 1% rule at list price ($13k rent vs $1.15M).
- Recommended offer: $1.13M (1.5% below list) — sets the bar for market timing.
Location & tenants
- Location reads 58/100 on livability (#1,073 in NY) — a working-class tenant base; expect higher turnover. Strengths: crime A+, employment A+; Watch: amenities F, commute F, cost of living F.
- Greenport Union Free School District (town): math 55% / reading 45% proficiency, ranked #450 of 755 in NY (top 60%) — acceptable for families but not a draw, mixed tenant base, ~2y average lease.
- Zoned schools: Greenport Elementary School (math 47% / reading 62%, grade C, #908 of 2,108 statewide, top 46%, 339 students, 61% FRL); Greenport High School (math 52% / reading 54%, grade C-, #934 of 1,100 statewide, top 86%, 356 students, 63% FRL).
- Market conditions: 67 active listings in the ZIP; 11 comparable units currently listed for rent nearby; rentals lingering (median 44d on market — plan ~5-8 weeks vacancy on turnover, expect pricing pressure); 73% of comp listings sitting > 30 days — soft ceiling on asking rent; 1,366 units permitted in Suffolk County in 2024 (216 in 5+ unit buildings).
Forward outlook
- Local home prices are declining (-3.0%/yr); year-one equity from $8k of loan paydown is wiped out by about $34k of value loss. Plan a longer hold.
- Suffolk County population projected to shrink 5% by 2050 — rents likely to lag national; underwrite the cash flow, not the appreciation.
- At projected returns (-3.0% appreciation + 3.0% rent growth), your $322k cash investment doubles in ~10 years — after that, you're playing with house money.
Negotiation context
- It's been on market 20 days — a 2% lower offer ($1.13M) is reasonable based on typical stale-listing flexibility.
Questions for the listing agent
- Built in 1978 — when were the roof, HVAC, electrical panel, plumbing, and water heater last replaced?
- What does the HOA fee cover, when was the last increase, and are there any pending special assessments or reserve-fund shortfalls?
- Is there a deadline driving the sale (1031 exchange, divorce, estate, relocation)? That informs how much negotiation room exists.
- Schools are D-rated, which usually means shorter tenancies and higher turnover. Who's the typical renter profile here, and what's been the actual vacancy rate?
- What's the average days-on-market for RENTAL listings here right now (not sales)? A rising rental-DOM trend means longer vacancies and softer asking-rent achievability than the comps imply.
- What's the recent tenant-quality profile in this submarket — average credit score on applications, eviction rate, late-payment / NSF rate, and stable-employment percentage? A property-management company in the area should have these aggregated.
- How much new for-sale + rental construction is in the pipeline within 1–3 miles? Heavy new supply typically softens prices + rents 12–24 months out; constrained supply supports both.
Investment metrics
- 1% rule
- 1.12% ✓
- Cap rate
- 9.37%
- Cash-on-cash
- 10.99%
- DSCR
- 1.49
- GRM
- 7.4
CMA / ARV
- ARV (on-the-fly)
- $1,141,200
- Comps found
- 2
Show comp detail 2 sales within ~0.75 mi
| Address | Dist | Beds/Ba | Sqft | Sold | Price | $/sf | Match |
|---|---|---|---|---|---|---|---|
| 600 Shipyard Ln | 0.23mi | 3/2.5 | 1,800 (0%) | 9mo | $1,100,000 | $611 | 82 |
| 75 Gull Pond Ln | 0.26mi | 3/2.0 | 1,655 (-8%) | 10mo | $1,050,000 | $634 | 64 |
Match score weights: distance 35% · size 25% · config 20% · recency 20%. Top-matched comps best support the ARV.
Projected returns pro-forma
-3.0% appreciation · 3.0% rent growth · sell at horizon
- IRR
- 0.1%
- Equity multiple
- 1.00×
- Total profit
- $1,234
- Equity at exit
- $171,469
- IRR
- 9.7%
- Equity multiple
- 1.75×
- Total profit
- $241,959
- Equity at exit
- $99,431
Cash invested: $322,000 (down + closing). Projections, not guarantees.
Landlord ↔ Tenant lean methodology
- Overall (STATE)
- 15 Strongly Tenant-Friendly
- State New York
- 15 Strongly Tenant-Friendly · D+10
- County
- — inherits STATE
- City
- — inherits STATE
ZIP-level market 11944
- Home prices YoY
- -23.7%
- Active inventory
- 67
- Price-to-rent
- 7.4×
Monthly cashflow live
- Estimated rent
- $12,902 high interval (Pro) →
- Mortgage (P&I)
- −$6,031
- Tax from tax record
- −$696 /mo · $8,353/yr
- Insurance
- −$479
- HOA
- −$38
- Vacancy / Maint / Mgmt
- −$2,710
- Net cashflow
- $2,949
Break-even live
UW: 25.0% down · 7.5% · 30yr · 1.5% tax · 5.0% vac · 8.0% maint · 8.0% mgmt
Financing live
Cash to close
- Down payment
- $287,500
- Closing costs
- $34,500
- Reserves months
- —
- Total cash needed
- —
Loan-product check · same deal, 3 products live
Conventional
25% down · 7.5% · 30yr
- Down + closing
- —
- Monthly P&I
- —
- Monthly cashflow
- —
- DSCR
- —
- Eligible?
- —
Personal DTI + credit; lowest rate.
DSCR
20% down · 8.5% · 30yr
- Down + closing
- —
- Monthly P&I
- —
- Monthly cashflow
- —
- DSCR
- —
- Eligible?
- —
No personal income docs; deal must DSCR.
Hard money
10% down · 12.0% · 12mo
- Down + closing
- —
- Monthly P&I
- —
- Monthly cashflow
- —
- DSCR
- —
- Eligible?
- —
Short-term bridge; refi at stabilization.
Rent comps 11 comps
| Address | Beds | Baths | Sqft | Rent | $/sqft | DOM | Units | Dist |
|---|---|---|---|---|---|---|---|---|
| 1110 Gillette Dr East Marion, NY | 4.0 | 2.0 | 1500 | $7,000 | $4.67 | 19d | 1 | 0.41mi |
| 300 Marion Pl East Marion, NY | 3.0 | 2.0 | 1750 | $19,000 | $10.86 | 24d | 1 | 0.84mi |
| 580 South Ln East Marion, NY | 3.0 | 2.5 | 2000 | $20,000 | $10.00 | 19d | 1 | 0.86mi |
| 460 Bay Ave East Marion, NY | 3.0 | 1.5 | 1500 | $8,000 | $5.33 | 43d | 1 | 0.86mi |
| 123 Sterling Ave #2 Greenport, NY | 3.0 | 3.0 | 1528 | $45,000 | $29.45 | 43d | 1 | 0.87mi |
| 3045 Rocky Point Rd East Marion, NY | 3.0 | 2.0 | 2025 | $12,000 | $5.93 | 43d | 1 | 0.98mi |
| 485 Sutton Pl Greenport, NY | 4.0 | 2.5 | 2026 | $20,000 | $9.87 | 43d | 1 | 1.05mi |
| 870 Stars Rd East Marion, NY | 3.0 | 3.0 | 1500 | $10,000 | $6.67 | 43d | 1 | 1.05mi |
| 312 5th Ave Greenport, NY | 4.0 | 2.0 | 1900 | $12,000 | $6.32 | 43d | 1 | 1.28mi |
| 11930 Main Rd East Marion, NY | 4.0 | 2.0 | 2200 | $3,500 | $1.59 | 43d | 1 | 1.31mi |
| 248 5th Ave Greenport, NY | 2.0 | 1.0 | 1306 | $3,500 | $2.68 | 43d | 1 | 1.31mi |
HOA detail
- Monthly dues
- $38 · $456/yr
- Likely covers
- landscaping
Listing history 15 events
-
2026-06-18days on market $1,150,000 Active 20 DOM
-
2026-06-17days on market $1,150,000 Active 19 DOM
-
2026-06-16days on market $1,150,000 Active 18 DOM
-
2026-06-15days on market $1,150,000 Active 17 DOM
-
2026-06-13days on market $1,150,000 Active 15 DOM
-
2026-06-12days on market $1,150,000 Active 14 DOM
-
2026-06-09days on market $1,150,000 Active 11 DOM
-
2026-06-08days on market $1,150,000 Active 10 DOM
-
2026-06-07days on market $1,150,000 Active 9 DOM
-
2026-06-05days on market $1,150,000 Active 7 DOM
-
2026-06-04days on market $1,150,000 Active 5 DOM
-
2026-06-02days on market $1,150,000 Active 4 DOM
-
2026-06-01days on market $1,150,000 Active 3 DOM
-
2026-05-31days on market $1,150,000 Active 2 DOM
-
2026-05-29$1,150,000 Active
ⓘ Source: listings_history table (triggers on properties + properties_extension) + one-shot
backfill from property_details.listing_events for pre-trigger history.
Tax reassessment forecast NY · Partial reset (capped growth)
- Current annual tax
- $8,353 · $696/mo
- Projected year-2 tax
- $13,894 · $1,158/mo
- Expected delta
- +$5,541/yr (+$462/mo · 66.3%)
ⓘ Screening estimate from a state-policy table — verify with the county assessor before closing.
Nearby sold comps map
Loading sold comps map…
Walkable amenities ~0.75 mi
Loading nearby amenities…
Taxation est. · year 1
- Rental income
- $154,830
- − Mortgage interest
- −$64,418
- − Property taxes
- −$8,353
- − Insurance
- −$5,750
- − Repairs & maintenance
- −$12,386
- − Management
- −$12,386
- − HOA
- −$456
- − Depreciation
- −$33,455
- Taxable income
- $17,625
- Est. tax owed @ 24.0%
- −$4,230
- After-tax cash flow
- $31,157/yr
For passive investors: Depreciation is non-cash, so a rental often shows a tax loss while cash-flowing — sheltering income. Rental losses are passive: they offset passive income freely, and up to $25,000/yr can offset ordinary (W-2) income if you actively participate and your MAGI is under $100k (phasing out to $0 by $150k); unused losses carry forward. On sale, claimed depreciation is recaptured at up to 25%, and gains may owe capital-gains tax (a 1031 exchange can defer both). Figures are a year-1 estimate at your 24.0% rate — not tax advice; consult a CPA.
Schools (NCES district)
- District
- Greenport Union Free School District
- NCES district ID
- 3612840
- Math proficiency
- 55% ▲ 5.00%
- Reading proficiency
- 45% ▼ -5.00%
- Median HH income
- $54,490
- Composite
- 45.25/100
- National rank
- #5759
- State rank
- #450 of 755 in NY
Livability — Greenport West
- Score
- 58/100
- State rank
- #1073
- US rank
- #21520
Category grades
Schools grade is shown separately in the Schools card above.
Census & demographics
- Census place
- Greenport West, NY
- Population (ZIP)
- 4,744
Population outlook (Suffolk County) Hauer SSP2
- Today (2025)
- 1,505,262 people
- By 2030
- 1,498,318 · -0.5%
- By 2040
- 1,471,101 · -2.3%
- By 2050
- 1,424,848 · -5.3%
- By 2075
- 1,337,157 · -11.2%
- By 2100
- 1,217,720 · -19.1%
Race, ethnicity, and origin ACS 2023
- Neighborhood character
- Predominantly White (69%)
- Race & ethnicity
- White 69% Hispanic / Latino 23% Two or more races 6% Black 4% Asian 2%
- Hispanic origin (detail)
- Mexican 5% Puerto Rican 2%
- Common ancestry
- Romanian 6% Lithuanian 2% Subsaharan African 2%
- Foreign-born
- 19% · Canada, China
- Languages at home
- 69% English-only · Spanish 22% German/W. Germanic 3% Russian/Polish/Slavic 2%
Political lean MEDSL · Suffolk
- 2024 margin
- Lean R (+10.0) · D 45.0% · R 55.0%
- 2008→2024 swing
- -16.0pp toward R · 2008: 6.0pp · 2024: -10.0pp
- All cycles
- 2024: R+10.0 2020: R+0.0 2016: R+8.2 2012: D+2.9 2008: D+6.0
Not yet ingested
- Civics
- —
Market trends
- HPI YoY
- ▼ -143.97%
- Current HPI
- 462.3431
- Rent YoY
- —
- Metro
- —
- State GDP YoY
- ▲ 2.60%
- F500 in state
- 92
Industry mix (Fortune 500 HQ in NY)
| Industry | F500 HQs | Revenue |
|---|---|---|
| Financial Services | 10 | $950B |
|
||
| Consumer Goods | 9 | $162B |
|
||
| Insurance | 4 | $225B |
|
||
| Telecommunications | 2 | $144B |
|
||
| Pharmaceuticals | 2 | $112B |
|
||
| Media / Entertainment | 2 | $69B |
|
||
Price history
1 event — show timeline
- 2026-05-29 Listed $1,150,000 OneKey® MLS as Distributed by MLS Grid
Property tax history
+3.2%/yrLatest (2025): $8,353 · +0.0% YoY. Source: county tax records.
Cash-flow waterfall
monthlySold comps — $/sqft
last 12 mo · ≤1 miLoading sold comps…