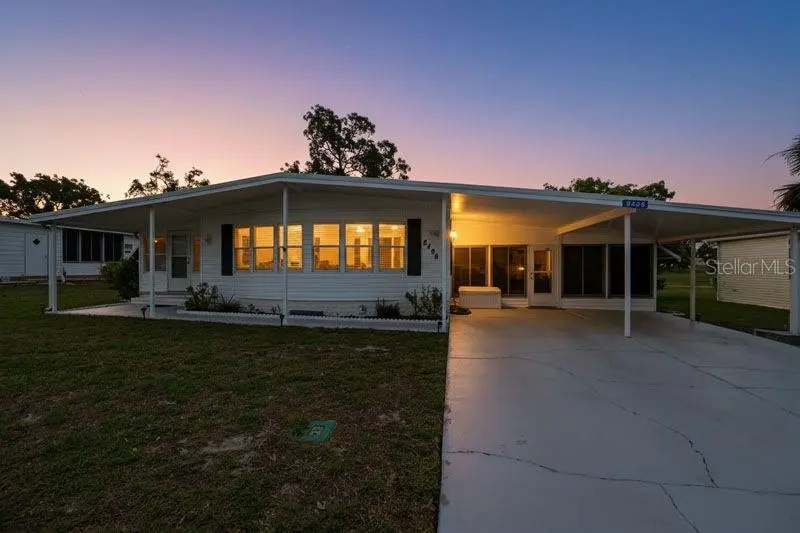
8496 Highpoint Blvd · High Point, FL
Flood risk 6/10 · Moderate
- FEMA flood zone
- X (unshaded)
- Chance of flooding over 30 yrs
- 0.74%
- Est. flood insurance / yr
- $507 – $1,088
Fire risk 4/10 · Minor
- Est. fire insurance / yr
- $947 – $1,759
Heat risk 10/10 · Severe
- Hot days now (above 109°F)
- 7 days/yr
- Hot days in 30 yrs
- 25 days/yr
Wind risk 9/10 · Severe
- Chance of severe wind over 30 yrs
- 99.0%
Air-quality risk 2/10 · Minimal
- Unhealthy air days now
- 2 days/yr
- Unhealthy air days in 30 yrs
- 2 days/yr
Risk factors via First Street. Map © Google.
Why this score? — see what drove the C- grade
The composite is a weighted blend of 9 inputs, each scored 0–100. Each bar is that input's sub-score; the figure is the points it added to the 100-point composite (weight × sub-score).
- Cash flow +23.0/30.0
- DSCR +7.4/10.0
- 1% rule +6.3/10.0
- ARV discount +4.4/15.0
- Schools +4.2/10.0
- Livability +3.2/5.0
- Rent growth +2.5/5.0
- Condition / age +2.5/5.0
- Appreciation +0.0/10.0
$150,000
🖨 Deal sheet (PDF) 📄 Offer letter ✓ Due diligence
Listing remarks
Under contract-accepting backup offers. There is A LOT to see here! WELCOME TO HIGH POINT! A DEED RESTRICTED 55+ GOLF COMMUNITY WHERE YOU OWN THE LAND! Located DIRECTLY ON THE GOLF COURSE! As you step into this home immediately to your right is the kitchen featuring a refrigerator, dishwasher, stove, microwave, and a single solid deep-dish sink which is great to wash large cookie sheets and large pans! Just off the kitchen is a cozy dinette area that flows into an oversized living room and larger dining room. There are plenty of windows allowing in natural light! Off the Livingroom, a very large, enclosed porch with windows and blinds provides additional living space ideal for a den, craft
Key facts
- Dog park
- Laundry room
- Community clubhouse
Tags
Neighborhood map
What this means for you Summary
Snapshot
- This is a 2-bed/2.0-bath manufactured listed at $150k.
Deal economics
- At list price, monthly cash flow is $266 ($3k/yr) — positive.
- The deal already cash-flows at list — no discount required.
- Meets the 1% rule at list price ($2k rent vs $150k).
- Cap rate 8.4% vs local median 5.8% in High Point — top-decile yield for the area; either an underpriced asset or a hidden risk that comps aren't pricing in. Stress-test before assuming the spread holds.
Location & tenants
- Location reads 64/100 on livability (#677 in FL) — a middle-class / working-renter tenant base. Strengths: cost of living A+, housing A+, crime A; Watch: health & safety C-, amenities F, commute F.
- Hernando (suburban): math 50% / reading 50% proficiency, ranked #38 of 73 in FL (top 52%) — acceptable for families but not a draw, mixed tenant base, ~2y average lease.
- Zoned schools: Pine Grove Elementary School (math 60% / reading 45%, grade C-, #976 of 2,144 statewide, top 46%, 991 students, 60% FRL); West Hernando Middle School (math 36% / reading 37%, grade F, #405 of 571 statewide, top 72%, 695 students, 58% FRL); Central High School (math 34% / reading 44%, grade F, #312 of 667 statewide, top 48%, 1,426 students, 53% FRL) — zoned schools at 57% FRL track the district average.
- Market conditions: 695 active listings in the ZIP; 5 comparable units currently listed for rent nearby; rentals at typical pace (median 26d on market — plan ~3-4 weeks tenant-placement turnaround); 2,505 units permitted in Hernando County in 2024 (318 in 5+ unit buildings).
- This rent runs 35% of the median local income ($59k/yr) — at the standard rent-burdened threshold; future hikes will face affordability resistance.
Forward outlook
- Local home prices are declining (-3.0%/yr); year-one equity from $1k of loan paydown is wiped out by about $4k of value loss. Plan a longer hold.
- Hernando County population projected at +11% by 2050 — modest demand growth; plan on rents tracking national, not racing it.
Negotiation context
- Only 7 days on market — expect competitive offers; lowballing is unlikely to land.
- Current owner paid $44k; list at $150k implies a 241% gain — meaningful room to come down on a strong offer.
Risks & watch-outs
- Climate carrying-cost: major flood risk; severe wind risk, 99% chance of damaging wind over 30y; extreme-heat days projected 7→25/yr by 2055 (HVAC capex compounding) — expect insurance premiums to compound above CPI over the hold.
Questions for the listing agent
- What does the HOA fee cover, when was the last increase, and are there any pending special assessments or reserve-fund shortfalls?
- Is there a deadline driving the sale (1031 exchange, divorce, estate, relocation)? That informs how much negotiation room exists.
- Schools are F-rated, which usually means shorter tenancies and higher turnover. Who's the typical renter profile here, and what's been the actual vacancy rate?
- What's the average days-on-market for RENTAL listings here right now (not sales)? A rising rental-DOM trend means longer vacancies and softer asking-rent achievability than the comps imply.
- What's the recent tenant-quality profile in this submarket — average credit score on applications, eviction rate, late-payment / NSF rate, and stable-employment percentage? A property-management company in the area should have these aggregated.
- How much new for-sale + rental construction is in the pipeline within 1–3 miles? Heavy new supply typically softens prices + rents 12–24 months out; constrained supply supports both.
Investment metrics
- 1% rule
- 1.13% ✓
- Cap rate
- 8.42%
- Cash-on-cash
- 7.61%
- DSCR
- 1.34
- GRM
- 7.4
CMA / ARV
- ARV (on-the-fly)
- $140,400
- Comps found
- 12
Show comp detail 12 sales within ~0.75 mi
| Address | Dist | Beds/Ba | Sqft | Sold | Price | $/sf | Match |
|---|---|---|---|---|---|---|---|
| 8134 Baycrest Dr | 0.14mi | 2/2.0 | 1,284 (+7%) | 2mo | $158,000 | $123 | 80 |
| 12041 Fairway Ave | 0.37mi | 2/2.0 | 1,152 (-4%) | 1mo | $135,000 | $117 | 75 |
| 12075 Walshwood Ave | 0.30mi | 2/2.0 | 1,104 (-8%) | 0mo | $107,084 | $97 | 72 |
| 12260 Hallmark Ave | 0.48mi | 2/2.0 | 1,152 (-4%) | 1mo | $105,000 | $91 | 70 |
| 12160 Sara | 0.24mi | 3/2.0 (+1) | 1,296 (+8%) | 2mo | $195,000 | $150 | 69 |
| 8795 Highpoint Blvd | 0.30mi | 2/2.0 | 1,344 (+12%) | 2mo | $145,000 | $108 | 65 |
| 7409 Eastern Circle Dr | 0.64mi | 2/2.0 | 1,296 (+8%) | 0mo | $163,000 | $126 | 56 |
| 7444 Highpoint Blvd | 0.71mi | 2/2.0 | 1,104 (-8%) | 1mo | $140,000 | $127 | 52 |
| 9328 Highpoint Blvd | 0.72mi | 2/2.0 | 1,334 (+11%) | 0mo | $153,000 | $115 | 48 |
| 9100 Highpoint Blvd | 0.63mi | 2/2.0 | 1,040 (-13%) | 2mo | $177,000 | $170 | 46 |
| 7528 Western Circle Dr | 0.66mi | 2/2.0 | 1,026 (-14%) | 1mo | $105,000 | $102 | 44 |
| 7156 Fairlane Ave | 0.74mi | 2/2.0 | 1,368 (+14%) | 1mo | $135,000 | $99 | 41 |
Match score weights: distance 35% · size 25% · config 20% · recency 20%. Top-matched comps best support the ARV.
Projected returns pro-forma
-3.0% appreciation · 3.0% rent growth · sell at horizon
- IRR
- -4.6%
- Equity multiple
- 0.83×
- Total profit
- $-7,296
- Equity at exit
- $22,365
- IRR
- 5.1%
- Equity multiple
- 1.37×
- Total profit
- $15,675
- Equity at exit
- $12,969
Cash invested: $42,000 (down + closing). Projections, not guarantees.
Landlord ↔ Tenant lean methodology
- Overall (STATE)
- 87 Strongly Landlord-Friendly
- State Florida
- 87 Strongly Landlord-Friendly · R+3
- County
- — inherits STATE
- City
- — inherits STATE
ZIP-level market 34613
- Home prices YoY
- -17.2%
- Active inventory
- 695
- Price-to-rent
- 7.4×
Monthly cashflow live
- Estimated rent
- $1,688 high interval (Pro) →
- Mortgage (P&I)
- −$787
- Tax from tax record
- −$172 /mo · $2,068/yr
- Insurance
- −$62
- HOA
- −$46
- Vacancy / Maint / Mgmt
- −$355
- Net cashflow
- $266
Break-even live
Sensitivity live
| Price | -10% $351 | -5% $309 | +0% $266 | +5% $224 | +10% $181 |
|---|---|---|---|---|---|
| Rent | -10% $133 | -5% $200 | +0% $266 | +5% $333 | +10% $400 |
| Rate | -1.0pp $342 | -0.5pp $305 | base $266 | +0.5pp $228 | +1.0pp $188 |
UW: 25.0% down · 7.5% · 30yr · 1.5% tax · 5.0% vac · 8.0% maint · 8.0% mgmt
Financing live
Cash to close
- Down payment
- $37,500
- Closing costs
- $4,500
- Reserves months
- —
- Total cash needed
- —
Loan-product check · same deal, 3 products live
Conventional
25% down · 7.5% · 30yr
- Down + closing
- —
- Monthly P&I
- —
- Monthly cashflow
- —
- DSCR
- —
- Eligible?
- —
Personal DTI + credit; lowest rate.
DSCR
20% down · 8.5% · 30yr
- Down + closing
- —
- Monthly P&I
- —
- Monthly cashflow
- —
- DSCR
- —
- Eligible?
- —
No personal income docs; deal must DSCR.
Hard money
10% down · 12.0% · 12mo
- Down + closing
- —
- Monthly P&I
- —
- Monthly cashflow
- —
- DSCR
- —
- Eligible?
- —
Short-term bridge; refi at stabilization.
Rent comps 5 comps
| Address | Beds | Baths | Sqft | Rent | $/sqft | DOM | Units | Dist |
|---|---|---|---|---|---|---|---|---|
| 12136 Fairway Ave Brooksville, FL | 2.0 | 2.0 | 920 | $1,650 | $1.79 | 26d | 1 | 0.19mi |
| 12103 Fairway Ave Brooksville, FL | 3.0 | 2.0 | 1500 | $1,600 | $1.07 | 0d | 1 | 0.26mi |
| 7402 Eastern Circle Dr Brooksville, FL | 2.0 | 1.0 | 720 | $1,200 | $1.67 | 26d | 1 | 0.67mi |
| 7405 Western Circle Dr Brooksville, FL | 2.0 | 2.0 | 1442 | $1,500 | $1.04 | 26d | 1 | 0.87mi |
| 13020 Sun Rd Brooksville, FL | 2.0 | 2.0 | 1424 | $1,700 | $1.19 | 26d | 1 | 1.29mi |
HOA detail
- Monthly dues
- $46 · $552/yr
Listing history 4 events
-
2026-04-23status Pending
-
2026-04-16$150,000 Active
-
2000-01-24soldstatus $44,000
-
1980-12-01soldstatus $8,000
ⓘ Source: listings_history table (triggers on properties + properties_extension) + one-shot
backfill from property_details.listing_events for pre-trigger history.
Tax reassessment forecast FL · Resets to sale price
- Current annual tax
- $2,068 · $172/mo
- Projected year-2 tax
- $2,068 · $172/mo
- Expected delta
- $0/yr ($0/mo · 0.0%)
ⓘ Screening estimate from a state-policy table — verify with the county assessor before closing.
Climate risk First Street
- Flood 6/10 Major FEMA zone X (unshaded) · 74% chance over 30 yrs
- Wildfire 4/10 Moderate
- Heat 10/10 Extreme 7 d/yr ≥109°F today · 25 d/yr by 30 yrs out
- Wind 9/10 Extreme 99% chance of damaging wind over 30 yrs
- Air quality 2/10 Low 2 unhealthy d/yr today · 2 by 30 yrs out
Nearby sold comps map
Loading sold comps map…
Walkable amenities ~0.75 mi
Loading nearby amenities…
Taxation est. · year 1
- Rental income
- $20,261
- − Mortgage interest
- −$8,402
- − Property taxes
- −$2,068
- − Insurance
- −$750
- − Repairs & maintenance
- −$1,621
- − Management
- −$1,621
- − HOA
- −$552
- − Depreciation
- −$4,364
- Taxable income
- $883
- Est. tax owed @ 24.0%
- −$212
- After-tax cash flow
- $2,985/yr
For passive investors: Depreciation is non-cash, so a rental often shows a tax loss while cash-flowing — sheltering income. Rental losses are passive: they offset passive income freely, and up to $25,000/yr can offset ordinary (W-2) income if you actively participate and your MAGI is under $100k (phasing out to $0 by $150k); unused losses carry forward. On sale, claimed depreciation is recaptured at up to 25%, and gains may owe capital-gains tax (a 1031 exchange can defer both). Figures are a year-1 estimate at your 24.0% rate — not tax advice; consult a CPA.
Schools (NCES district)
- District
- Hernando
- NCES district ID
- 1200810
- Math proficiency
- 50% ▼ -8.00%
- Reading proficiency
- 50% ▼ -4.00%
- Median HH income
- $41,985
- Composite
- 42.03/100
- National rank
- #3329
- State rank
- #38 of 73 in FL
Livability — High Point
- Score
- 64/100
- State rank
- #677
- US rank
- #14099
Category grades
Schools grade is shown separately in the Schools card above.
Census & demographics
- Census place
- High Point, FL
- County
- Hernando County · 169,677 people
- Metro
- Tampa-St. Petersburg-Clearwater, FL
- Population (ZIP)
- 19,337
- Household income
- $58,596
- Rent vs Own
- Severe rent burden
- 307.0
Population outlook (Hernando County) Hauer SSP2
- Today (2025)
- 189,218 people
- By 2030
- 194,367 · +2.7%
- By 2040
- 203,398 · +7.5%
- By 2050
- 209,589 · +10.8%
- By 2075
- 218,452 · +15.4%
- By 2100
- 205,923 · +8.8%
Race, ethnicity, and origin ACS 2023
- Neighborhood character
- Predominantly White (88%)
- Race & ethnicity
- White 88% Hispanic / Latino 6% Two or more races 4% Black 2% Asian 1%
- Hispanic origin (detail)
- Mexican 1% Puerto Rican 2% Cuban 1%
- Common ancestry
- Romanian 4% Lithuanian 3% Slovak 2%
- Foreign-born
- 8% · Canada, Vietnam
- Languages at home
- 92% English-only · Spanish 3% French/Haitian/Cajun 1% Russian/Polish/Slavic 1%
Political lean MEDSL · Hernando
- 2024 margin
- Solid R (+37.0) · D 31.1% · R 68.2%
- 2008→2024 swing
- -33.5pp toward R · 2008: -3.6pp · 2024: -37.0pp
- All cycles
- 2024: R+37.0 2020: R+30.2 2016: R+29.0 2012: R+8.5 2008: R+3.6
Not yet ingested
- Civics
- —
Market trends
- HPI YoY
- ▼ -57.51%
- Current HPI
- 276.2229
- Rent YoY
- —
- Metro
- Tampa-St. Petersburg-Clearwater, FL
- State GDP YoY
- ▲ 3.28%
- F500 in state
- 36
Industry mix (Fortune 500 HQ in FL)
| Industry | F500 HQs | Revenue |
|---|---|---|
| Industrial Technology | 2 | $29B |
|
||
| Insurance | 2 | $17B |
|
||
| Retail | 1 | $60B |
|
||
| Technology Distribution | 1 | $58B |
|
||
| Homebuilding | 1 | $35B |
|
||
| Technology Manufacturing | 1 | $35B |
|
||
Price history
+1775.0% since first listed4 events — show timeline
- 2026-04-23 Pending — Stellar MLS as Distributed by MLS Grid
- 2026-04-16 Listed $150,000 Stellar MLS as Distributed by MLS Grid
- 2000-01-24 Sold (Public Records) $44,000 Public Records
- 1980-12-01 Sold (Public Records) $8,000 Public Records
Property tax history
+37.4%/yrLatest (2025): $2,068 · -0.2% YoY. Source: county tax records.
Cash-flow waterfall
monthlySold comps — $/sqft
last 12 mo · ≤1 miLoading sold comps…