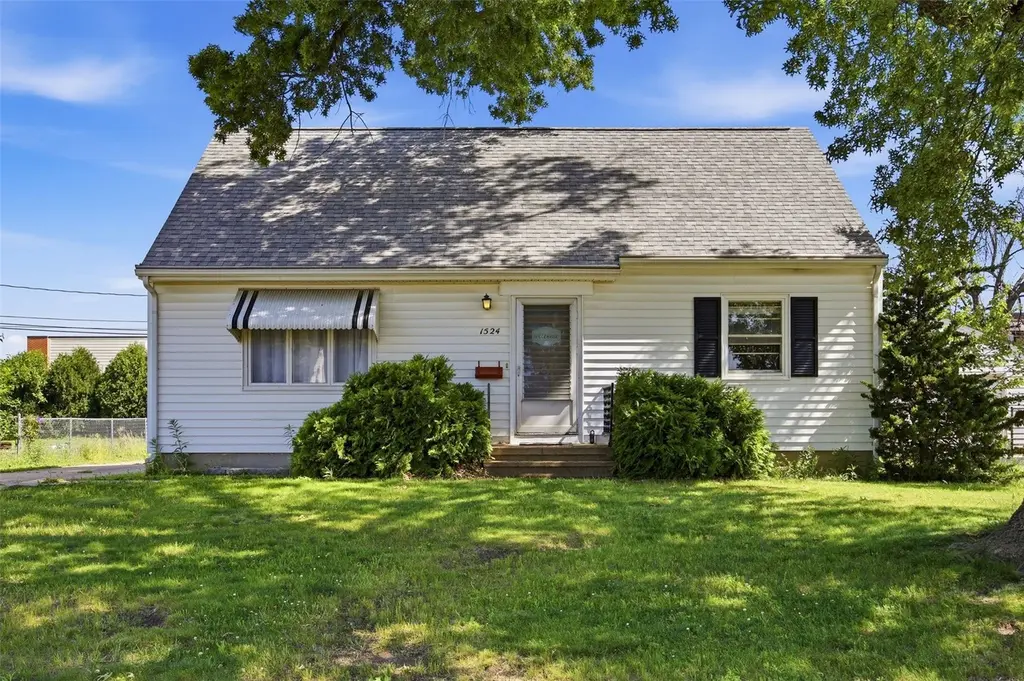
1524 48th St NE · Cedar Rapids, IA
Flood risk 1/10 · Minimal
- FEMA flood zone
- X (unshaded)
- Chance of flooding over 30 yrs
- 0.0%
- Est. flood insurance / yr
- $473 – $860
Fire risk 1/10 · Minimal
- Est. fire insurance / yr
- $902 – $1,676
Heat risk 3/10 · Minor
- Hot days now (above 103°F)
- 7 days/yr
- Hot days in 30 yrs
- 15 days/yr
Wind risk 2/10 · Minimal
- Chance of severe wind over 30 yrs
- —
Air-quality risk 2/10 · Minimal
- Unhealthy air days now
- 0 days/yr
- Unhealthy air days in 30 yrs
- 1 days/yr
Risk factors via First Street. Map © Google.
Why this score? — see what drove the C grade
The composite is a weighted blend of 9 inputs, each scored 0–100. Each bar is that input's sub-score; the figure is the points it added to the 100-point composite (weight × sub-score).
- Cash flow +21.5/30.0
- ARV discount +9.3/15.0
- DSCR +6.8/10.0
- 1% rule +5.5/10.0
- Rent growth +5.0/5.0
- Schools +4.7/10.0
- Livability +3.9/5.0
- Condition / age +2.5/5.0
- Appreciation +0.0/10.0
$195,000
🖨 Deal sheet 📄 Offer letter ✓ Due diligence
Listing remarks MLS
Spacious 1.5 story with 4 bedrooms, 2 baths, 20 x 24 garage with attic space and ample storage on all 3 levels. Cove ceilings, plastered walls and beautiful hardwood floors can be found on the mail level along with an eat-in kitchen, LR, 2 bedrooms and a bath. Upstairs features another 2 bedrooms and bath and LL features a rec room, laundry room and 2 more rooms for a shop, or exercise or craft rooms. All appliances are included. Roof tear-off and leaf-guard gutters were done in 2016 and a new furnace humidifier was added in 2021. This home has had only 2 owners with the present owners living there 50+ years. Close to Collins Aerospace, Noelridge Park and pool and behind St Pius. Estate. Sold "AS IS"!
Key facts
- Half bath
- Flex space
- Rec room
Tags
Property features AI
Exterior
- Parking: Detached 2-car garage with garage door opener
- Utilities: Public water; Public sewer
- Home design: Single-family residence; One and one-half level design; One story above grade
- Construction: Frame construction with vinyl siding
- Exterior features: Fenced yard
Interior
- Kitchen: Refrigerator; Range; Microwave; Dishwasher; Garbage disposal
- Bathrooms: Two full bathrooms; One half bathroom
- Heating & cooling: Natural gas forced-air heating; Central air conditioning
- Interior features: Eat-in kitchen; Full basement
- Laundry & utility: Washer; Dryer; Gas water heater
Neighborhood map
What this means for you Summary
Snapshot
- This is a 4-bed/2.0-bath single-family listed at $195k.
Deal economics
- At list price, monthly cash flow is $291 ($3k/yr) — positive.
- The deal already cash-flows at list — no discount required.
- Meets the 1% rule at list price ($2k rent vs $195k).
- Cap rate 8.1% vs local median 3.5% in Cedar Rapids — top-decile yield for the area; either an underpriced asset or a hidden risk that comps aren't pricing in. Stress-test before assuming the spread holds.
Location & tenants
- Location reads 78/100 on livability (#134 in IA, #2,474 nationally) — a middle-class / working-renter tenant base. Strengths: cost of living A+, housing A+, health & safety A+; Watch: crime C-, commute F.
- Cedar Rapids Community School District (urban): math 50% / reading 59% proficiency, ranked #265 of 289 in IA (top 92%) — acceptable for families but not a draw, mixed tenant base, ~2y average lease.
- Zoned schools: Wright Elementary School (math 47% / reading 47%, grade D-, #530 of 616 statewide, top 88%, 295 students, 76% FRL); Harding Middle School (math 61% / reading 69%, grade A-, #154 of 246 statewide, top 63%, 713 students, 43% FRL); George Washington High School (math 44% / reading 62%, grade C-, #296 of 336 statewide, top 88%, 1,291 students, 49% FRL).
- Market conditions: Rents rising fast (+11.0%/yr); 286 active listings in the ZIP; 2 comparable units currently listed for rent nearby; 1,023 units permitted in Linn County in 2024 (456 in 5+ unit buildings).
- This rent runs 33% of the median local income ($73k/yr) — at the standard rent-burdened threshold; future hikes will face affordability resistance.
Forward outlook
- Local home prices are declining (-3.0%/yr); year-one equity from $1k of loan paydown is wiped out by about $6k of value loss. Plan a longer hold.
- Linn County population projected at +16% by 2050 — long-run rental-demand tailwind backs the buy-and-hold thesis.
- At projected returns (-3.0% appreciation + 8.0% rent growth), your $55k cash investment doubles in ~9 years — after that, you're playing with house money.
Negotiation context
- Only 2 days on market — expect competitive offers; lowballing is unlikely to land.
- 2 sale attempts since 4y ago with the ask held roughly flat each time — persistent listings suggest the price (not the market) is what's stuck; bring a comps-based counter.
- Current owner paid $165k; 18% above their basis — modest negotiation headroom, anchor on the comps not their cost.
Risks & watch-outs
- Watch-outs: built in 1958 — expect roof / HVAC / electrical / plumbing capex.
Questions for the listing agent
- Built in 1958 — when were the roof, HVAC, electrical panel, plumbing, and water heater last replaced?
- Is there a deadline driving the sale (1031 exchange, divorce, estate, relocation)? That informs how much negotiation room exists.
- Schools are B-rated — typically a magnet for longer-tenancy family renters. What's the average tenant stay here, and is there a school-zone premium baked into asking?
- What's the average days-on-market for RENTAL listings here right now (not sales)? A rising rental-DOM trend means longer vacancies and softer asking-rent achievability than the comps imply.
- What's the recent tenant-quality profile in this submarket — average credit score on applications, eviction rate, late-payment / NSF rate, and stable-employment percentage? A property-management company in the area should have these aggregated.
- How much new for-sale + rental construction is in the pipeline within 1–3 miles? Heavy new supply typically softens prices + rents 12–24 months out; constrained supply supports both.
Investment metrics
- 1% rule
- 1.05% ✓
- Cap rate
- 8.09%
- Cash-on-cash
- 6.40%
- DSCR
- 1.28
- GRM
- 7.9
CMA / ARV
- ARV (on-the-fly)
- $202,917
- Comps found
- 12
Show comp detail 12 sales within ~0.75 mi
| Address | Dist | Beds/Ba | Sqft | Sold | Price | $/sf | Match |
|---|---|---|---|---|---|---|---|
| 4436 Rushmore Dr Dr NE | 0.18mi | 3/2.0 (-1) | 1,523 (-3%) | 2mo | $210,000 | $138 | 79 |
| 2044 Evergreen St | 0.64mi | 4/2.5 | 1,646 (+5%) | 7mo | $240,000 | $146 | 54 |
| 1101 NE Dover St | 0.50mi | 3/1.0 (-1) | 1,482 (-6%) | 6mo | $160,000 | $108 | 52 |
| 2106 42nd St St NE | 0.64mi | 3/2.0 (-1) | 1,680 (+7%) | 4mo | $175,000 | $104 | 51 |
| 1456 Miami Dr Dr NE | 0.59mi | 3/2.0 (-1) | 1,469 (-7%) | 7mo | $182,500 | $124 | 51 |
| 4432 Regal Ave NE | 0.60mi | 3/1.0 (-1) | 1,677 (+7%) | 4mo | $143,000 | $85 | 49 |
| 1110 Regent St St NE | 0.45mi | 3/1.0 (-1) | 1,377 (-12%) | 1mo | $215,000 | $156 | 48 |
| 4524 Fairlane Dr NE | 0.73mi | 3/1.5 (-1) | 1,643 (+4%) | 9mo | $225,000 | $137 | 44 |
| 1236 Miami Ct NE | 0.65mi | 3/1.0 (-1) | 1,472 (-6%) | 7mo | $175,000 | $119 | 44 |
| 3917 Nancy Jane Ln NE | 0.72mi | 3/2.5 (-1) | 1,391 (-12%) | 1mo | $180,000 | $129 | 39 |
| 1626 Hollywood Blvd Blvd NE | 0.67mi | 3/2.0 (-1) | 1,802 (+15%) | 1mo | $231,000 | $128 | 39 |
| 1611 Hollywood Blvd NE | 0.69mi | 3/2.0 (-1) | 1,377 (-12%) | 5mo | $190,000 | $138 | 38 |
Match score weights: distance 35% · size 25% · config 20% · recency 20%. Top-matched comps best support the ARV.
Projected returns pro-forma
-3.0% appreciation · 8.0% rent growth · sell at horizon
- IRR
- -1.0%
- Equity multiple
- 0.96×
- Total profit
- $-2,226
- Equity at exit
- $29,075
- IRR
- 13.3%
- Equity multiple
- 2.30×
- Total profit
- $71,187
- Equity at exit
- $16,860
Cash invested: $54,600 (down + closing). Projections, not guarantees.
Landlord ↔ Tenant lean methodology
- Overall (STATE)
- 83 Strongly Landlord-Friendly
- State Iowa
- 83 Strongly Landlord-Friendly · R+6
- County
- — inherits STATE
- City
- — inherits STATE
ZIP-level market 52402
- Rents YoY
- 11.0%
- Active inventory
- 286
- Price-to-rent
- 7.9×
Monthly cashflow live
- Estimated rent
- $2,044 medium interval (Pro) →
- Mortgage (P&I)
- −$1,023
- Tax from tax record
- −$220 /mo · $2,638/yr
- Insurance
- −$81
- HOA
- −$0
- Vacancy / Maint / Mgmt
- −$429
- Net cashflow
- $291
Break-even live
UW: 25.0% down · 7.5% · 30yr · 1.5% tax · 5.0% vac · 8.0% maint · 8.0% mgmt
Financing live
Cash to close
- Down payment
- $48,750
- Closing costs
- $5,850
- Reserves months
- —
- Total cash needed
- —
Loan-product check · same deal, 3 products live
Conventional
25% down · 7.5% · 30yr
- Down + closing
- —
- Monthly P&I
- —
- Monthly cashflow
- —
- DSCR
- —
- Eligible?
- —
Personal DTI + credit; lowest rate.
DSCR
20% down · 8.5% · 30yr
- Down + closing
- —
- Monthly P&I
- —
- Monthly cashflow
- —
- DSCR
- —
- Eligible?
- —
No personal income docs; deal must DSCR.
Hard money
10% down · 12.0% · 12mo
- Down + closing
- —
- Monthly P&I
- —
- Monthly cashflow
- —
- DSCR
- —
- Eligible?
- —
Short-term bridge; refi at stabilization.
Rent comps 2 comps
| Address | Beds | Baths | Sqft | Rent | $/sqft | DOM | Units | Dist |
|---|---|---|---|---|---|---|---|---|
| 419 Cimarron Dr Hiawatha, IA | 3.0 | 2.5 | 1680 | $2,650 | $1.58 | 43d | 1 | 1.00mi |
| 1127 34th St NE Cedar Rapids, IA | 3.0 | 2.0 | 1152 | $1,385 | $1.20 | 43d | 1 | 1.07mi |
Listing history 3 events
-
2026-06-05statusdays on market $195,000 Pending 2 DOM
-
2026-06-03remarks 699-char remark
-
2026-06-03$195,000 Active 1 DOM
ⓘ Source: listings_history table (triggers on properties + properties_extension) + one-shot
backfill from property_details.listing_events for pre-trigger history.
Tax reassessment forecast IA · Partial reset (capped growth)
- Current annual tax
- $2,638 · $220/mo
- Projected year-2 tax
- $2,850 · $237/mo
- Expected delta
- +$212/yr (+$18/mo · 8.0%)
ⓘ Screening estimate from a state-policy table — verify with the county assessor before closing.
Climate risk First Street
- Flood 1/10 Low FEMA zone X (unshaded) · 0% chance over 30 yrs
- Wildfire 1/10 Low
- Heat 3/10 Moderate 7 d/yr ≥103°F today · 15 d/yr by 30 yrs out
- Wind 2/10 Low
- Air quality 2/10 Low 0 unhealthy d/yr today · 1 by 30 yrs out
Nearby sold comps map
Loading sold comps map…
Walkable amenities ~0.75 mi
Loading nearby amenities…
Taxation est. · year 1
- Rental income
- $24,531
- − Mortgage interest
- −$10,923
- − Property taxes
- −$2,638
- − Insurance
- −$975
- − Repairs & maintenance
- −$1,962
- − Management
- −$1,962
- − Depreciation
- −$5,673
- Taxable income
- $397
- Est. tax owed @ 24.0%
- −$95
- After-tax cash flow
- $3,400/yr
For passive investors: Depreciation is non-cash, so a rental often shows a tax loss while cash-flowing — sheltering income. Rental losses are passive: they offset passive income freely, and up to $25,000/yr can offset ordinary (W-2) income if you actively participate and your MAGI is under $100k (phasing out to $0 by $150k); unused losses carry forward. On sale, claimed depreciation is recaptured at up to 25%, and gains may owe capital-gains tax (a 1031 exchange can defer both). Figures are a year-1 estimate at your 24.0% rate — not tax advice; consult a CPA.
Schools (NCES district)
- District
- Cedar Rapids Community School District
- NCES district ID
- 1906540
- Math proficiency
- 50% ▼ -12.00%
- Reading proficiency
- 59% ▼ -6.00%
- Median HH income
- $53,568
- Composite
- 46.82/100
- National rank
- #2378
- State rank
- #265 of 289 in IA
Livability — Cedar Rapids
- Score
- 78/100
- State rank
- #134
- US rank
- #2474
Category grades
Schools grade is shown separately in the Schools card above.
Census & demographics
- Census place
- Cedar Rapids, IA
- County
- Linn County · 179,860 people
- City population
- 137,154
- Metro
- Cedar Rapids, IA
- Population (ZIP)
- 42,938
- Household income
- $73,439
- Rent vs Own
- Severe rent burden
- 971.0
Population outlook (Linn County) Hauer SSP2
- Today (2025)
- 239,589 people
- By 2030
- 248,587 · +3.8%
- By 2040
- 264,817 · +10.5%
- By 2050
- 278,685 · +16.3%
- By 2075
- 311,754 · +30.1%
- By 2100
- 336,773 · +40.6%
Race, ethnicity, and origin ACS 2023
- Neighborhood character
- Predominantly White (77%)
- Race & ethnicity
- White 77% Two or more races 7% Black 6% Asian 6% Hispanic / Latino 4%
- Common ancestry
- Portuguese 4% Lithuanian 2% Iranian 2%
- Foreign-born
- 8% · Canada, Philippines, China
- Languages at home
- 89% English-only · Spanish 3% Other Indo-European 3% Other Asian/Pacific 2%
Political lean MEDSL · Linn
- 2024 margin
- Lean D (+9.9) · D 54.2% · R 44.3% · Other 1.4%
- 2008→2024 swing
- -11.6pp toward R · 2008: 21.5pp · 2024: 9.9pp
- All cycles
- 2024: D+9.9 2020: D+13.7 2016: D+9.0 2012: D+17.6 2008: D+21.5
Not yet ingested
- Civics
- —
Market trends
- HPI YoY
- ▼ -133.31%
- Current HPI
- 201.7061
- Rent YoY
- ▲ 10.97%
- Metro
- Cedar Rapids, IA
- State GDP YoY
- ▲ 2.48%
- F500 in state
- 4
Industry mix (Fortune 500 HQ in IA)
| Industry | F500 HQs | Revenue |
|---|---|---|
| Financial Services | 1 | $16B |
|
||
| Retail / Convenience | 1 | $15B |
|
||
Price history
+30.0% since first listed4 events — show timeline
- 2026-06-02 Listed $195,000 CRAAR, CDRMLS
- 2022-05-26 Sold (Public Records) $165,000 Public Records
- 2022-05-24 Sold (MLS) $165,000 CRAAR, CDRMLS
- 2022-04-25 Listed $149,950 CRAAR, CDRMLS
Property tax history
+1.7%/yrLatest (2025): $2,638 · +4.5% YoY. Source: county tax records.
Cash-flow waterfall
monthlySold comps — $/sqft
last 12 mo · ≤1 miLoading sold comps…