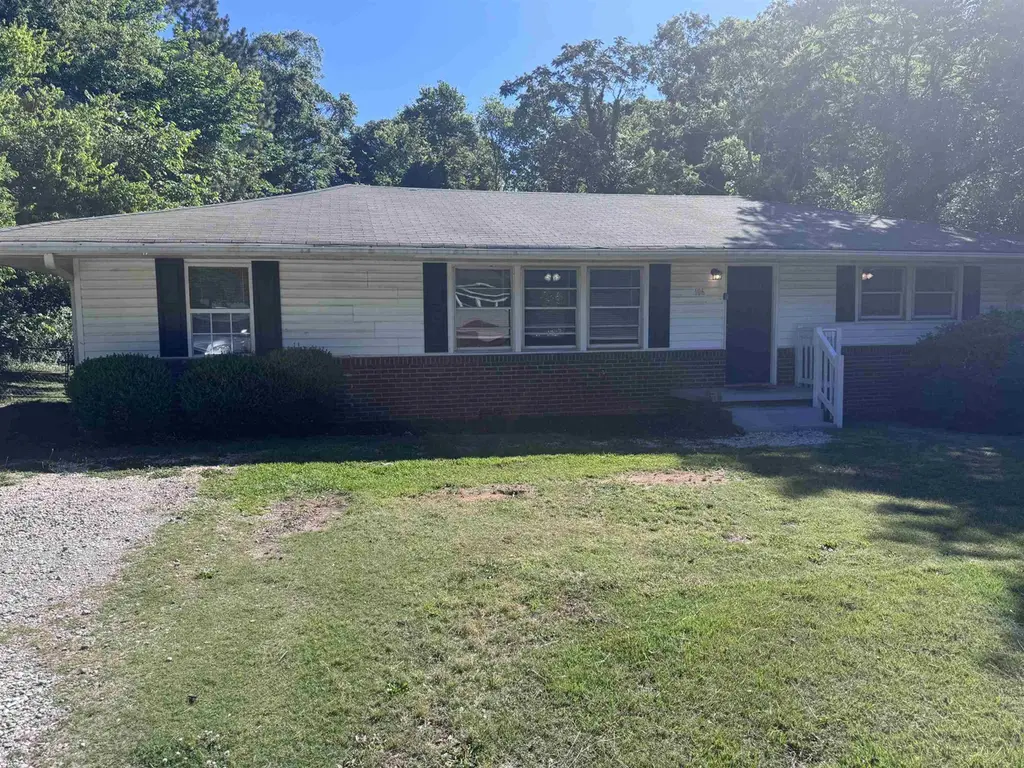
106 Whitener Ave · Spartanburg, SC
Flood risk 1/10 · Minimal
- FEMA flood zone
- X (unshaded)
- Chance of flooding over 30 yrs
- 0.0%
- Est. flood insurance / yr
- $507 – $1,088
Fire risk 3/10 · Minor
- Est. fire insurance / yr
- $783 – $1,453
Heat risk 6/10 · Moderate
- Hot days now (above 105°F)
- 7 days/yr
- Hot days in 30 yrs
- 16 days/yr
Wind risk 2/10 · Minimal
- Chance of severe wind over 30 yrs
- 2.0%
Air-quality risk 4/10 · Minor
- Unhealthy air days now
- 4 days/yr
- Unhealthy air days in 30 yrs
- 4 days/yr
Risk factors via First Street. Map © Google.
Why this score? — see what drove the D+ grade
The composite is a weighted blend of 9 inputs, each scored 0–100. Each bar is that input's sub-score; the figure is the points it added to the 100-point composite (weight × sub-score).
- ARV discount +15.0/15.0
- Cash flow +13.2/30.0
- 1% rule +4.1/10.0
- DSCR +4.0/10.0
- Livability +3.8/5.0
- Rent growth +3.4/5.0
- Schools +3.1/10.0
- Condition / age +2.5/5.0
- Appreciation +0.0/10.0
$164,000
🖨 Deal sheet (PDF) 📄 Offer letter ✓ Due diligence
Listing remarks MLS
This cute 3 bedroom 2 1/2 bath ranch style home is looking for a owner that has a vision . Has original hard wood floors. It's full of potential just needing that touch of love ! A GREAT BUY for a first time home buyer.
Key facts
- Storage building
- Updated kitchen
- Granite countertops
Tags
Property features AI
Exterior
- Parking: Paved parking; On-street parking; Driveway
- Utilities: Public water; Public sewer
- Home design: Single-family residence; One story
- Construction: Brick veneer and vinyl siding; Composition roof
- Exterior features: Patio; Level lot; Lot dimensions approximately 100 x 200; Approximately 0.46 acre lot
Interior
- Kitchen: Range; Dishwasher; Refrigerator
- Bedrooms: 3 main-level bedrooms
- Flooring: Vinyl; Hardwood
- Bathrooms: 1 full bathroom; 1 half bathroom; 1 main-level bathroom
- Heating & cooling: Forced air heating; Central air conditioning
- Interior features: Open floorplan
- Laundry & utility: Washer hookup; Electric dryer hookup; Gas dryer hookup
Neighborhood map
What this means for you Summary
Snapshot
- This is a 3-bed/1.5-bath single-family listed at $164k.
Deal economics
- At list price, monthly cash flow is $-2 ($-19/yr) — negative.
- To cash-flow at today's rent, offer at most $164k (0.2% below list).
- To meet the 1% rule (rent ≥ 1% of price), the offer needs to be $150k (8.7% below list).
- Recommended offer: $150k (8.7% below list) — sets the bar for 1% rule.
- Cap rate 6.3% vs local median 3.9% in Spartanburg — top-decile yield for the area; either an underpriced asset or a hidden risk that comps aren't pricing in. Stress-test before assuming the spread holds.
Location & tenants
- Location reads 76/100 on livability (#24 in SC, #3,679 nationally) — a middle-class / working-renter tenant base. Strengths: amenities A+, commute A+, cost of living A+; Watch: crime F, employment F.
- Spartanburg 07 (urban): math 34% / reading 41% proficiency, ranked #39 of 80 in SC (top 49%) — families likely to look elsewhere, expect single-tenant / working-renter base with shorter leases; 62% free/reduced lunch — lower-income household profile, screen leases tightly.
- Zoned schools: E. P. Todd School (math 18% / reading 29%, grade F, #467 of 597 statewide, top 78%, 576 students, 100% FRL); Spartanburg High (math 67% / reading 79%, grade B+, #44 of 196 statewide, top 23%, 2,056 students, 85% FRL) — zoned schools average 93% FRL vs 62% district-wide (31 pts higher); higher-poverty schools than district average — tighter screening recommended.
- Market conditions: Rents rising (+3.5%/yr); 236 active listings in the ZIP; 11 comparable units currently listed for rent nearby; rentals at typical pace (median 23d on market — plan ~3-4 weeks tenant-placement turnaround); lower-income renter base — watch delinquency; 3,129 units permitted in Spartanburg County in 2024 (40 in 5+ unit buildings).
- This rent runs 43% of the median local income ($41k/yr) — at the standard rent-burdened threshold; future hikes will face affordability resistance.
Forward outlook
- Local home prices are declining (-3.0%/yr); year-one equity from $1k of loan paydown is wiped out by about $5k of value loss. Plan a longer hold.
- Spartanburg County population projected at +18% by 2050 — long-run rental-demand tailwind backs the buy-and-hold thesis.
Negotiation context
- It's been on market 30 days — a 2% lower offer ($162k) is reasonable based on typical stale-listing flexibility.
- 2 sale attempts since 11y ago; this cycle's ask has dropped $10k (6%) from the opening price — seller is motivated, your offer sets the floor, not the list.
- Current owner paid $51k; list at $164k implies a 219% gain — meaningful room to come down on a strong offer.
Risks & watch-outs
- Watch-outs: built in 1956 — expect roof / HVAC / electrical / plumbing capex.
- Climate carrying-cost: extreme-heat days projected 7→16/yr by 2055 (HVAC capex compounding) — expect insurance premiums to compound above CPI over the hold.
Questions for the listing agent
- What do current leases actually rent for vs. the listed asking? Can we see a recent rent roll and the last 12 months of T-12 income?
- Built in 1956 — when were the roof, HVAC, electrical panel, plumbing, and water heater last replaced?
- Is there a deadline driving the sale (1031 exchange, divorce, estate, relocation)? That informs how much negotiation room exists.
- Schools are D-rated, which usually means shorter tenancies and higher turnover. Who's the typical renter profile here, and what's been the actual vacancy rate?
- Crime grade is F in this area — have there been break-ins, vandalism, or insurance claims at this property in the last 3 years? What carrier currently insures it and at what premium?
- The area grade is low — what's the realistic commute time and amenity access for the typical tenant pool here? Any planned neighborhood developments (good or bad) we should know about?
- What's the average days-on-market for RENTAL listings here right now (not sales)? A rising rental-DOM trend means longer vacancies and softer asking-rent achievability than the comps imply.
- What's the recent tenant-quality profile in this submarket — average credit score on applications, eviction rate, late-payment / NSF rate, and stable-employment percentage? A property-management company in the area should have these aggregated.
- How much new for-sale + rental construction is in the pipeline within 1–3 miles? Heavy new supply typically softens prices + rents 12–24 months out; constrained supply supports both.
Investment metrics
- 1% rule
- 0.91% ✗
- Cap rate
- 6.28%
- Cash-on-cash
- -0.04%
- DSCR
- 1.00
- GRM
- 9.1
CMA / ARV
- ARV (on-the-fly)
- $206,700
- Comps found
- 12
Show comp detail 12 sales within ~0.75 mi
| Address | Dist | Beds/Ba | Sqft | Sold | Price | $/sf | Match |
|---|---|---|---|---|---|---|---|
| 524 Caulder Ave | 0.20mi | 3/2.0 | 1,240 (-6%) | 1mo | $252,000 | $203 | 77 |
| 306 Carolyn Dr | 0.17mi | 3/2.5 | 1,364 (+3%) | 7mo | $258,000 | $189 | 77 |
| 207 Woodview Ave | 0.22mi | 3/2.0 | 1,421 (+7%) | 4mo | $189,900 | $134 | 73 |
| 226 Woodview Ave Ave | 0.27mi | 3/2.5 | 1,400 (+6%) | 2mo | $230,000 | $164 | 72 |
| 101 Beth Ct | 0.42mi | 3/1.5 | 1,398 (+6%) | 1mo | $179,000 | $128 | 70 |
| 425 E Shore Dr | 0.54mi | 3/1.5 | 1,320 (-0%) | 6mo | $177,500 | $134 | 70 |
| 207 High St | 0.29mi | 3/2.5 | 1,401 (+6%) | 4mo | $259,000 | $185 | 69 |
| 205 High St | 0.29mi | 3/1.0 | 1,176 (-11%) | 9mo | $135,000 | $115 | 58 |
| 290 Caulder Cir | 0.62mi | 3/3.0 | 1,271 (-4%) | 0mo | $220,000 | $173 | 58 |
| 111 Kreswell Cir | 0.69mi | 3/1.5 | 1,250 (-6%) | 2mo | $147,000 | $118 | 57 |
| 815 S Liberty St | 0.73mi | 3/2.0 | 1,253 (-5%) | 1mo | $195,000 | $156 | 54 |
| 735 Duncan Park Rd | 0.73mi | 2/1.0 (-1) | 1,364 (+3%) | 4mo | $200,000 | $147 | 51 |
Match score weights: distance 35% · size 25% · config 20% · recency 20%. Top-matched comps best support the ARV.
Projected returns pro-forma
-3.0% appreciation · 3.46% rent growth · sell at horizon
- IRR
- -15.8%
- Equity multiple
- 0.44×
- Total profit
- $-25,923
- Equity at exit
- $24,453
- IRR
- -6.5%
- Equity multiple
- 0.57×
- Total profit
- $-19,598
- Equity at exit
- $14,180
Cash invested: $45,920 (down + closing). Projections, not guarantees.
Landlord ↔ Tenant lean methodology
- Overall (STATE)
- 90 Strongly Landlord-Friendly
- State South Carolina
- 90 Strongly Landlord-Friendly · R+6
- County
- — inherits STATE
- City
- — inherits STATE
ZIP-level market 29306
- Home prices YoY
- -29.9%
- Rents YoY
- 3.5%
- Active inventory
- 236
- Price-to-rent
- 9.1×
Monthly cashflow live
- Estimated rent
- $1,497 high interval (Pro) →
- Mortgage (P&I)
- −$860
- Tax from tax record
- −$256 /mo · $3,073/yr
- Insurance
- −$68
- HOA
- −$0
- Vacancy / Maint / Mgmt
- −$314
- Net cashflow
- $-2
Break-even live
Sensitivity live
| Price | -10% $91 | -5% $45 | +0% $-2 | +5% $-48 | +10% $-94 |
|---|---|---|---|---|---|
| Rent | -10% $-120 | -5% $-61 | +0% $-2 | +5% $58 | +10% $117 |
| Rate | -1.0pp $81 | -0.5pp $40 | base $-2 | +0.5pp $-44 | +1.0pp $-87 |
UW: 25.0% down · 7.5% · 30yr · 1.5% tax · 5.0% vac · 8.0% maint · 8.0% mgmt
Financing live
Cash to close
- Down payment
- $41,000
- Closing costs
- $4,920
- Reserves months
- —
- Total cash needed
- —
Loan-product check · same deal, 3 products live
Conventional
25% down · 7.5% · 30yr
- Down + closing
- —
- Monthly P&I
- —
- Monthly cashflow
- —
- DSCR
- —
- Eligible?
- —
Personal DTI + credit; lowest rate.
DSCR
20% down · 8.5% · 30yr
- Down + closing
- —
- Monthly P&I
- —
- Monthly cashflow
- —
- DSCR
- —
- Eligible?
- —
No personal income docs; deal must DSCR.
Hard money
10% down · 12.0% · 12mo
- Down + closing
- —
- Monthly P&I
- —
- Monthly cashflow
- —
- DSCR
- —
- Eligible?
- —
Short-term bridge; refi at stabilization.
Rent comps 11 comps
| Address | Beds | Baths | Sqft | Rent | $/sqft | DOM | Units | Dist |
|---|---|---|---|---|---|---|---|---|
| 235 High St Spartanburg, SC | 3.0 | 1.5 | 1726 | $1,650 | $0.96 | 23d | 1 | 0.38mi |
| 88 W Park Dr Unit H Spartanburg, SC | 2.0 | 1.0 | 950 | $875 | $0.92 | 23d | 1 | 0.56mi |
| 102 Harvard Dr Spartanburg, SC | 2.0 | 1.0 | 1000 | $1,300 | $1.30 | 15d | 1 | 0.75mi |
| 630 S Converse St Spartanburg, SC | 2.0 | 1.0 | 912 | $995 | $1.09 | 23d | 1 | 0.84mi |
| 938 Logan St Unit A Spartanburg, SC | 2.0 | 2.5 | 980 | $1,600 | $1.63 | 23d | 1 | 0.85mi |
| 1097 Union St Spartanburg, SC | 1.0–2.0 | 1.0–2.0 | 951 | $2,009 | $2.11 | 15d | 21 | 0.93mi |
| 249 E Hampton Ave Spartanburg, SC | 3.0 | 2.0 | 1450 | $1,475 | $1.02 | 23d | 1 | 1.08mi |
| 318 Alexander Ave Spartanburg, SC | 4.0 | 2.0 | 1480 | $1,695 | $1.15 | 23d | 1 | 1.09mi |
| 717 Connecticut Ave Spartanburg, SC | 3.0 | 1.0 | 1320 | $1,895 | $1.44 | 15d | 1 | 1.34mi |
| 111 Timothy St Spartanburg, SC | 2.0 | 1.0 | 1100 | $1,600 | $1.45 | 23d | 1 | 1.45mi |
| 334 W Hampton Ave Unit 1 Spartanburg, SC | 2.0 | 1.0 | 895 | $1,100 | $1.23 | 23d | 1 | 1.47mi |
Listing history 19 events
-
2026-06-21pricedays on market $164,000 Active 30 DOM
-
2026-06-18days on market $174,000 Active 27 DOM
-
2026-06-17days on market $174,000 Active 26 DOM
-
2026-06-16days on market $174,000 Active 25 DOM
-
2026-06-15days on market $174,000 Active 24 DOM
-
2026-06-14days on market $174,000 Active 22 DOM
-
2026-06-13days on market $174,000 Active 21 DOM
-
2026-06-10days on market $174,000 Active 19 DOM
-
2026-06-09days on market $174,000 Active 18 DOM
-
2026-06-08days on market $174,000 Active 17 DOM
-
2026-06-07days on market $174,000 Active 16 DOM
-
2026-06-02days on market $174,000 Active 11 DOM
-
2026-06-01days on market $174,000 Active 10 DOM
-
2026-05-31days on market $174,000 Active 9 DOM
-
2026-05-30days on market $174,000 Active 8 DOM
-
2026-05-22$174,000 Active
-
2015-05-22soldstatus $51,333
-
2015-05-15soldstatus $51,333 220-char remark
Show marketing remark (220 chars)
This cute 3 bedroom 2 1/2 bath ranch style home is looking for a owner that has a vision . Has original hard wood floors. It's full of potential just needing that touch of love ! A GREAT BUY for a first time home buyer.
-
2015-04-20$56,333 220-char remark
Show marketing remark (220 chars)
This cute 3 bedroom 2 1/2 bath ranch style home is looking for a owner that has a vision . Has original hard wood floors. It's full of potential just needing that touch of love ! A GREAT BUY for a first time home buyer.
ⓘ Source: listings_history table (triggers on properties + properties_extension) + one-shot
backfill from property_details.listing_events for pre-trigger history.
Tax reassessment forecast SC · Resets to sale price
- Current annual tax
- $3,073 · $256/mo
- Projected year-2 tax
- $3,073 · $256/mo
- Expected delta
- $0/yr ($0/mo · -0.0%)
ⓘ Screening estimate from a state-policy table — verify with the county assessor before closing.
Climate risk First Street
- Flood 1/10 Low FEMA zone X (unshaded) · 0% chance over 30 yrs
- Wildfire 3/10 Moderate
- Heat 6/10 Major 7 d/yr ≥105°F today · 16 d/yr by 30 yrs out
- Wind 2/10 Low 2% chance of damaging wind over 30 yrs
- Air quality 4/10 Moderate 4 unhealthy d/yr today · 4 by 30 yrs out
Nearby sold comps map
Loading sold comps map…
Walkable amenities ~0.75 mi
Loading nearby amenities…
Taxation est. · year 1
- Rental income
- $17,968
- − Mortgage interest
- −$9,187
- − Property taxes
- −$3,073
- − Insurance
- −$820
- − Repairs & maintenance
- −$1,437
- − Management
- −$1,437
- − Depreciation
- −$4,771
- Taxable loss
- −$2,757
- Est. tax savings @ 24.0%
- +$662
- After-tax cash flow
- $643/yr
For passive investors: Depreciation is non-cash, so a rental often shows a tax loss while cash-flowing — sheltering income. Rental losses are passive: they offset passive income freely, and up to $25,000/yr can offset ordinary (W-2) income if you actively participate and your MAGI is under $100k (phasing out to $0 by $150k); unused losses carry forward. On sale, claimed depreciation is recaptured at up to 25%, and gains may owe capital-gains tax (a 1031 exchange can defer both). Figures are a year-1 estimate at your 24.0% rate — not tax advice; consult a CPA.
Schools (NCES district)
- District
- Spartanburg 07
- NCES district ID
- 4503660
- Math proficiency
- 34% ▼ -1.00%
- Reading proficiency
- 41% ▼ -1.00%
- Median HH income
- $35,825
- Composite
- 31.04/100
- National rank
- #6087
- State rank
- #39 of 80 in SC
Livability — Spartanburg
- Score
- 76/100
- State rank
- #24
- US rank
- #3679
Category grades
Schools grade is shown separately in the Schools card above.
Census & demographics
- Census place
- Spartanburg, SC
- County
- Spartanburg County · 258,607 people
- City population
- 120,406
- Metro
- Spartanburg, SC
- Population (ZIP)
- 16,714
- Household income
- $41,356
- Rent vs Own
- Severe rent burden
- 1064.0
Population outlook (Spartanburg County) Hauer SSP2
- Today (2025)
- 325,495 people
- By 2030
- 338,800 · +4.1%
- By 2040
- 363,471 · +11.7%
- By 2050
- 384,156 · +18.0%
- By 2075
- 430,137 · +32.1%
- By 2100
- 442,733 · +36.0%
Race, ethnicity, and origin ACS 2023
- Neighborhood character
- Diverse neighborhood (Simpson 0.61)
- Race & ethnicity
- Black 50% White 36% Hispanic / Latino 10% Two or more races 9% Asian 1%
- Hispanic origin (detail)
- Mexican 7% Puerto Rican 2%
- Common ancestry
- Slovak 1% Serbian 1% Iranian 1%
- Foreign-born
- 7% · Canada
- Languages at home
- 90% English-only · Spanish 7% Other Indo-European 2%
Political lean MEDSL · Spartanburg
- 2024 margin
- Solid R (+33.6) · D 32.6% · R 66.2% · Other 1.2%
- 2008→2024 swing
- -12.0pp toward R · 2008: -21.6pp · 2024: -33.6pp
- All cycles
- 2024: R+33.6 2020: R+27.3 2016: R+30.0 2012: R+23.1 2008: R+21.6
Not yet ingested
- Civics
- —
Market trends
- HPI YoY
- ▼ -90.67%
- Current HPI
- 213.1266
- Rent YoY
- ▲ 3.46%
- Metro
- Spartanburg, SC
- State GDP YoY
- ▲ 4.51%
- F500 in state
- 2
Industry mix (Fortune 500 HQ in SC)
| Industry | F500 HQs | Revenue |
|---|---|---|
| Packaging | 1 | $7B |
|
||
Price history
+208.9% since first listed4 events — show timeline
- 2026-05-22 Listed $174,000 SPMLS
- 2015-05-22 Sold (Public Records) $51,333 Public Records
- 2015-05-15 Sold (MLS) $51,333 SPMLS
- 2015-04-20 Listed $56,333 SPMLS
Property tax history
+23.7%/yrLatest (2025): $3,073 · +43.0% YoY. Source: county tax records.
Cash-flow waterfall
monthlySold comps — $/sqft
last 12 mo · ≤1 miLoading sold comps…