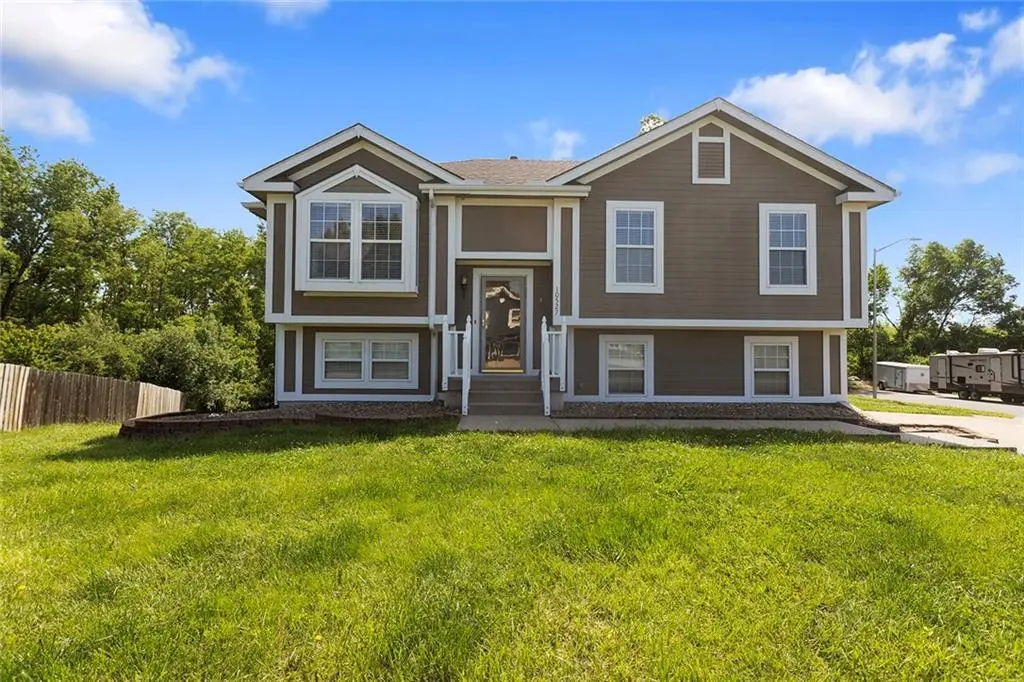
10527 N Ditman Ave · Kansas City, MO
Flood risk 1/10 · Minimal
- FEMA flood zone
- X (unshaded)
- Chance of flooding over 30 yrs
- 0.0%
- Est. flood insurance / yr
- $473 – $860
Fire risk 4/10 · Minor
- Est. fire insurance / yr
- $1,054 – $1,958
Heat risk 4/10 · Minor
- Hot days now (above 105°F)
- 7 days/yr
- Hot days in 30 yrs
- 17 days/yr
Wind risk 2/10 · Minimal
- Chance of severe wind over 30 yrs
- —
Air-quality risk 3/10 · Minor
- Unhealthy air days now
- 3 days/yr
- Unhealthy air days in 30 yrs
- 4 days/yr
Risk factors via First Street. Map © Google.
Why this score? — see what drove the D- grade
The composite is a weighted blend of 9 inputs, each scored 0–100. Each bar is that input's sub-score; the figure is the points it added to the 100-point composite (weight × sub-score).
- Cash flow +10.6/30.0
- ARV discount +7.3/15.0
- Rent growth +4.9/5.0
- Schools +4.5/10.0
- Livability +3.9/5.0
- DSCR +3.0/10.0
- 1% rule +2.6/10.0
- Condition / age +2.5/5.0
- Appreciation +0.0/10.0
$330,000
🖨 Deal sheet 📄 Offer letter ✓ Due diligence
Listing remarks MLS
Private Office Listing. Home needed significant repairs/updating. Beautiful corner lot with large backyard and green space.
Key facts
- 0.36 acre lot
- 2 garage spots
- Built 1999
Property features AI
Finance
- Other: Back flow device installed; Not located in a flood plain
Exterior
- Parking: Attached garage with garage door opener (garage faces side); 2-car garage
- Security: Smoke detector(s)
- Utilities: Public water; Public sewer; Cable available
- Home design: Single family residence; Residential property; Split entry; Frame construction; Composition roof; Approximately 21–30 years old; Above-grade and below-grade finished areas (per public records)
- Construction: Frame construction; Composition roof; Full concrete basement with walk-out access
- Exterior features: Deck; Shed(s); Corner lot; Adjoins greenspace; Level lot; Paved road with public maintenance
Interior
- Kitchen: Kitchen with dining combo; Electric range; Garbage disposal
- Bedrooms: 3 bedrooms (all on the first level)
- Flooring: Carpet; Laminate
- Bathrooms: 2 full bathrooms
- Heating & cooling: Natural gas heating with forced air; Electric cooling
- Interior features: Ceiling fans; Vaulted ceilings; Window coverings; Skylights; Split entry floor plan
- Laundry & utility: Laundry on lower level
Neighborhood map
What this means for you Summary
Snapshot
- This is a 3-bed/2.0-bath single-family listed at $330k.
Deal economics
- At list price, monthly cash flow is $-166 ($-2k/yr) — negative.
- To cash-flow at today's rent, offer at most $301k (8.9% below list).
- To meet the 1% rule (rent ≥ 1% of price), the offer needs to be $250k (24.4% below list).
- Recommended offer: $250k (24.4% below list) — sets the bar for 1% rule.
- Cap rate 5.7% vs local median 3.9% in Kansas City — top-decile yield for the area; either an underpriced asset or a hidden risk that comps aren't pricing in. Stress-test before assuming the spread holds.
Location & tenants
- Location reads 78/100 on livability (#28 in MO, #2,671 nationally) — a middle-class / working-renter tenant base. Strengths: amenities A+, commute A+, cost of living A+; Watch: crime F.
- Liberty 53 (suburban): math 41% / reading 59% proficiency, ranked #24 of 324 in MO (top 7%) — acceptable for families but not a draw, mixed tenant base, ~2y average lease; only 15% free/reduced lunch — higher-income household profile.
- Zoned schools: Liberty North High School (math 25% / reading 75%, grade D+, #116 of 521 statewide, top 22%, 2,326 students, 18% FRL) — zoned schools at 18% FRL track the district average.
- Market conditions: Rents rising fast (+9.5%/yr); 240 active listings in the ZIP; high-income renter base; 341 units permitted in Clay County in 2024 (40 in 5+ unit buildings).
Forward outlook
- Local home prices are declining (-3.0%/yr); year-one equity from $2k of loan paydown is wiped out by about $10k of value loss. Plan a longer hold.
- Clay County population projected at +24% by 2050 — long-run rental-demand tailwind backs the buy-and-hold thesis.
Negotiation context
- Only 4 days on market — expect competitive offers; lowballing is unlikely to land.
- 3 sale attempts since 24y ago with the ask held roughly flat each time — persistent listings suggest the price (not the market) is what's stuck; bring a comps-based counter.
Questions for the listing agent
- What do current leases actually rent for vs. the listed asking? Can we see a recent rent roll and the last 12 months of T-12 income?
- Is there a deadline driving the sale (1031 exchange, divorce, estate, relocation)? That informs how much negotiation room exists.
- Crime grade is F in this area — have there been break-ins, vandalism, or insurance claims at this property in the last 3 years? What carrier currently insures it and at what premium?
- The area grade is low — what's the realistic commute time and amenity access for the typical tenant pool here? Any planned neighborhood developments (good or bad) we should know about?
- What's the average days-on-market for RENTAL listings here right now (not sales)? A rising rental-DOM trend means longer vacancies and softer asking-rent achievability than the comps imply.
- What's the recent tenant-quality profile in this submarket — average credit score on applications, eviction rate, late-payment / NSF rate, and stable-employment percentage? A property-management company in the area should have these aggregated.
- How much new for-sale + rental construction is in the pipeline within 1–3 miles? Heavy new supply typically softens prices + rents 12–24 months out; constrained supply supports both.
Investment metrics
- 1% rule
- 0.76% ✗
- Cap rate
- 5.69%
- Cash-on-cash
- -2.15%
- DSCR
- 0.90
- GRM
- 11.0
CMA / ARV
- ARV (median comp)
- $328,565
- List price
- $330,000
- Delta
- 0.44%
- Verdict
- FAIR
- Comps
- 20 within 1.0 mi
Show comp detail 2 sales within ~0.75 mi
| Address | Dist | Beds/Ba | Sqft | Sold | Price | $/sf | Match |
|---|---|---|---|---|---|---|---|
| 11009 N Lewis Ave | 0.45mi | 3/2.0 | 1,150 (+11%) | 9mo | $145,000 | $126 | 54 |
| 9038 NE 103rd Ter | 0.52mi | 2/2.0 (-1) | 1,176 (+13%) | 16mo | $299,900 | $255 | 36 |
Match score weights: distance 35% · size 25% · config 20% · recency 20%. Top-matched comps best support the ARV.
Projected returns pro-forma
-3.0% appreciation · 8.0% rent growth · sell at horizon
- IRR
- -14.8%
- Equity multiple
- 0.45×
- Total profit
- $-50,894
- Equity at exit
- $49,204
- IRR
- 0.2%
- Equity multiple
- 1.02×
- Total profit
- $1,922
- Equity at exit
- $28,532
Cash invested: $92,400 (down + closing). Projections, not guarantees.
Landlord ↔ Tenant lean methodology
- Overall (STATE)
- 81 Strongly Landlord-Friendly
- State Missouri
- 81 Strongly Landlord-Friendly · R+10
- County
- — inherits STATE
- City
- — inherits STATE
ZIP-level market 64157
- Home prices YoY
- -18.1%
- Rents YoY
- 9.5%
- Active inventory
- 240
- Price-to-rent
- 11.0×
Monthly cashflow live
- Estimated rent
- $2,496 medium interval (Pro) →
- Mortgage (P&I)
- −$1,731
- Tax from tax record
- −$270 /mo · $3,238/yr
- Insurance
- −$138
- HOA
- −$0
- Vacancy / Maint / Mgmt
- −$524
- Net cashflow
- $-166
Break-even live
UW: 25.0% down · 7.5% · 30yr · 1.5% tax · 5.0% vac · 8.0% maint · 8.0% mgmt
Financing live
Cash to close
- Down payment
- $82,500
- Closing costs
- $9,900
- Reserves months
- —
- Total cash needed
- —
Loan-product check · same deal, 3 products live
Conventional
25% down · 7.5% · 30yr
- Down + closing
- —
- Monthly P&I
- —
- Monthly cashflow
- —
- DSCR
- —
- Eligible?
- —
Personal DTI + credit; lowest rate.
DSCR
20% down · 8.5% · 30yr
- Down + closing
- —
- Monthly P&I
- —
- Monthly cashflow
- —
- DSCR
- —
- Eligible?
- —
No personal income docs; deal must DSCR.
Hard money
10% down · 12.0% · 12mo
- Down + closing
- —
- Monthly P&I
- —
- Monthly cashflow
- —
- DSCR
- —
- Eligible?
- —
Short-term bridge; refi at stabilization.
Listing history 7 events
-
2026-04-23historical $330,000 758-char remark
-
2023-01-10status Pending 123-char remark
Show marketing remark (123 chars)
Private Office Listing. Home needed significant repairs/updating. Beautiful corner lot with large backyard and green space.
-
2023-01-10soldstatus
Show marketing remark (123 chars)
Private Office Listing. Home needed significant repairs/updating. Beautiful corner lot with large backyard and green space.
-
2023-01-09soldstatus Closed 123-char remark
Show marketing remark (123 chars)
Private Office Listing. Home needed significant repairs/updating. Beautiful corner lot with large backyard and green space.
-
2023-01-09$235,000 Active 123-char remark
Show marketing remark (123 chars)
Private Office Listing. Home needed significant repairs/updating. Beautiful corner lot with large backyard and green space.
-
2002-08-29soldstatus
Show marketing remark (310 chars)
PC4007Seller's Father was the builder and he put tons of upgrades in, columns in entryway, vaulted ceilings in mstr bdr, great rm, kit. & hall bath. Elegant Mstr bath w/ dbl sink vanity, plant ledge & skylight! Indirect lighting in mstr bdr! Walk-out bsmt sheetrocked ready for paint & carpet!
-
2002-07-28$124,950
Show marketing remark (310 chars)
PC4007Seller's Father was the builder and he put tons of upgrades in, columns in entryway, vaulted ceilings in mstr bdr, great rm, kit. & hall bath. Elegant Mstr bath w/ dbl sink vanity, plant ledge & skylight! Indirect lighting in mstr bdr! Walk-out bsmt sheetrocked ready for paint & carpet!
ⓘ Source: listings_history table (triggers on properties + properties_extension) + one-shot
backfill from property_details.listing_events for pre-trigger history.
Tax reassessment forecast MO · Resets to sale price
- Current annual tax
- $3,238 · $270/mo
- Projected year-2 tax
- $3,238 · $270/mo
- Expected delta
- $0/yr ($0/mo · -0.0%)
ⓘ Screening estimate from a state-policy table — verify with the county assessor before closing.
Climate risk First Street
- Flood 1/10 Low FEMA zone X (unshaded) · 0% chance over 30 yrs
- Wildfire 4/10 Moderate
- Heat 4/10 Moderate 7 d/yr ≥105°F today · 17 d/yr by 30 yrs out
- Wind 2/10 Low
- Air quality 3/10 Moderate 3 unhealthy d/yr today · 4 by 30 yrs out
Nearby sold comps map
Loading sold comps map…
Walkable amenities ~0.75 mi
Loading nearby amenities…
Taxation est. · year 1
- Rental income
- $29,955
- − Mortgage interest
- −$18,485
- − Property taxes
- −$3,238
- − Insurance
- −$1,650
- − Repairs & maintenance
- −$2,396
- − Management
- −$2,396
- − Depreciation
- −$9,600
- Taxable loss
- −$7,811
- Est. tax savings @ 24.0%
- +$1,875
- After-tax cash flow
- $-116/yr
For passive investors: Depreciation is non-cash, so a rental often shows a tax loss while cash-flowing — sheltering income. Rental losses are passive: they offset passive income freely, and up to $25,000/yr can offset ordinary (W-2) income if you actively participate and your MAGI is under $100k (phasing out to $0 by $150k); unused losses carry forward. On sale, claimed depreciation is recaptured at up to 25%, and gains may owe capital-gains tax (a 1031 exchange can defer both). Figures are a year-1 estimate at your 24.0% rate — not tax advice; consult a CPA.
Schools (NCES district)
- District
- Liberty 53
- NCES district ID
- 2918540
- Math proficiency
- 41% ▼ -9.00%
- Reading proficiency
- 59% ▼ -3.00%
- Median HH income
- $78,226
- Composite
- 45.41/100
- National rank
- #2624
- State rank
- #24 of 324 in MO
Livability — Kansas City
- Score
- 78/100
- State rank
- #28
- US rank
- #2671
Category grades
Schools grade is shown separately in the Schools card above.
Census & demographics
- Census place
- Kansas City, MO
- County
- Clay County · 220,651 people
- City population
- 439,467
- Metro
- Kansas City, MO-KS
- Population (ZIP)
- 23,030
- Household income
- $149,526
- Rent vs Own
- Severe rent burden
- 87.0
Population outlook (Clay County) Hauer SSP2
- Today (2025)
- 266,022 people
- By 2030
- 280,057 · +5.3%
- By 2040
- 306,153 · +15.1%
- By 2050
- 328,630 · +23.5%
- By 2075
- 375,182 · +41.0%
- By 2100
- 392,861 · +47.7%
Race, ethnicity, and origin ACS 2023
- Neighborhood character
- Predominantly White (82%)
- Race & ethnicity
- White 82% Asian 7% Two or more races 6% Hispanic / Latino 5% Black 3%
- Common ancestry
- Slovak 3% Italian 2% Lithuanian 2%
- Foreign-born
- 6% · Canada, Vietnam, China
- Languages at home
- 92% English-only · Spanish 3% Other Asian/Pacific 2% Vietnamese 1%
Political lean MEDSL · Clay
- 2024 margin
- Lean R (+5.6) · D 46.4% · R 52.0% · Other 1.6%
- 2008→2024 swing
- -4.9pp toward R · 2008: -0.7pp · 2024: -5.6pp
- All cycles
- 2024: R+5.6 2020: R+4.1 2016: R+11.1 2012: R+8.4 2008: R+0.7
Not yet ingested
- Civics
- —
Market trends
- HPI YoY
- ▼ -43.38%
- Current HPI
- 195.9921
- Rent YoY
- ▲ 9.50%
- Metro
- Kansas City, MO-KS
- State GDP YoY
- ▲ 1.84%
- F500 in state
- 20
Industry mix (Fortune 500 HQ in MO)
| Industry | F500 HQs | Revenue |
|---|---|---|
| Healthcare | 1 | $163B |
|
||
| Insurance | 1 | $21B |
|
||
| Industrial Technology | 1 | $17B |
|
||
| Retail | 1 | $16B |
|
||
| Industrial Distribution | 1 | $10B |
|
||
| Utilities | 1 | $9B |
|
||
Price history
+164.1% since first listed9 events — show timeline
- 2026-05-25 Pending — Heartland MLS as Distributed by MLS Grid
- 2026-05-22 Listed $330,000 Heartland MLS as Distributed by MLS Grid
- 2026-04-23 Coming Soon $330,000 Heartland MLS as Distributed by MLS Grid
- 2023-01-10 Pending — Heartland MLS as Distributed by MLS Grid
- 2023-01-10 Sold (Public Records) — Public Records
- 2023-01-09 Listed $235,000 Heartland MLS as Distributed by MLS Grid
- 2023-01-09 Sold (MLS) — Heartland MLS as Distributed by MLS Grid
- 2002-08-29 Sold (MLS) — Heartland MLS as Distributed by MLS Grid
- 2002-07-28 Listed $124,950 Heartland MLS as Distributed by MLS Grid
Property tax history
+4.2%/yrLatest (2025): $3,238 · +12.6% YoY. Source: county tax records.
Cash-flow waterfall
monthlySold comps — $/sqft
last 12 mo · ≤1 miLoading sold comps…