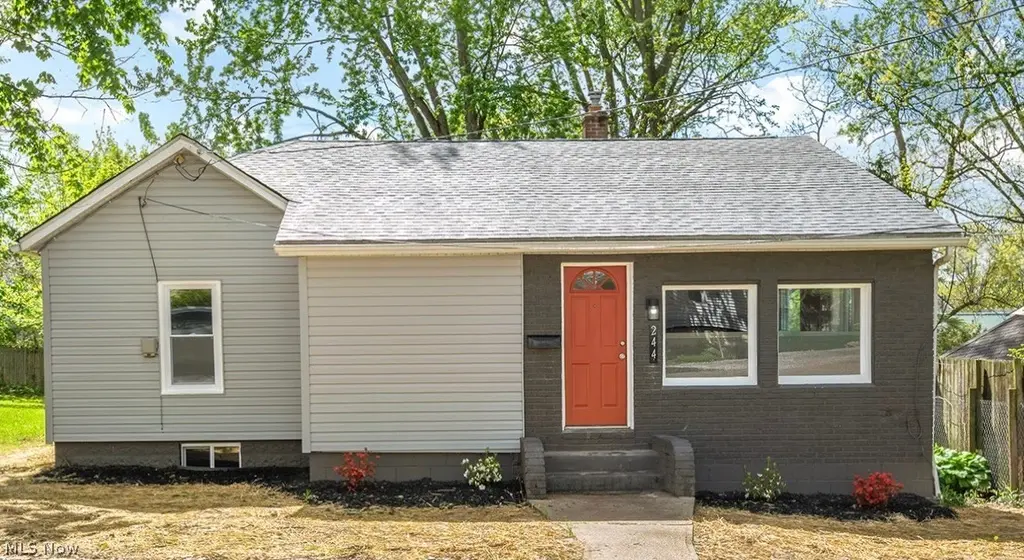
244 Keenan Ave · Cuyahoga Falls, OH
Flood risk 1/10 · Minimal
- FEMA flood zone
- X (unshaded)
- Chance of flooding over 30 yrs
- 0.0%
- Est. flood insurance / yr
- $473 – $860
Fire risk 1/10 · Minimal
- Est. fire insurance / yr
- $713 – $1,323
Heat risk 3/10 · Minor
- Hot days now (above 98°F)
- 7 days/yr
- Hot days in 30 yrs
- 17 days/yr
Wind risk 1/10 · Minimal
- Chance of severe wind over 30 yrs
- —
Air-quality risk 3/10 · Minor
- Unhealthy air days now
- 2 days/yr
- Unhealthy air days in 30 yrs
- 4 days/yr
Risk factors via First Street. Map © Google.
Why this score? — see what drove the D+ grade
The composite is a weighted blend of 9 inputs, each scored 0–100. Each bar is that input's sub-score; the figure is the points it added to the 100-point composite (weight × sub-score).
- Cash flow +12.8/30.0
- ARV discount +11.1/15.0
- Schools +4.5/10.0
- Rent growth +4.2/5.0
- Livability +4.2/5.0
- DSCR +3.8/10.0
- 1% rule +3.0/10.0
- Condition / age +2.5/5.0
- Appreciation +0.0/10.0
$174,900
🖨 Deal sheet 📄 Offer letter ✓ Due diligence
Listing remarks
Step into the character and warmth of this beautifully refreshed, 2-bedroom, brick and vinyl Ranch. Perfectly situated in the heart of Cuyahoga Falls, the expansive open-concept living area features a living room with a loft and soaring cathedral ceilings, anchored by a sleek, oversized modern fan that perfectly bridges architectural drama with comfort. Large windows fill the space with natural light, highlighting the fresh updates throughout. The chef-ready kitchen boasts tile backsplash, and brand-new (2026) stainless steel appliances (including a gas range). Storage is a breeze with a main bedroom walk-in closet, foyer closets, kitchen pantry, and full basement. Outside, discover a rare
Key facts
- Chef-ready kitchen
- Three-parcel yard
- Newer hvac
Tags
Property features AI
Exterior
- Parking: Off-street parking; Oversized aggregate parking area
- Utilities: Public water; Public sewer
- Home design: Single-story home; Updated/remodeled condition; Entry and main living on first (only) level; Asphalt roof
- Construction: Brick and vinyl siding exterior; Built (year source: public records); Block foundation
- Exterior features: Private yard; Back yard; Front yard; Few trees; Located on a cul-de-sac; Privacy fencing in backyard (wood)
Interior
- Kitchen: Dishwasher; Microwave; Range; Pantry; Laminate counters; Cathedral ceiling in kitchen
- Bedrooms: Two main-level bedrooms; Bedrooms feature carpet flooring; One bedroom includes a walk-in closet
- Flooring: Carpet in bedrooms; Concrete flooring in basement areas
- Bathrooms: One full bathroom on the main level
- Heating & cooling: Forced air heating; Central air conditioning; Ceiling fans for additional cooling
- Interior features: Ceiling fan(s); Cathedral ceilings; Open floorplan; Pantry; Storage; Walk-in closet(s); Laminate counters
- Laundry & utility: Main-level laundry
Neighborhood map
What this means for you Summary
Snapshot
- This is a 3-bed/1.0-bath single-family listed at $175k.
Deal economics
- At list price, monthly cash flow is $-16 ($-186/yr) — negative.
- To cash-flow at today's rent, offer at most $172k (1.6% below list).
- To meet the 1% rule (rent ≥ 1% of price), the offer needs to be $140k (19.8% below list).
- Recommended offer: $140k (19.8% below list) — sets the bar for 1% rule.
- Cap rate 6.2% vs local median 4.6% in Cuyahoga Falls — top-decile yield for the area; either an underpriced asset or a hidden risk that comps aren't pricing in. Stress-test before assuming the spread holds.
Location & tenants
- Location reads 83/100 on livability (#60 in OH, #870 nationally) — a professional / high-income tenant draw. Strengths: cost of living A+, housing A+, health & safety A+; Watch: commute F.
- Cuyahoga Falls City (suburban): math 47% / reading 58% proficiency, ranked #408 of 656 in OH (top 62%) — acceptable for families but not a draw, mixed tenant base, ~2y average lease.
- Market conditions: Rents rising fast (+7.0%/yr); 90 active listings in the ZIP; 10 comparable units currently listed for rent nearby; rentals at typical pace (median 23d on market — plan ~3-4 weeks tenant-placement turnaround); 1,114 units permitted in Summit County in 2024 (397 in 5+ unit buildings).
Forward outlook
- Local home prices are declining (-3.0%/yr); year-one equity from $1k of loan paydown is wiped out by about $5k of value loss. Plan a longer hold.
- Summit County population projected to shrink 6% by 2050 — rents likely to lag national; underwrite the cash flow, not the appreciation.
Negotiation context
- It's been on market 34 days — a 3% lower offer ($170k) is reasonable based on typical stale-listing flexibility.
- 2 sale attempts with the ask held roughly flat each time — persistent listings suggest the price (not the market) is what's stuck; bring a comps-based counter.
Risks & watch-outs
- Watch-outs: built in 1900 — expect roof / HVAC / electrical / plumbing capex.
Questions for the listing agent
- What do current leases actually rent for vs. the listed asking? Can we see a recent rent roll and the last 12 months of T-12 income?
- It's been on market 34 days. Have you received any prior offers? Is the seller open to a 20% concession, seller financing, or rate buy-down credit?
- Built in 1900 — when were the roof, HVAC, electrical panel, plumbing, and water heater last replaced?
- Is there a deadline driving the sale (1031 exchange, divorce, estate, relocation)? That informs how much negotiation room exists.
- Schools are A-rated — typically a magnet for longer-tenancy family renters. What's the average tenant stay here, and is there a school-zone premium baked into asking?
- The area grade is low — what's the realistic commute time and amenity access for the typical tenant pool here? Any planned neighborhood developments (good or bad) we should know about?
- What's the average days-on-market for RENTAL listings here right now (not sales)? A rising rental-DOM trend means longer vacancies and softer asking-rent achievability than the comps imply.
- What's the recent tenant-quality profile in this submarket — average credit score on applications, eviction rate, late-payment / NSF rate, and stable-employment percentage? A property-management company in the area should have these aggregated.
- How much new for-sale + rental construction is in the pipeline within 1–3 miles? Heavy new supply typically softens prices + rents 12–24 months out; constrained supply supports both.
Investment metrics
- 1% rule
- 0.80% ✗
- Cap rate
- 6.19%
- Cash-on-cash
- -0.38%
- DSCR
- 0.98
- GRM
- 10.4
CMA / ARV
- ARV (median comp)
- $189,890
- List price
- $174,900
- Delta
- -7.89%
- Verdict
- FAIR
- Comps
- 20 within 1.0 mi
Show comp detail 12 sales within ~0.75 mi
| Address | Dist | Beds/Ba | Sqft | Sold | Price | $/sf | Match |
|---|---|---|---|---|---|---|---|
| 2747 3rd St | 0.29mi | 3/2.0 | 965 (+1%) | 0mo | $145,900 | $151 | 80 |
| 2834 Norwood St | 0.07mi | 2/1.0 (-1) | 1,008 (+5%) | 4mo | $199,900 | $198 | 79 |
| 244 Keenan Ave | 0.00mi | 2/1.0 (-1) | 1,064 (+11%) | 0mo | $171,500 | $161 | 76 |
| 212 Marguerite Ave | 0.13mi | 2/1.5 (-1) | 1,056 (+10%) | 2mo | $209,000 | $198 | 68 |
| 125 Adams Ave | 0.49mi | 3/1.0 | 1,019 (+7%) | 1mo | $164,000 | $161 | 65 |
| 2824 Fairview Pl | 0.55mi | 3/1.0 | 1,008 (+5%) | 2mo | $240,000 | $238 | 64 |
| 318 Van Buren Ave | 0.65mi | 3/1.0 | 1,008 (+5%) | 1mo | $220,000 | $218 | 60 |
| 2685 Northland St | 0.32mi | 2/1.5 (-1) | 1,064 (+11%) | 8mo | $175,000 | $164 | 52 |
| 236 Tyler Ave | 0.64mi | 2/2.0 (-1) | 1,008 (+5%) | 2mo | $175,000 | $174 | 51 |
| 119 Alameda Ave | 0.54mi | 3/1.0 | 1,092 (+14%) | 2mo | $260,000 | $238 | 50 |
| 312 Linwood St | 0.50mi | 2/2.0 (-1) | 825 (-14%) | 1mo | $189,500 | $230 | 44 |
| 3320 Hudson Dr | 0.64mi | 2/2.0 (-1) | 864 (-10%) | 2mo | $200,000 | $231 | 43 |
Match score weights: distance 35% · size 25% · config 20% · recency 20%. Top-matched comps best support the ARV.
Projected returns pro-forma
-3.0% appreciation · 6.95% rent growth · sell at horizon
- IRR
- -12.9%
- Equity multiple
- 0.52×
- Total profit
- $-23,562
- Equity at exit
- $26,078
- IRR
- 1.0%
- Equity multiple
- 1.08×
- Total profit
- $3,899
- Equity at exit
- $15,122
Cash invested: $48,972 (down + closing). Projections, not guarantees.
Landlord ↔ Tenant lean methodology
- Overall (STATE)
- 73 Landlord-Friendly
- State Ohio
- 73 Landlord-Friendly · R+6
- County
- — inherits STATE
- City
- — inherits STATE
ZIP-level market 44221
- Rents YoY
- 7.0%
- Active inventory
- 90
- Price-to-rent
- 10.4×
Monthly cashflow live
- Estimated rent
- $1,403 high interval (Pro) →
- Mortgage (P&I)
- −$917
- Tax from tax record
- −$134 /mo · $1,609/yr
- Insurance
- −$73
- HOA
- −$0
- Vacancy / Maint / Mgmt
- −$295
- Net cashflow
- $-16
Break-even live
UW: 25.0% down · 7.5% · 30yr · 1.5% tax · 5.0% vac · 8.0% maint · 8.0% mgmt
Financing live
Cash to close
- Down payment
- $43,725
- Closing costs
- $5,247
- Reserves months
- —
- Total cash needed
- —
Loan-product check · same deal, 3 products live
Conventional
25% down · 7.5% · 30yr
- Down + closing
- —
- Monthly P&I
- —
- Monthly cashflow
- —
- DSCR
- —
- Eligible?
- —
Personal DTI + credit; lowest rate.
DSCR
20% down · 8.5% · 30yr
- Down + closing
- —
- Monthly P&I
- —
- Monthly cashflow
- —
- DSCR
- —
- Eligible?
- —
No personal income docs; deal must DSCR.
Hard money
10% down · 12.0% · 12mo
- Down + closing
- —
- Monthly P&I
- —
- Monthly cashflow
- —
- DSCR
- —
- Eligible?
- —
Short-term bridge; refi at stabilization.
Rent comps 10 comps
| Address | Beds | Baths | Sqft | Rent | $/sqft | DOM | Units | Dist |
|---|---|---|---|---|---|---|---|---|
| 430 Keenan Ave Cuyahoga Falls, OH | 3.0 | 1.0 | 1104 | $1,325 | $1.20 | 14d | 1 | 0.09mi |
| 2876 Hudson Dr Unit A Cuyahoga Falls, OH | 2.0 | 1.0 | 900 | $1,150 | $1.28 | 23d | 1 | 0.23mi |
| 2876 Hudson Dr Unit A Cuyahoga Falls, OH | 2.0 | 1.0 | 900 | $1,150 | $1.28 | 14d | 1 | 0.23mi |
| 113 Madison Ave Unit 1496128P Cuyahoga Falls, OH | 3.0 | 1.5 | 1065 | $4,259 | $4.00 | 13d | 1 | 0.50mi |
| 2940 6th St Unit 4 Cuyahoga Falls, OH | 2.0 | 1.0 | 825 | $900 | $1.09 | 43d | 1 | 0.58mi |
| 513 Center Ave Cuyahoga Falls, OH | 2.0 | 1.0 | 587 | $964 | $1.64 | 23d | 2 | 0.88mi |
| 2220 High St Cuyahoga Falls, OH | 1.0–2.0 | 1.0–2.0 | 870 | $1,215 | $1.40 | 13d | 1 | 0.94mi |
| 1737 Portage Trl Cuyahoga Falls, OH | 2.0 | 1.0 | 806 | $900 | $1.12 | 23d | 1 | 1.32mi |
| 1747 Portage Trl Unit 4 Cuyahoga Falls, OH | 2.0 | 1.0 | 806 | $1,100 | $1.36 | 14d | 1 | 1.33mi |
| 1975 Tudor St Cuyahoga Falls, OH | 3.0 | 1.0 | 1120 | $1,475 | $1.32 | 43d | 1 | 1.38mi |
Listing history 11 events
-
2026-06-07statusdays on market $174,900 Pending 34 DOM
-
2026-06-05days on market $174,900 Contingent 32 DOM
-
2026-06-03days on market $174,900 Contingent 31 DOM
-
2026-06-02days on market $174,900 Contingent 30 DOM
-
2026-06-01days on market $174,900 Contingent 29 DOM
-
2026-05-31days on market $174,900 Contingent 28 DOM
-
2026-05-31days on market $174,900 Contingent 27 DOM
-
2026-05-10historical Contingent 1296-char remark
-
2026-05-04status Active 1296-char remark
-
2026-05-01$174,900 Active 1296-char remark
-
2026-01-23soldstatus $52,240
ⓘ Source: listings_history table (triggers on properties + properties_extension) + one-shot
backfill from property_details.listing_events for pre-trigger history.
Tax reassessment forecast OH · Partial reset (capped growth)
- Current annual tax
- $1,609 · $134/mo
- Projected year-2 tax
- $2,168 · $181/mo
- Expected delta
- +$560/yr (+$47/mo · 34.8%)
ⓘ Screening estimate from a state-policy table — verify with the county assessor before closing.
Climate risk First Street
- Flood 1/10 Low FEMA zone X (unshaded) · 0% chance over 30 yrs
- Wildfire 1/10 Low
- Heat 3/10 Moderate 7 d/yr ≥98°F today · 17 d/yr by 30 yrs out
- Wind 1/10 Low
- Air quality 3/10 Moderate 2 unhealthy d/yr today · 4 by 30 yrs out
Nearby sold comps map
Loading sold comps map…
Walkable amenities ~0.75 mi
Loading nearby amenities…
Taxation est. · year 1
- Rental income
- $16,839
- − Mortgage interest
- −$9,797
- − Property taxes
- −$1,609
- − Insurance
- −$874
- − Repairs & maintenance
- −$1,347
- − Management
- −$1,347
- − Depreciation
- −$5,088
- Taxable loss
- −$3,223
- Est. tax savings @ 24.0%
- +$774
- After-tax cash flow
- $587/yr
For passive investors: Depreciation is non-cash, so a rental often shows a tax loss while cash-flowing — sheltering income. Rental losses are passive: they offset passive income freely, and up to $25,000/yr can offset ordinary (W-2) income if you actively participate and your MAGI is under $100k (phasing out to $0 by $150k); unused losses carry forward. On sale, claimed depreciation is recaptured at up to 25%, and gains may owe capital-gains tax (a 1031 exchange can defer both). Figures are a year-1 estimate at your 24.0% rate — not tax advice; consult a CPA.
Schools (NCES district)
- District
- Cuyahoga Falls City
- NCES district ID
- 3904383
- Math proficiency
- 47% ▼ -18.00%
- Reading proficiency
- 58% ▼ -7.00%
- Median HH income
- $49,587
- Composite
- 44.78/100
- National rank
- #2746
- State rank
- #408 of 656 in OH
Livability — Cuyahoga Falls
- Score
- 83/100
- State rank
- #60
- US rank
- #870
Category grades
Schools grade is shown separately in the Schools card above.
Census & demographics
- Census place
- Cuyahoga Falls, OH
- County
- Summit County · 440,783 people
- City population
- 47,005
- Metro
- Akron, OH
- Population (ZIP)
- 28,546
- Household income
- $63,342
- Rent vs Own
- Severe rent burden
- 1080.0
Population outlook (Summit County) Hauer SSP2
- Today (2025)
- 546,583 people
- By 2030
- 544,028 · -0.5%
- By 2040
- 531,363 · -2.8%
- By 2050
- 514,923 · -5.8%
- By 2075
- 481,765 · -11.9%
- By 2100
- 432,265 · -20.9%
Race, ethnicity, and origin ACS 2023
- Neighborhood character
- Predominantly White (81%)
- Race & ethnicity
- White 81% Asian 7% Black 5% Two or more races 5% Hispanic / Latino 2%
- Common ancestry
- Romanian 4% Lithuanian 2% Scotch-Irish 2%
- Foreign-born
- 7% · India, China, Canada
- Languages at home
- 90% English-only · Other Indo-European 6% Other Asian/Pacific 1% German/W. Germanic 1%
Political lean MEDSL · Summit
- 2024 margin
- Lean D (+7.0) · D 53.0% · R 46.0%
- 2008→2024 swing
- -9.6pp toward R · 2008: 16.6pp · 2024: 7.0pp
- All cycles
- 2024: D+7.0 2020: D+9.6 2016: D+8.2 2012: D+14.8 2008: D+16.6
Not yet ingested
- Civics
- —
Market trends
- HPI YoY
- ▼ -222.74%
- Current HPI
- 213.5428
- Rent YoY
- ▲ 6.95%
- Metro
- Akron, OH
- State GDP YoY
- ▲ 1.98%
- F500 in state
- 48
Industry mix (Fortune 500 HQ in OH)
| Industry | F500 HQs | Revenue |
|---|---|---|
| Insurance | 3 | $145B |
|
||
| Industrial Machinery | 3 | $49B |
|
||
| Financial Services | 3 | $24B |
|
||
| Consumer Goods | 2 | $93B |
|
||
| Aerospace / Defense | 2 | $47B |
|
||
| Utilities | 2 | $33B |
|
||
Price history
+228.3% since first listed6 events — show timeline
- 2026-06-11 Sold (MLS) $171,500 MLSNOW
- 2026-06-06 Pending — MLSNOW
- 2026-05-10 Contingent — MLSNOW
- 2026-05-04 Relisted — MLSNOW
- 2026-05-01 Listed $174,900 MLSNOW
- 2026-01-23 Sold (Public Records) $52,240 Public Records
Property tax history
+4.2%/yrLatest (2025): $1,609 · -3.0% YoY. Source: county tax records.
Cash-flow waterfall
monthlySold comps — $/sqft
last 12 mo · ≤1 miLoading sold comps…