 Triplex
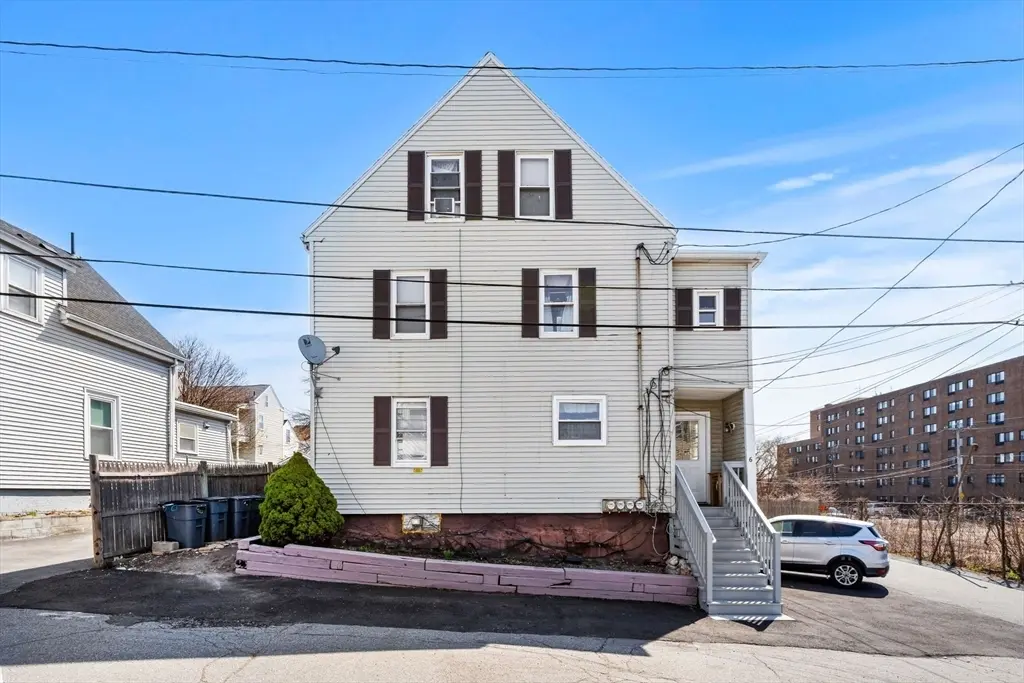
6 Munroe St · Peabody, MA
Flood risk 1/10 · Minimal
- FEMA flood zone
- X (shaded)
- Chance of flooding over 30 yrs
- 0.0%
- Est. flood insurance / yr
- $473 – $860
Fire risk 1/10 · Minimal
- Est. fire insurance / yr
- $915 – $1,699
Heat risk 6/10 · Moderate
- Hot days now (above 96°F)
- 7 days/yr
- Hot days in 30 yrs
- 16 days/yr
Wind risk 6/10 · Moderate
- Chance of severe wind over 30 yrs
- 68.0%
Air-quality risk 3/10 · Minor
- Unhealthy air days now
- 3 days/yr
- Unhealthy air days in 30 yrs
- 3 days/yr
Risk factors via First Street. Map © Google.
Why this score? — see what drove the C grade
The composite is a weighted blend of 9 inputs, each scored 0–100. Each bar is that input's sub-score; the figure is the points it added to the 100-point composite (weight × sub-score).
- Cash flow +20.7/30.0
- ARV discount +11.4/15.0
- DSCR +6.6/10.0
- 1% rule +4.5/10.0
- Livability +4.0/5.0
- Schools +3.1/10.0
- Condition / age +2.5/5.0
- Rent growth +2.3/5.0
- Appreciation +0.0/10.0
$799,000
🖨 Deal sheet (PDF) 📄 Offer letter ✓ Due diligence
Multi-family units
County records classify this as Multi-Family (2-4 Unit). Listing-text estimate: 3 units. confirmed
Listing remarks MLS
RARE OPPORTUNITY to own this de-leaded three-family property in Peabody! Ideally located close to everything, this is a great option for both owner-occupants and investors.Featuring 3 units, all with 2 bedrooms and 1 bath. Units 2 & 3 offer townhouse-style layouts across two levels. Current rents are below market with long-term tenants, providing strong upside potential.Situated on a one-way street with a spacious basement. Roof is approx. 12 years old. Owner has made several improvements, including renovated Units 1 & 2, new windows (2025), updated bath in Unit 2 (2025), and new front steps (2025).Don’t miss this opportunity to add a solid asset to your investment portfolio!
Key facts
- New front steps
- Spacious basement
- New windows
Tags
Neighborhood map
What this means for you Summary
Snapshot
- This is a 3 × 2-bed/1-bath units multifamily listed at $799k.
Deal economics
- At list price, monthly cash flow is $1k ($13k/yr) — positive. Per door: $363/mo.
- The deal already cash-flows at list — no discount required.
- To meet the 1% rule (rent ≥ 1% of price), the offer needs to be $763k (4.5% below list).
- Recommended offer: $751k (6.0% below list) — sets the bar for market timing.
- Cap rate 7.9% vs local median 3.4% in Peabody — top-decile yield for the area; either an underpriced asset or a hidden risk that comps aren't pricing in. Stress-test before assuming the spread holds.
Location & tenants
- Location reads 79/100 on livability (#44 in MA, #2,070 nationally) — a middle-class / working-renter tenant base. Strengths: commute A+, employment A+, health & safety A+; Watch: amenities D+, cost of living F.
- Peabody (suburban): math 29% / reading 40% proficiency, ranked #233 of 302 in MA (top 77%) — families likely to look elsewhere, expect single-tenant / working-renter base with shorter leases.
- Zoned schools: J Henry Higgins Middle (math 28% / reading 36%, grade F, #199 of 305 statewide, top 66%, 1,346 students, 0% FRL); Peabody Veterans Memorial High (math 46% / reading 59%, grade C-, #173 of 343 statewide, top 51%, 1,476 students, 0% FRL) — zoned schools average 0% FRL vs 30% district-wide (30 pts lower); this property's tenant base skews higher-income than the district average.
- Market conditions: Rents soft (-0.9%/yr); 48 active listings in the ZIP; solid renter incomes; 1,032 units permitted in Essex County in 2024 (590 in 5+ unit buildings).
- At $7,630/mo this rent would consume 95% of the median local household income ($97k/yr) (locally 2570% of renters already pay >50% of income on rent) — very limited rent-growth headroom before tenants either downsize or default.
Forward outlook
- Local home prices are declining (-3.0%/yr); year-one equity from $6k of loan paydown is wiped out by about $24k of value loss. Plan a longer hold.
- Essex County population projected at +15% by 2050 — long-run rental-demand tailwind backs the buy-and-hold thesis.
Negotiation context
- It's been on market 68 days — a 6% lower offer ($751k) is reasonable based on typical stale-listing flexibility.
- 4 sale attempts since 27y ago with the ask held roughly flat each time — persistent listings suggest the price (not the market) is what's stuck; bring a comps-based counter.
- Current owner paid $306k; list at $799k implies a 161% gain — meaningful room to come down on a strong offer.
Risks & watch-outs
- Watch-outs: built in 1910 — expect roof / HVAC / electrical / plumbing capex.
- Climate carrying-cost: major wind risk, 68% chance of damaging wind over 30y; extreme-heat days projected 7→16/yr by 2055 (HVAC capex compounding) — expect insurance premiums to compound above CPI over the hold.
Questions for the listing agent
- It's been on market 68 days. Have you received any prior offers? Is the seller open to a 6% concession, seller financing, or rate buy-down credit?
- Can we see the unit-by-unit rent roll, current vacancy, and any below-market leases? What's the average tenancy length?
- What capital expenditures (roof, boiler, parking lot, exteriors) have been made in the last 5 years, and what's planned in the next 2?
- Built in 1910 — when were the roof, HVAC, electrical panel, plumbing, and water heater last replaced?
- Why hasn't it sold? Are there any deal-killer items the seller is aware of (foundation, flood, title, zoning, code violations)?
- Is there a deadline driving the sale (1031 exchange, divorce, estate, relocation)? That informs how much negotiation room exists.
- What's the average days-on-market for RENTAL listings here right now (not sales)? A rising rental-DOM trend means longer vacancies and softer asking-rent achievability than the comps imply.
- What's the recent tenant-quality profile in this submarket — average credit score on applications, eviction rate, late-payment / NSF rate, and stable-employment percentage? A property-management company in the area should have these aggregated.
- How much new apartment / multifamily construction is in the pipeline within 1–3 miles? Heavy new supply (>2% of stock underway) typically softens rents 12–24 months out; light construction supports rent growth.
Investment metrics
- 1% rule
- 0.95% ✗
- Cap rate
- 7.93%
- Cash-on-cash
- 5.84%
- DSCR
- 1.26
- GRM
- 8.7
CMA / ARV
- ARV (median comp)
- $873,869
- List price
- $799,000
- Delta
- -8.57%
- Verdict
- FAIR
- Comps
- 20 within 1.0 mi
Show comp detail 12 sales within ~0.75 mi
| Address | Dist | Beds/Ba | Sqft | Sold | Price | $/sf | Match |
|---|---|---|---|---|---|---|---|
| 4 Northend St | 0.21mi | 6/3.0 (-1) | 2,610 (+3%) | 5mo | $835,000 | $320 | 76 |
| 23 Northend | 0.28mi | 7/3.0 | 2,300 (-10%) | 2mo | $1,000,000 | $435 | 70 |
| 18-20 Pleasant St | 0.51mi | 7/3.5 | 2,759 (+8%) | 1mo | $535,000 | $194 | 59 |
| 55 Butler St | 0.70mi | 6/3.0 (-1) | 2,536 (-0%) | 4mo | $905,000 | $357 | 58 |
| 9 Sutton St | 0.64mi | 6/2.0 (-1) | 2,658 (+4%) | 5mo | $725,000 | $273 | 49 |
| 15 Swampscott Ave | 0.71mi | 6/3.0 (-1) | 2,713 (+7%) | 3mo | $915,000 | $337 | 48 |
| 9 Shamrock St | 0.43mi | 6/2.5 (-1) | 2,248 (-12%) | 9mo | $955,000 | $425 | 46 |
| 12 Goldthwaite Pl | 0.58mi | 6/2.0 (-1) | 2,500 (-2%) | 18mo | $800,000 | $320 | 46 |
| 38 Pierpont St | 0.54mi | 7/3.0 | 2,862 (+12%) | 10mo | $645,000 | $225 | 46 |
| 33 Pulaski St | 0.63mi | 6/3.0 (-1) | 2,732 (+7%) | 16mo | $900,000 | $329 | 40 |
| 78 Endicott St | 0.47mi | 8/4.0 (+1) | 2,870 (+13%) | 11mo | $815,000 | $284 | 38 |
| 30 Irving St | 0.72mi | 6/2.0 (-1) | 2,250 (-12%) | 11mo | $780,000 | $347 | 29 |
Match score weights: distance 35% · size 25% · config 20% · recency 20%. Top-matched comps best support the ARV.
Projected returns pro-forma
-3.0% appreciation · 0.0% rent growth · sell at horizon
- IRR
- -10.4%
- Equity multiple
- 0.63×
- Total profit
- $-82,728
- Equity at exit
- $119,133
- IRR
- -5.5%
- Equity multiple
- 0.69×
- Total profit
- $-70,144
- Equity at exit
- $69,083
Cash invested: $223,720 (down + closing). Projections, not guarantees.
Landlord ↔ Tenant lean methodology
- Overall (STATE)
- 20 Strongly Tenant-Friendly
- State Massachusetts
- 20 Strongly Tenant-Friendly · D+15
- County
- — inherits STATE
- City
- — inherits STATE
ZIP-level market 01960
- Rents YoY
- -0.9%
- Active inventory
- 48
- Price-to-rent
- 26.2×
Monthly cashflow live
- Estimated rent
- $7,630 high interval (Pro) →
- Mortgage (P&I)
- −$4,190
- Tax from tax record
- −$416 /mo · $4,991/yr
- Insurance
- −$333
- HOA
- −$0
- Vacancy / Maint / Mgmt
- −$1,602
- Net cashflow
- $1,089
Break-even live
Sensitivity live
| Price | -10% $1,541 | -5% $1,315 | +0% $1,089 | +5% $863 | +10% $637 |
|---|---|---|---|---|---|
| Rent | -10% $486 | -5% $787 | +0% $1,089 | +5% $1,390 | +10% $1,692 |
| Rate | -1.0pp $1,491 | -0.5pp $1,292 | base $1,089 | +0.5pp $882 | +1.0pp $671 |
3-unit breakdown (identical units grouped — click to expand)
| Units | Beds | Baths | Est. rent |
|---|---|---|---|
| 3× units | 2 | 1 | $7,629 |
| #1 | 2 | 1 | $2,543 |
| #2 | 2 | 1 | $2,543 |
| #3 | 2 | 1 | $2,543 |
| Total (3 units) | $7,630 | ||
UW: 25.0% down · 7.5% · 30yr · 1.5% tax · 5.0% vac · 8.0% maint · 8.0% mgmt
Financing live
Cash to close
- Down payment
- $199,750
- Closing costs
- $23,970
- Reserves months
- —
- Total cash needed
- —
Loan-product check · same deal, 3 products live
Conventional
25% down · 7.5% · 30yr
- Down + closing
- —
- Monthly P&I
- —
- Monthly cashflow
- —
- DSCR
- —
- Eligible?
- —
Personal DTI + credit; lowest rate.
DSCR
20% down · 8.5% · 30yr
- Down + closing
- —
- Monthly P&I
- —
- Monthly cashflow
- —
- DSCR
- —
- Eligible?
- —
No personal income docs; deal must DSCR.
Hard money
10% down · 12.0% · 12mo
- Down + closing
- —
- Monthly P&I
- —
- Monthly cashflow
- —
- DSCR
- —
- Eligible?
- —
Short-term bridge; refi at stabilization.
Listing history 29 events
-
2026-06-21days on market $799,000 Active 68 DOM
-
2026-06-18days on market $799,000 Active 65 DOM
-
2026-06-17days on market $799,000 Active 64 DOM
-
2026-06-16days on market $799,000 Active 63 DOM
-
2026-06-15days on market $799,000 Active 62 DOM
-
2026-06-13days on market $799,000 Active 60 DOM
-
2026-06-13days on market $799,000 Active 59 DOM
-
2026-06-09days on market $799,000 Active 56 DOM
-
2026-06-08days on market $799,000 Active 55 DOM
-
2026-06-07days on market $799,000 Active 54 DOM
-
2026-06-04days on market $799,000 Active 51 DOM
-
2026-06-03days on market $799,000 Active 50 DOM
-
2026-06-02days on market $799,000 Active 49 DOM
-
2026-06-01days on market $799,000 Active 48 DOM
-
2026-05-31days on market $799,000 Active 47 DOM
-
2026-05-19price $799,000 698-char remark
Show marketing remark (698 chars)
RARE OPPORTUNITY to own this de-leaded three-family property in Peabody! Ideally located close to everything, this is a great option for both owner-occupants and investors.Featuring 3 units, all with 2 bedrooms and 1 bath. Units 2 & 3 offer townhouse-style layouts across two levels. Current rents are below market with long-term tenants, providing strong upside potential.Situated on a one-way street with a spacious basement. Roof is approx. 12 years old. Owner has made several improvements, including renovated Units 1 & 2, new windows (2025), updated bath in Unit 2 (2025), and new front steps (2025).Don’t miss this opportunity to add a solid asset to your investment portfolio!
-
2026-04-14$829,000 New 698-char remark
Show marketing remark (698 chars)
RARE OPPORTUNITY to own this de-leaded three-family property in Peabody! Ideally located close to everything, this is a great option for both owner-occupants and investors.Featuring 3 units, all with 2 bedrooms and 1 bath. Units 2 & 3 offer townhouse-style layouts across two levels. Current rents are below market with long-term tenants, providing strong upside potential.Situated on a one-way street with a spacious basement. Roof is approx. 12 years old. Owner has made several improvements, including renovated Units 1 & 2, new windows (2025), updated bath in Unit 2 (2025), and new front steps (2025).Don’t miss this opportunity to add a solid asset to your investment portfolio!
-
2014-09-18soldstatus $305,600 Sold 636-char remark
Show marketing remark (636 chars)
A ROOF OVER YOUR HEAD AND MONEY IN YOUR POCKET! Peabody 3 Family with 2 bedrooms in each unit. Move right in to the first floor apartment and start collecting rent checks from the other 2 units. (gross income $1,750 per month) The current owner has done much work here over the years, including deleading all 3 apartments, strip & re-roof, new exterior stairs and deck, structural repairs, some replacement windows, electrical, plumbing & gas fitting. There is still more work needed to take it to the next level. This is a great opportunity for the new owner to add value by renovating then raising rents to increase income.
-
2014-08-22historical Contingent 636-char remark
Show marketing remark (636 chars)
A ROOF OVER YOUR HEAD AND MONEY IN YOUR POCKET! Peabody 3 Family with 2 bedrooms in each unit. Move right in to the first floor apartment and start collecting rent checks from the other 2 units. (gross income $1,750 per month) The current owner has done much work here over the years, including deleading all 3 apartments, strip & re-roof, new exterior stairs and deck, structural repairs, some replacement windows, electrical, plumbing & gas fitting. There is still more work needed to take it to the next level. This is a great opportunity for the new owner to add value by renovating then raising rents to increase income.
-
2014-08-15$305,500 New 636-char remark
Show marketing remark (636 chars)
A ROOF OVER YOUR HEAD AND MONEY IN YOUR POCKET! Peabody 3 Family with 2 bedrooms in each unit. Move right in to the first floor apartment and start collecting rent checks from the other 2 units. (gross income $1,750 per month) The current owner has done much work here over the years, including deleading all 3 apartments, strip & re-roof, new exterior stairs and deck, structural repairs, some replacement windows, electrical, plumbing & gas fitting. There is still more work needed to take it to the next level. This is a great opportunity for the new owner to add value by renovating then raising rents to increase income.
-
2005-08-03soldstatus $280,000
-
2005-05-24historical
-
2005-05-23$280,000
-
1999-12-17soldstatus $183,000
-
1999-12-17soldstatus $183,000
-
1999-12-17soldstatus $183,000
-
1999-10-19historical
-
1999-09-10$188,000
-
1992-06-30soldstatus $110,000
ⓘ Source: listings_history table (triggers on properties + properties_extension) + one-shot
backfill from property_details.listing_events for pre-trigger history.
Tax reassessment forecast MA · Partial reset (capped growth)
- Current annual tax
- $4,991 · $416/mo
- Projected year-2 tax
- $7,409 · $617/mo
- Expected delta
- +$2,418/yr (+$202/mo · 48.5%)
ⓘ Screening estimate from a state-policy table — verify with the county assessor before closing.
Climate risk First Street
- Flood 1/10 Low FEMA zone X (shaded) · 0% chance over 30 yrs
- Wildfire 1/10 Low
- Heat 6/10 Major 7 d/yr ≥96°F today · 16 d/yr by 30 yrs out
- Wind 6/10 Major 68% chance of damaging wind over 30 yrs
- Air quality 3/10 Moderate 3 unhealthy d/yr today · 3 by 30 yrs out
Nearby sold comps map
Loading sold comps map…
Walkable amenities ~0.75 mi
Loading nearby amenities…
Taxation est. · year 1
- Rental income
- $91,560
- − Mortgage interest
- −$44,756
- − Property taxes
- −$4,991
- − Insurance
- −$3,995
- − Repairs & maintenance
- −$7,325
- − Management
- −$7,325
- − Depreciation
- −$23,244
- Taxable loss
- −$76
- Est. tax savings @ 24.0%
- +$18
- After-tax cash flow
- $13,084/yr
For passive investors: Depreciation is non-cash, so a rental often shows a tax loss while cash-flowing — sheltering income. Rental losses are passive: they offset passive income freely, and up to $25,000/yr can offset ordinary (W-2) income if you actively participate and your MAGI is under $100k (phasing out to $0 by $150k); unused losses carry forward. On sale, claimed depreciation is recaptured at up to 25%, and gains may owe capital-gains tax (a 1031 exchange can defer both). Figures are a year-1 estimate at your 24.0% rate — not tax advice; consult a CPA.
Schools (NCES district)
- District
- Peabody
- NCES district ID
- 2509360
- Math proficiency
- 29% ▼ -13.00%
- Reading proficiency
- 40% ▼ -5.00%
- Median HH income
- $64,022
- Composite
- 31.23/100
- National rank
- #6033
- State rank
- #233 of 302 in MA
Livability — Peabody
- Score
- 79/100
- State rank
- #44
- US rank
- #2070
Category grades
Schools grade is shown separately in the Schools card above.
Census & demographics
- Census place
- Peabody, MA
- County
- Essex County · 632,995 people
- City population
- 54,474
- Metro
- Boston-Cambridge-Newton, MA-NH
- Population (ZIP)
- 54,474
- Household income
- $96,501
- Rent vs Own
- Severe rent burden
- 2570.0
Population outlook (Essex County) Hauer SSP2
- Today (2025)
- 840,920 people
- By 2030
- 872,201 · +3.7%
- By 2040
- 927,918 · +10.3%
- By 2050
- 970,206 · +15.4%
- By 2075
- 1,077,993 · +28.2%
- By 2100
- 1,103,053 · +31.2%
Race, ethnicity, and origin ACS 2023
- Neighborhood character
- Predominantly White (77%)
- Race & ethnicity
- White 77% Hispanic / Latino 12% Two or more races 10% Black 4% Asian 2%
- Hispanic origin (detail)
- Puerto Rican 2% Dominican 6%
- Common ancestry
- Russian 6% Lithuanian 4% Romanian 3%
- Foreign-born
- 17% · Canada, China
- Languages at home
- 76% English-only · Other Indo-European 11% Spanish 8% French/Haitian/Cajun 2%
Political lean MEDSL · Essex
- 2024 margin
- Strong D (+20.3) · D 59.2% · R 38.9% · Other 1.9%
- 2008→2024 swing
- 0.0pp no change · 2008: 20.3pp · 2024: 20.3pp
- All cycles
- 2024: D+20.3 2020: D+29.1 2016: D+22.5 2012: D+16.2 2008: D+20.3
Not yet ingested
- Civics
- —
Market trends
- HPI YoY
- ▼ -565.60%
- Current HPI
- 285.9699
- Rent YoY
- ▼ -0.91%
- Metro
- Boston-Cambridge-Newton, MA-NH
- State GDP YoY
- ▲ 2.28%
- F500 in state
- 38
Industry mix (Fortune 500 HQ in MA)
| Industry | F500 HQs | Revenue |
|---|---|---|
| Technology | 3 | $17B |
|
||
| Insurance | 2 | $84B |
|
||
| Retail | 2 | $76B |
|
||
| Life Sciences | 1 | $43B |
|
||
| Energy Technology | 1 | $31B |
|
||
| Aerospace / Defense | 1 | $18B |
|
||
Price history
+626.4% since first listed14 events — show timeline
- 2026-05-19 Price Changed $799,000 MLS PIN
- 2026-04-14 Listed $829,000 MLS PIN
- 2014-09-18 Sold (MLS) $305,600 MLS PIN
- 2014-08-22 Contingent — MLS PIN
- 2014-08-15 Listed $305,500 MLS PIN
- 2005-08-03 Sold (MLS) $280,000 MLS PIN
- 2005-05-24 Listing Removed — MLS PIN
- 2005-05-23 Listed $280,000 MLS PIN
- 1999-12-17 Sold (Public Records) $183,000 Public Records
- 1999-12-17 Sold (Public Records) $183,000 Public Records
- 1999-12-17 Sold (MLS) $183,000 MLS PIN
- 1999-10-19 Listing Removed — MLS PIN
- 1999-09-10 Listed $188,000 MLS PIN
- 1992-06-30 Sold (Public Records) $110,000 Public Records
Property tax history
+3.2%/yrLatest (2022): $4,991 · +3.4% YoY. Source: county tax records.
Cash-flow waterfall
monthlySold comps — $/sqft
last 12 mo · ≤1 miLoading sold comps…