 Duplex
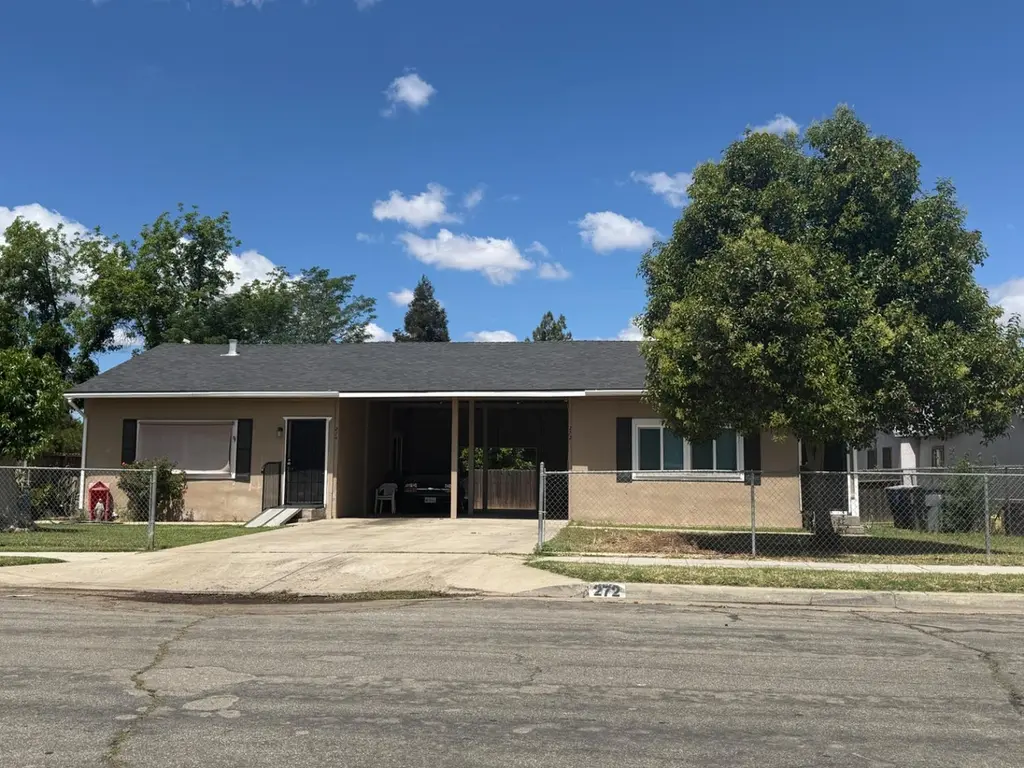
272 W Pinedale Ave · Fresno, CA
Flood risk 1/10 · Minimal
- FEMA flood zone
- X (unshaded)
- Chance of flooding over 30 yrs
- 0.0%
- Est. flood insurance / yr
- $507 – $1,088
Fire risk 6/10 · Moderate
- Est. fire insurance / yr
- $659 – $1,223
Heat risk 8/10 · Major
- Hot days now (above 105°F)
- 7 days/yr
- Hot days in 30 yrs
- 17 days/yr
Wind risk 1/10 · Minimal
- Chance of severe wind over 30 yrs
- —
Air-quality risk 10/10 · Severe
- Unhealthy air days now
- 48 days/yr
- Unhealthy air days in 30 yrs
- 50 days/yr
Risk factors via First Street. Map © Google.
Why this score? — see what drove the A- grade
The composite is a weighted blend of 9 inputs, each scored 0–100. Each bar is that input's sub-score; the figure is the points it added to the 100-point composite (weight × sub-score).
- Cash flow +28.4/30.0
- ARV discount +13.6/15.0
- DSCR +10.0/10.0
- Appreciation +10.0/10.0
- 1% rule +6.9/10.0
- Schools +5.9/10.0
- Livability +3.1/5.0
- Rent growth +2.5/5.0
- Condition / age +2.5/5.0
$297,000
🖨 Deal sheet 📄 Offer letter ✓ Due diligence
Multi-family units
County records classify this as Multi-Family (2-4 Unit). Listing-text estimate: 2 units. confirmed
Listing remarks MLS
This is not a foreclosure or short sale!! Deal w/seller for a quick response. Neat 2 Bd-1 Ba duplex. Surrounded by major real estate development. To be sold as is. Lot size 75 x 125. Hurry won't last. 272 W. Pinedale is currently vacant w/ lockbox.
Key facts
- 9,374 sq ft lot
- Built 1928
- Listed 8 days
Tags
Property features AI
Exterior
- Parking: Carport (covered parking)
- Utilities: Electric service on; Public sewer; Public utilities
- Home design: Duplex; Single-story
- Construction: Stucco and wood siding exterior; Composition roof; Wood subfloor foundation
- Exterior features: One level; Fenced lot; Urban setting
Interior
- Bathrooms: 2 bathrooms
- Heating & cooling: Wall/window unit(s) for cooling
- Interior features: In-unit laundry; No fireplace; Wall/window air conditioning
- Laundry & utility: In-unit laundry
Neighborhood map
What this means for you Summary
Snapshot
- This is a 2 × 2.0-bed/1.0-bath units multifamily listed at $297k.
Deal economics
- At list price, monthly cash flow is $957 ($11k/yr) — positive. Per door: $479/mo.
- The deal already cash-flows at list — no discount required.
- Meets the 1% rule at list price ($4k rent vs $297k).
- Cap rate 10.2% vs local median 3.7% in Fresno — top-decile yield for the area; either an underpriced asset or a hidden risk that comps aren't pricing in. Stress-test before assuming the spread holds.
Location & tenants
- Location reads 62/100 on livability (#469 in CA) — a middle-class / working-renter tenant base. Strengths: commute A+, housing A+; Watch: amenities D+, employment D+, schools D.
- Clovis Unified (suburban): math 58% / reading 72% proficiency, ranked #152 of 1,400 in CA (top 11%) — acceptable for families but not a draw, mixed tenant base, ~2y average lease.
- Market conditions: 18 active listings in the ZIP; 6 comparable units currently listed for rent nearby; rentals at typical pace (median 16d on market — plan ~3-4 weeks tenant-placement turnaround); 2,426 units permitted in Fresno County in 2024 (296 in 5+ unit buildings).
Forward outlook
- In year one you build about $32k of equity ($2k loan paydown + $30k appreciation (10.0% local appreciation)).
- Fresno County population projected at +11% by 2050 — modest demand growth; plan on rents tracking national, not racing it.
- At projected returns (10.0% appreciation + 3.0% rent growth), your $83k cash investment doubles in ~2 years — after that, you're playing with house money.
- By year 2, paydown + projected appreciation supports a ~$51k cash-out refi (75% LTV) — recoverable capital for the next deal without selling this one.
Negotiation context
- Only 8 days on market — expect competitive offers; lowballing is unlikely to land.
- 2 sale attempts since 17y ago with the ask held roughly flat each time — persistent listings suggest the price (not the market) is what's stuck; bring a comps-based counter.
Risks & watch-outs
- Watch-outs: built in 1928 — expect roof / HVAC / electrical / plumbing capex.
- Climate carrying-cost: major wildfire risk; extreme-heat days projected 7→17/yr by 2055 (HVAC capex compounding) — expect insurance premiums to compound above CPI over the hold.
Questions for the listing agent
- Can we see the unit-by-unit rent roll, current vacancy, and any below-market leases? What's the average tenancy length?
- What capital expenditures (roof, boiler, parking lot, exteriors) have been made in the last 5 years, and what's planned in the next 2?
- Built in 1928 — when were the roof, HVAC, electrical panel, plumbing, and water heater last replaced?
- Is there a deadline driving the sale (1031 exchange, divorce, estate, relocation)? That informs how much negotiation room exists.
- Schools are D-rated, which usually means shorter tenancies and higher turnover. Who's the typical renter profile here, and what's been the actual vacancy rate?
- Crime grade is F in this area — have there been break-ins, vandalism, or insurance claims at this property in the last 3 years? What carrier currently insures it and at what premium?
- What's the average days-on-market for RENTAL listings here right now (not sales)? A rising rental-DOM trend means longer vacancies and softer asking-rent achievability than the comps imply.
- What's the recent tenant-quality profile in this submarket — average credit score on applications, eviction rate, late-payment / NSF rate, and stable-employment percentage? A property-management company in the area should have these aggregated.
- How much new apartment / multifamily construction is in the pipeline within 1–3 miles? Heavy new supply (>2% of stock underway) typically softens rents 12–24 months out; light construction supports rent growth.
Investment metrics
- 1% rule
- 1.19% ✓
- Cap rate
- 10.16%
- Cash-on-cash
- 13.81%
- DSCR
- 1.61
- GRM
- 7.0
CMA / ARV
- ARV (median comp)
- $344,000
- List price
- $297,000
- Delta
- -13.66%
- Verdict
- UNDERPRICED
- Comps
- 4 within 1.0 mi
Show comp detail 2 sales within ~0.75 mi
| Address | Dist | Beds/Ba | Sqft | Sold | Price | $/sf | Match |
|---|---|---|---|---|---|---|---|
| 272 W Pinedale Ave | 0.00mi | 4/2.0 | 1,428 (0%) | 1mo | $298,000 | $209 | 99 |
| 7160 N Maroa Ave | 0.29mi | 4/2.0 | 1,428 (0%) | 11mo | $240,000 | $168 | 78 |
Match score weights: distance 35% · size 25% · config 20% · recency 20%. Top-matched comps best support the ARV.
Projected returns pro-forma
10.0% appreciation · 3.0% rent growth · sell at horizon
- IRR
- 34.4%
- Equity multiple
- 3.68×
- Total profit
- $222,623
- Equity at exit
- $267,561
- IRR
- 29.7%
- Equity multiple
- 8.30×
- Total profit
- $607,483
- Equity at exit
- $577,006
Cash invested: $83,160 (down + closing). Projections, not guarantees.
Landlord ↔ Tenant lean methodology
- Overall (STATE)
- 18 Strongly Tenant-Friendly
- State California
- 18 Strongly Tenant-Friendly · D+13
- County
- — inherits STATE
- City
- — inherits STATE
ZIP-level market 93650
- Home prices YoY
- 2.5%
- Active inventory
- 18
- Price-to-rent
- 14.1×
Monthly cashflow live
- Estimated rent
- $3,523 medium interval (Pro) →
- Mortgage (P&I)
- −$1,558
- Tax from tax record
- −$145 /mo · $1,738/yr
- Insurance
- −$124
- HOA
- −$0
- Vacancy / Maint / Mgmt
- −$740
- Net cashflow
- $957
Break-even live
2-unit breakdown (identical units grouped — click to expand)
| Units | Beds | Baths | Est. rent |
|---|---|---|---|
| 2× units | 2.0 | 1 | $3,522 |
| #1 | 2.0 | 1 | $1,761 |
| #2 | 2.0 | 1 | $1,761 |
| Total (2 units) | $3,523 | ||
UW: 25.0% down · 7.5% · 30yr · 1.5% tax · 5.0% vac · 8.0% maint · 8.0% mgmt
Financing live
Cash to close
- Down payment
- $74,250
- Closing costs
- $8,910
- Reserves months
- —
- Total cash needed
- —
Loan-product check · same deal, 3 products live
Conventional
25% down · 7.5% · 30yr
- Down + closing
- —
- Monthly P&I
- —
- Monthly cashflow
- —
- DSCR
- —
- Eligible?
- —
Personal DTI + credit; lowest rate.
DSCR
20% down · 8.5% · 30yr
- Down + closing
- —
- Monthly P&I
- —
- Monthly cashflow
- —
- DSCR
- —
- Eligible?
- —
No personal income docs; deal must DSCR.
Hard money
10% down · 12.0% · 12mo
- Down + closing
- —
- Monthly P&I
- —
- Monthly cashflow
- —
- DSCR
- —
- Eligible?
- —
Short-term bridge; refi at stabilization.
Rent comps 6 comps
| Address | Beds | Baths | Sqft | Rent | $/sqft | DOM | Units | Dist |
|---|---|---|---|---|---|---|---|---|
| 91 W Sierra Ave Fresno, CA | 3.0 | 1.5 | 1291 | $2,500 | $1.94 | 16d | 1 | 1.01mi |
| 8476 N Del Mar Ave Fresno, CA | 4.0 | 2.0 | 1797 | $10,000 | $5.56 | 23d | 1 | 1.06mi |
| 7511 N First St Fresno, CA | 1.0–3.0 | 1.0–2.5 | 1078 | $2,350 | $2.18 | 1d | 21 | 1.21mi |
| 6052 N College Ave Unit A Fresno, CA | 3.0 | 2.0 | 1200 | $2,100 | $1.75 | 43d | 1 | 1.39mi |
| 135 E Stuart Ave Fresno, CA | 3.0 | 1.0 | 1120 | $1,995 | $1.78 | 3d | 1 | 1.39mi |
| 6515 N Orchard St Fresno, CA | 3.0 | 2.0 | 1500 | $2,300 | $1.53 | 16d | 1 | 1.43mi |
Listing history 7 events
-
2026-04-20$297,000 Active 691-char remark
-
2009-03-13soldstatus $110,000 254-char remark
Show marketing remark (254 chars)
This is not a foreclosure or short sale!! Deal w/seller for a quick response. Neat 2 Bd-1 Ba duplex. Surrounded by major real estate development. To be sold as is. Lot size 75 x 125. Hurry won't last. 272 W. Pinedale is currently vacant w/ lockbox.
-
2009-03-13soldstatus $110,000
Show marketing remark (254 chars)
This is not a foreclosure or short sale!! Deal w/seller for a quick response. Neat 2 Bd-1 Ba duplex. Surrounded by major real estate development. To be sold as is. Lot size 75 x 125. Hurry won't last. 272 W. Pinedale is currently vacant w/ lockbox.
-
2009-01-12historical 254-char remark
Show marketing remark (254 chars)
This is not a foreclosure or short sale!! Deal w/seller for a quick response. Neat 2 Bd-1 Ba duplex. Surrounded by major real estate development. To be sold as is. Lot size 75 x 125. Hurry won't last. 272 W. Pinedale is currently vacant w/ lockbox.
-
2009-01-02$110,000 254-char remark
Show marketing remark (254 chars)
This is not a foreclosure or short sale!! Deal w/seller for a quick response. Neat 2 Bd-1 Ba duplex. Surrounded by major real estate development. To be sold as is. Lot size 75 x 125. Hurry won't last. 272 W. Pinedale is currently vacant w/ lockbox.
-
1985-10-25soldstatus $52,000
-
1984-06-13soldstatus $60,000
ⓘ Source: listings_history table (triggers on properties + properties_extension) + one-shot
backfill from property_details.listing_events for pre-trigger history.
Tax reassessment forecast CA · Resets to sale price
- Current annual tax
- $1,738 · $145/mo
- Projected year-2 tax
- $2,257 · $188/mo
- Expected delta
- +$519/yr (+$43/mo · 29.8%)
ⓘ Screening estimate from a state-policy table — verify with the county assessor before closing.
Climate risk First Street
- Flood 1/10 Low FEMA zone X (unshaded) · 0% chance over 30 yrs
- Wildfire 6/10 Major
- Heat 8/10 Severe 7 d/yr ≥105°F today · 17 d/yr by 30 yrs out
- Wind 1/10 Low
- Air quality 10/10 Extreme 48 unhealthy d/yr today · 50 by 30 yrs out
Nearby sold comps map
Loading sold comps map…
Walkable amenities ~0.75 mi
Loading nearby amenities…
Taxation est. · year 1
- Rental income
- $42,276
- − Mortgage interest
- −$16,637
- − Property taxes
- −$1,738
- − Insurance
- −$1,485
- − Repairs & maintenance
- −$3,382
- − Management
- −$3,382
- − Depreciation
- −$8,640
- Taxable income
- $7,012
- Est. tax owed @ 24.0%
- −$1,683
- After-tax cash flow
- $9,802/yr
For passive investors: Depreciation is non-cash, so a rental often shows a tax loss while cash-flowing — sheltering income. Rental losses are passive: they offset passive income freely, and up to $25,000/yr can offset ordinary (W-2) income if you actively participate and your MAGI is under $100k (phasing out to $0 by $150k); unused losses carry forward. On sale, claimed depreciation is recaptured at up to 25%, and gains may owe capital-gains tax (a 1031 exchange can defer both). Figures are a year-1 estimate at your 24.0% rate — not tax advice; consult a CPA.
Schools (NCES district)
- District
- Clovis Unified
- NCES district ID
- 0609030
- Math proficiency
- 58% ▲ 1.00%
- Reading proficiency
- 72% ▲ 2.00%
- Median HH income
- $71,950
- Composite
- 58.7/100
- National rank
- #2003
- State rank
- #152 of 1400 in CA
Livability — Fresno
- Score
- 62/100
- State rank
- #469
- US rank
- #15907
Category grades
Schools grade is shown separately in the Schools card above.
Census & demographics
- Census place
- Fresno, CA
- City population
- 593,114
- Population (ZIP)
- 2,969
Population outlook (Fresno County) Hauer SSP2
- Today (2025)
- 1,042,971 people
- By 2030
- 1,072,198 · +2.8%
- By 2040
- 1,122,408 · +7.6%
- By 2050
- 1,157,251 · +11.0%
- By 2075
- 1,182,575 · +13.4%
- By 2100
- 1,105,899 · +6.0%
Race, ethnicity, and origin ACS 2023
- Neighborhood character
- Predominantly Hispanic (77%)
- Race & ethnicity
- Hispanic / Latino 77% Two or more races 33% White 12% Asian 6% Black 3%
- Hispanic origin (detail)
- Mexican 71%
- Common ancestry
- Slovak 3% Romanian 1%
- Foreign-born
- 15% · Canada
- Languages at home
- 52% English-only · Spanish 41% Other Asian/Pacific 4% Other Indo-European 2%
Political lean MEDSL · Fresno
- 2024 margin
- Toss-up / Even · D 46.5% · R 50.9% · Other 2.6%
- 2008→2024 swing
- -6.5pp toward R · 2008: 2.1pp · 2024: -4.4pp
- All cycles
- 2024: R+4.4 2020: D+7.8 2016: D+3.9 2012: R+2.9 2008: D+2.1
Not yet ingested
- Civics
- —
Market trends
- HPI YoY
- ▲ 13.16%
- Current HPI
- 547.5597
- Rent YoY
- —
- Metro
- —
- State GDP YoY
- ▲ 3.21%
- F500 in state
- 116
Industry mix (Fortune 500 HQ in CA)
| Industry | F500 HQs | Revenue |
|---|---|---|
| Technology | 27 | $1,492B |
|
||
| Financial Services | 3 | $174B |
|
||
| Retail | 3 | $44B |
|
||
| Insurance | 3 | $26B |
|
||
| Media / Entertainment | 2 | $115B |
|
||
| Pharmaceuticals / Biotech | 2 | $62B |
|
||
Price history
+396.7% since first listed10 events — show timeline
- 2026-05-29 Sold (Public Records) $298,000 Public Records
- 2026-05-29 Sold (MLS) $298,000 FRESNOMLS
- 2026-05-20 Pending — FRESNOMLS
- 2026-04-20 Listed $297,000 FRESNOMLS
- 2009-03-13 Sold (Public Records) $110,000 Public Records
- 2009-03-13 Sold (MLS) $110,000 FRESNOMLS
- 2009-01-12 Delisted — FRESNOMLS
- 2009-01-02 Listed $110,000 FRESNOMLS
- 1985-10-25 Sold (Public Records) $52,000 Public Records
- 1984-06-13 Sold (Public Records) $60,000 Public Records
Property tax history
+4.2%/yrLatest (2025): $1,738 · +1.9% YoY. Source: county tax records.
Cash-flow waterfall
monthlySold comps — $/sqft
last 12 mo · ≤1 miLoading sold comps…