819 Ulrich Rd · Prospect, OR
Flood risk 1/10 · Minimal
- FEMA flood zone
- X
- Chance of flooding over 30 yrs
- 0.0%
- Est. flood insurance / yr
- $507 – $1,088
Fire risk 8/10 · Major
- Est. fire insurance / yr
- $498 – $926
Heat risk 4/10 · Minor
- Hot days now (above 91°F)
- 9 days/yr
- Hot days in 30 yrs
- 20 days/yr
Wind risk 1/10 · Minimal
- Chance of severe wind over 30 yrs
- —
Air-quality risk 10/10 · Severe
- Unhealthy air days now
- 31 days/yr
- Unhealthy air days in 30 yrs
- 31 days/yr
Risk factors via First Street. Map © Google.
Why this score? — see what drove the C+ grade
The composite is a weighted blend of 9 inputs, each scored 0–100. Each bar is that input's sub-score; the figure is the points it added to the 100-point composite (weight × sub-score).
- Cash flow +26.6/30.0
- DSCR +9.1/10.0
- ARV discount +7.5/15.0
- 1% rule +6.2/10.0
- Appreciation +5.0/10.0
- Schools +2.6/10.0
- Livability +2.6/5.0
- Rent growth +2.5/5.0
- Condition / age +2.5/5.0
$115,000
🖨 Deal sheet 📄 Offer letter ✓ Due diligence
Listing remarks
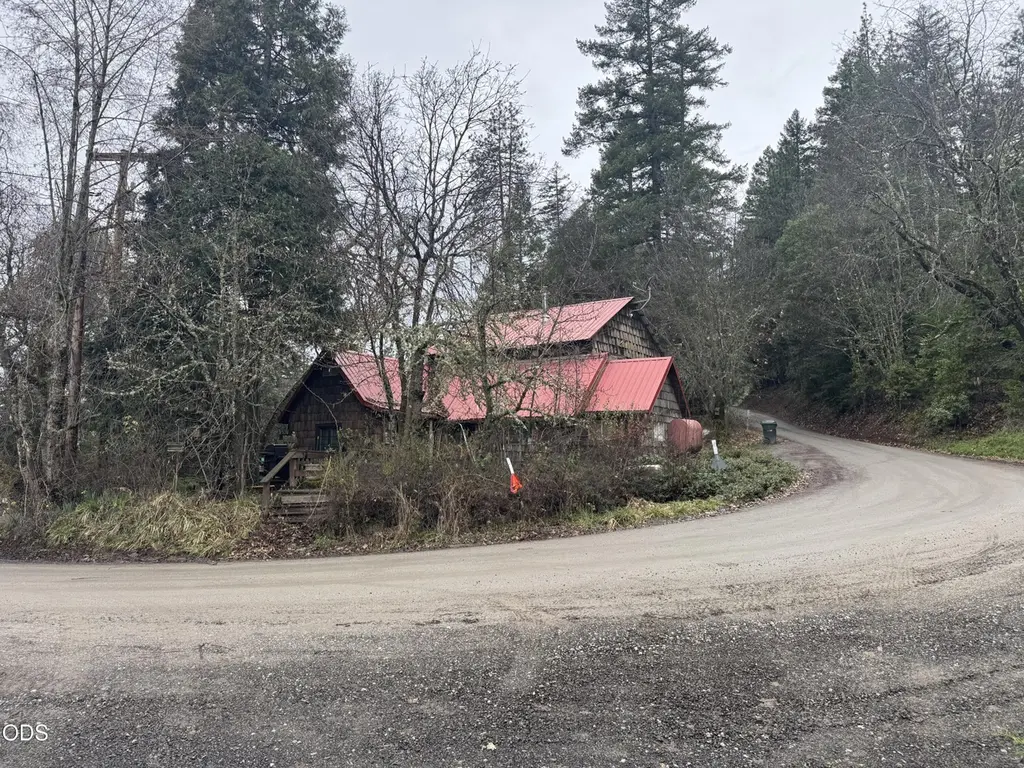
Fixer opportunity in Prospect, Oregon! This 2-bedroom, 1-bath home offers 1,411 square feet of living space on a . 32-acre lot with plenty of potential for investors, contractors, or buyers looking to build sweat equity. Features include a durable metal roof, spacious rooms, and a level lot with room for parking, gardening, or future improvements. Located near the Rogue River, Lost Creek Lake, Crater Lake National Park, and endless outdoor recreation, this property could make an ideal primary residence, vacation retreat, or investment project. Bring your tools and vision--this home is ready for its next chapter.
Key facts
- Metal roof
- Near lost creek lake
- Level lot
Tags
Property features AI
Finance
- Other: Lot approximately 0.32 acres (EFU zoning)
- Financial info: Property is currently rented
- HOA & community: No CCRs
Exterior
- Parking: Driveway
- Security: Audio surveillance on premises; Video surveillance on premises
- Utilities: Public utilities available; Septic tank; Other water source
- Home design: Single-family residence; Two levels; Residential property; Waterfront property
- Construction: Built in 1934; Frame construction; Metal roof; Concrete perimeter and stone foundation
- Exterior features: Stream on the property; Gravel and paved road access; Shared access road frontage
Interior
- Kitchen: Oven; Range
- Bedrooms: 2 bedrooms
- Flooring: Carpet; Vinyl
- Bathrooms: 1 full bathroom
- Heating & cooling: Oil heating; Wood heating; No cooling
- Interior features: Ceiling fan(s); Wood-burning fireplace
Neighborhood map
What this means for you Summary
Snapshot
- This is a 2-bed/1.0-bath single-family listed at $115k.
Deal economics
- At list price, monthly cash flow is $308 ($4k/yr) — positive.
- The deal already cash-flows at list — no discount required.
- Meets the 1% rule at list price ($1k rent vs $115k).
Location & tenants
- Location reads 52/100 on livability (#346 in OR) — a working-class tenant base; expect higher turnover. Strengths: cost of living A+; Watch: schools F, crime F, amenities F.
- Prospect SD 59 (rural): math 20% / reading 35% proficiency, ranked #168 of 183 in OR (top 92%) — low school quality limits family demand, transient renter base, plan for 1-2y turnover; 61% free/reduced lunch — lower-income household profile, screen leases tightly.
- Market conditions: 23 active listings in the ZIP; 904 units permitted in Jackson County in 2024 (212 in 5+ unit buildings).
Forward outlook
- In year one you build about $790 of equity ($795 loan paydown + $-5 appreciation (-0.0% local appreciation)).
- Jackson County population projected at +17% by 2050 — long-run rental-demand tailwind backs the buy-and-hold thesis.
- At projected returns (-0.0% appreciation + 3.0% rent growth), your $32k cash investment doubles in ~6 years — after that, you're playing with house money.
Negotiation context
- Only 7 days on market — expect competitive offers; lowballing is unlikely to land.
- 3 sale attempts since 30y ago with the ask held roughly flat each time — persistent listings suggest the price (not the market) is what's stuck; bring a comps-based counter.
- Current owner paid $50k; list at $115k implies a 130% gain — meaningful room to come down on a strong offer.
Risks & watch-outs
- Watch-outs: built in 1934 — expect roof / HVAC / electrical / plumbing capex.
- Climate carrying-cost: severe wildfire risk — expect insurance premiums to compound above CPI over the hold.
Questions for the listing agent
- Built in 1934 — when were the roof, HVAC, electrical panel, plumbing, and water heater last replaced?
- Is there a deadline driving the sale (1031 exchange, divorce, estate, relocation)? That informs how much negotiation room exists.
- Schools are F-rated, which usually means shorter tenancies and higher turnover. Who's the typical renter profile here, and what's been the actual vacancy rate?
- Crime grade is F in this area — have there been break-ins, vandalism, or insurance claims at this property in the last 3 years? What carrier currently insures it and at what premium?
- What's the average days-on-market for RENTAL listings here right now (not sales)? A rising rental-DOM trend means longer vacancies and softer asking-rent achievability than the comps imply.
- What's the recent tenant-quality profile in this submarket — average credit score on applications, eviction rate, late-payment / NSF rate, and stable-employment percentage? A property-management company in the area should have these aggregated.
- How much new for-sale + rental construction is in the pipeline within 1–3 miles? Heavy new supply typically softens prices + rents 12–24 months out; constrained supply supports both.
Investment metrics
- 1% rule
- 1.12% ✓
- Cap rate
- 9.50%
- Cash-on-cash
- 11.47%
- DSCR
- 1.51
- GRM
- 7.4
CMA / ARV
No comps found within radius.
Projected returns pro-forma
-0.0% appreciation · 3.0% rent growth · sell at horizon
- IRR
- 10.5%
- Equity multiple
- 1.50×
- Total profit
- $16,177
- Equity at exit
- $33,367
- IRR
- 15.4%
- Equity multiple
- 2.68×
- Total profit
- $54,254
- Equity at exit
- $40,088
Cash invested: $32,200 (down + closing). Projections, not guarantees.
Landlord ↔ Tenant lean methodology
- Overall (STATE)
- 28 Tenant-Leaning
- State Oregon
- 28 Tenant-Leaning · D+6
- County
- — inherits STATE
- City
- — inherits STATE
ZIP-level market 97536
- Home prices YoY
- -0.0%
- Active inventory
- 23
- Price-to-rent
- 7.4×
Monthly cashflow live
- Estimated rent
- $1,291 medium interval (Pro) →
- Mortgage (P&I)
- −$603
- Tax from tax record
- −$61 /mo · $738/yr
- Insurance
- −$48
- HOA
- −$0
- Vacancy / Maint / Mgmt
- −$271
- Net cashflow
- $308
Break-even live
UW: 25.0% down · 7.5% · 30yr · 1.5% tax · 5.0% vac · 8.0% maint · 8.0% mgmt
Financing live
Cash to close
- Down payment
- $28,750
- Closing costs
- $3,450
- Reserves months
- —
- Total cash needed
- —
Loan-product check · same deal, 3 products live
Conventional
25% down · 7.5% · 30yr
- Down + closing
- —
- Monthly P&I
- —
- Monthly cashflow
- —
- DSCR
- —
- Eligible?
- —
Personal DTI + credit; lowest rate.
DSCR
20% down · 8.5% · 30yr
- Down + closing
- —
- Monthly P&I
- —
- Monthly cashflow
- —
- DSCR
- —
- Eligible?
- —
No personal income docs; deal must DSCR.
Hard money
10% down · 12.0% · 12mo
- Down + closing
- —
- Monthly P&I
- —
- Monthly cashflow
- —
- DSCR
- —
- Eligible?
- —
Short-term bridge; refi at stabilization.
Listing history 7 events
-
2026-06-18days on market $115,000 Active 7 DOM
-
2026-06-17days on market $115,000 Active 6 DOM
-
2026-06-16days on market $115,000 Active 5 DOM
-
2026-06-15days on market $115,000 Active 4 DOM
-
2026-06-13days on market $115,000 Active 2 DOM
-
2026-06-12remarks 619-char remark
-
2026-06-12$115,000 Active 1 DOM
ⓘ Source: listings_history table (triggers on properties + properties_extension) + one-shot
backfill from property_details.listing_events for pre-trigger history.
Tax reassessment forecast OR · Resets to sale price
- Current annual tax
- $738 · $61/mo
- Projected year-2 tax
- $1,116 · $93/mo
- Expected delta
- +$378/yr (+$31/mo · 51.2%)
ⓘ Screening estimate from a state-policy table — verify with the county assessor before closing.
Climate risk First Street
- Flood 1/10 Low FEMA zone X · 0% chance over 30 yrs
- Wildfire 8/10 Severe
- Heat 4/10 Moderate 9 d/yr ≥91°F today · 20 d/yr by 30 yrs out
- Wind 1/10 Low
- Air quality 10/10 Extreme 31 unhealthy d/yr today · 31 by 30 yrs out
Nearby sold comps map
Loading sold comps map…
Walkable amenities ~0.75 mi
Loading nearby amenities…
Taxation est. · year 1
- Rental income
- $15,496
- − Mortgage interest
- −$6,442
- − Property taxes
- −$738
- − Insurance
- −$575
- − Repairs & maintenance
- −$1,240
- − Management
- −$1,240
- − Depreciation
- −$3,345
- Taxable income
- $1,917
- Est. tax owed @ 24.0%
- −$460
- After-tax cash flow
- $3,232/yr
For passive investors: Depreciation is non-cash, so a rental often shows a tax loss while cash-flowing — sheltering income. Rental losses are passive: they offset passive income freely, and up to $25,000/yr can offset ordinary (W-2) income if you actively participate and your MAGI is under $100k (phasing out to $0 by $150k); unused losses carry forward. On sale, claimed depreciation is recaptured at up to 25%, and gains may owe capital-gains tax (a 1031 exchange can defer both). Figures are a year-1 estimate at your 24.0% rate — not tax advice; consult a CPA.
Schools (NCES district)
- District
- Prospect SD 59
- NCES district ID
- 4110200
- Math proficiency
- 20% ▲ 5.00%
- Reading proficiency
- 35% ▬ 0.00%
- Median HH income
- $39,573
- Composite
- 26.04/100
- National rank
- #12739
- State rank
- #168 of 183 in OR
Livability — Prospect
- Score
- 52/100
- State rank
- #346
- US rank
- #25082
Category grades
Schools grade is shown separately in the Schools card above.
Census & demographics
- Population (ZIP)
- 1,230
Population outlook (Jackson County) Hauer SSP2
- Today (2025)
- 234,433 people
- By 2030
- 243,834 · +4.0%
- By 2040
- 259,717 · +10.8%
- By 2050
- 273,269 · +16.6%
- By 2075
- 300,624 · +28.2%
- By 2100
- 305,256 · +30.2%
Race, ethnicity, and origin ACS 2023
- Neighborhood character
- Predominantly White (84%)
- Race & ethnicity
- White 84% Two or more races 13% Hispanic / Latino 4% Native American 1%
- Common ancestry
- Portuguese 3% Slovak 3% Iranian 3%
- Foreign-born
- 1% · Canada
- Languages at home
- 98% English-only · Spanish 1%
Political lean MEDSL · Jackson
- 2024 margin
- Lean R (+6.4) · D 45.5% · R 51.9% · Other 2.6%
- 2008→2024 swing
- -6.5pp toward R · 2008: 0.1pp · 2024: -6.4pp
- All cycles
- 2024: R+6.4 2020: R+3.5 2016: R+9.2 2012: R+5.0 2008: D+0.1
Not yet ingested
- Civics
- —
Market trends
- HPI YoY
- ▬ -0.00%
- Current HPI
- 246.1249
- Rent YoY
- —
- Metro
- —
- State GDP YoY
- ▲ 2.05%
- F500 in state
- 2
Industry mix (Fortune 500 HQ in OR)
| Industry | F500 HQs | Revenue |
|---|---|---|
| Consumer Goods | 1 | $51B |
|
||
Price history
+505.3% since first listed9 events — show timeline
- 2026-06-11 Listed $115,000 MLSCO
- 2020-04-26 Listing Removed — MLSCO
- 2020-04-26 Listing Removed — MLSCO
- 2017-11-22 Sold (Public Records) $50,000 Public Records
- 1997-02-19 Listed $225,000 MLSCO
- 1996-10-01 Listed $250,000 MLSCO
- 1990-01-16 Sold (Public Records) $20,000 Public Records
- 1988-08-17 Sold (Public Records) $25,000 Public Records
- 1987-09-15 Sold (Public Records) $19,000 Public Records
Property tax history
+11.5%/yrLatest (2025): $738 · +17.7% YoY. Source: county tax records.
Cash-flow waterfall
monthlySold comps — $/sqft
last 12 mo · ≤1 miLoading sold comps…