 Multi-family
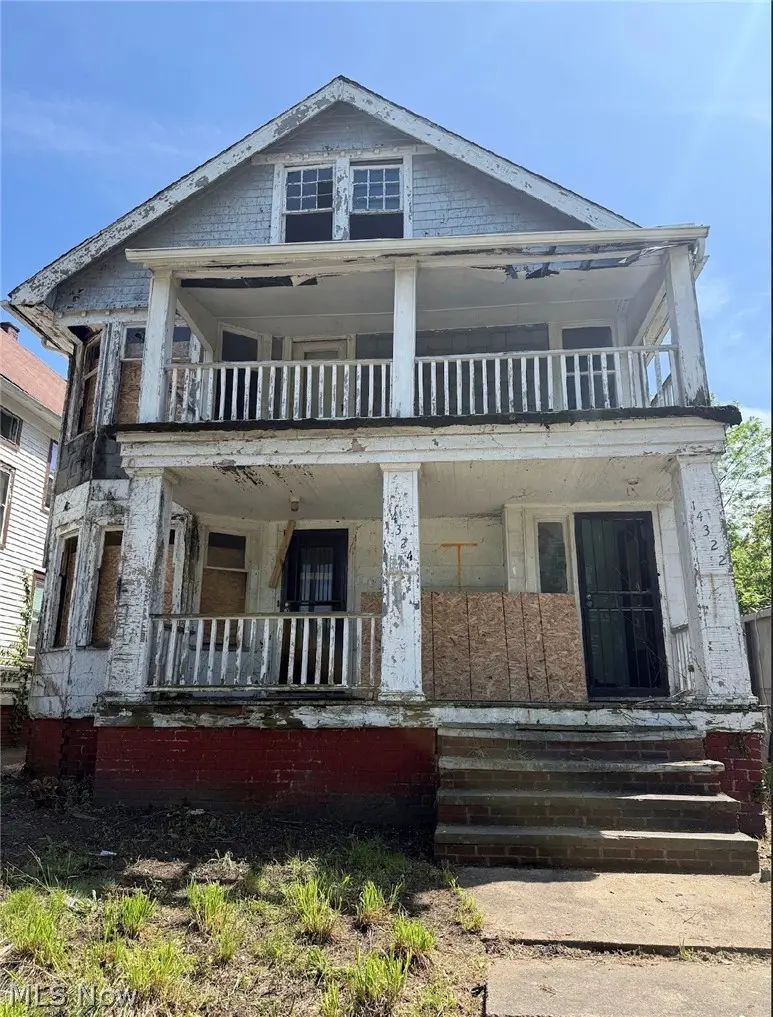
14322 Potomac Ave · East Cleveland, OH
Flood risk 1/10 · Minimal
- FEMA flood zone
- X (unshaded)
- Chance of flooding over 30 yrs
- 0.0%
- Est. flood insurance / yr
- $507 – $1,088
Fire risk 1/10 · Minimal
- Est. fire insurance / yr
- $713 – $1,323
Heat risk 3/10 · Minor
- Hot days now (above 95°F)
- 7 days/yr
- Hot days in 30 yrs
- 17 days/yr
Wind risk 1/10 · Minimal
- Chance of severe wind over 30 yrs
- —
Air-quality risk 3/10 · Minor
- Unhealthy air days now
- 3 days/yr
- Unhealthy air days in 30 yrs
- 5 days/yr
Risk factors via First Street. Map © Google.
Why this score? — see what drove the D+ grade
The composite is a weighted blend of 9 inputs, each scored 0–100. Each bar is that input's sub-score; the figure is the points it added to the 100-point composite (weight × sub-score).
- Cash flow +15.0/30.0
- ARV discount +13.3/15.0
- 1% rule +5.0/10.0
- DSCR +5.0/10.0
- Rent growth +3.8/5.0
- Livability +3.3/5.0
- Condition / age +2.5/5.0
- Schools +0.7/10.0
- Appreciation +0.0/10.0
$28,500
🖨 Deal sheet 📄 Offer letter ✓ Due diligence
Multi-family units
County records classify this as Multi-Family (2-4 Unit). Listing-text estimate: 1 unit. estimate disagrees with records
Listing remarks MLS
A great find in E. Cleveland. 4 Bed, 2 Bath duplex that has been owned and occupied by the same owners for over 30 years. Currently used as a single family but could easily be converted back to a duplex.
Key facts
- Full renovation
- Endless potential
- 3,149 sq ft lot
Tags
Property features AI
Finance
- Financial info: Annual tax noted (see listing for amount)
Exterior
- Parking: Asphalt driveway/parking
- Utilities: Public water; Public sewer; Public power available
- Home design: 2-story wood-sided home; Built year from public records
- Construction: Wood siding construction; Asphalt shingle roof; Concrete basement
- Exterior features: Asphalt parking surface; Lot recorded by assessor
Interior
- Bathrooms: 2 full bathrooms
- Heating & cooling: Forced air heating; Heating present
- Interior features: Has basement with concrete construction; Total of 10 rooms; Property listed as fixer condition
Neighborhood map
What this means for you Summary
Snapshot
- This is a 4-bed/2.0-bath multifamily listed at $28k.
Deal economics
- At list price, monthly cash flow is $1k ($12k/yr) — positive.
- The deal already cash-flows at list — no discount required.
- Meets the 1% rule at list price ($2k rent vs $28k).
- Recommended offer: $28k (1.5% below list) — sets the bar for market timing.
- Cap rate 49.6% vs local median 17.4% in East Cleveland — top-decile yield for the area; either an underpriced asset or a hidden risk that comps aren't pricing in. Stress-test before assuming the spread holds.
Location & tenants
- Location reads 66/100 on livability (#650 in OH) — a middle-class / working-renter tenant base. Strengths: commute A+, cost of living A+, health & safety A+; Watch: schools F, crime F, employment F.
- East Cleveland City School District (suburban): math 4% / reading 17% proficiency, ranked #652 of 656 in OH (top 99%) — low school quality limits family demand, transient renter base, plan for 1-2y turnover; 92% free/reduced lunch — lower-income household profile, screen leases tightly.
- Market conditions: Rents rising fast (+5.2%/yr); 99 active listings in the ZIP; 25 comparable units currently listed for rent nearby; rentals at typical pace (median 16d on market — plan ~3-4 weeks tenant-placement turnaround); lower-income renter base — watch delinquency; 1,441 units permitted in Cuyahoga County in 2024 (700 in 5+ unit buildings).
- At $1,563/mo this rent would consume 65% of the median local household income ($29k/yr) (locally 1702% of renters already pay >50% of income on rent) — very limited rent-growth headroom before tenants either downsize or default.
Forward outlook
- Local home prices are declining (-3.0%/yr); year-one equity from $197 of loan paydown is wiped out by about $855 of value loss. Plan a longer hold.
- Cuyahoga County population projected to shrink 8% by 2050 — rents likely to lag national; underwrite the cash flow, not the appreciation.
- At projected returns (-3.0% appreciation + 5.2% rent growth), your $8k cash investment doubles in ~1 year — after that, you're playing with house money.
Negotiation context
- It's been on market 21 days — a 2% lower offer ($28k) is reasonable based on typical stale-listing flexibility.
- 2 sale attempts since 10y ago; this cycle's ask has dropped $6k (19%) from the opening price — seller is motivated, your offer sets the floor, not the list.
- Current owner paid $10k; list at $28k implies a 185% gain — meaningful room to come down on a strong offer.
Risks & watch-outs
- Watch-outs: built in 1915 — expect roof / HVAC / electrical / plumbing capex.
Questions for the listing agent
- Built in 1915 — when were the roof, HVAC, electrical panel, plumbing, and water heater last replaced?
- Is there a deadline driving the sale (1031 exchange, divorce, estate, relocation)? That informs how much negotiation room exists.
- Schools are F-rated, which usually means shorter tenancies and higher turnover. Who's the typical renter profile here, and what's been the actual vacancy rate?
- Crime grade is F in this area — have there been break-ins, vandalism, or insurance claims at this property in the last 3 years? What carrier currently insures it and at what premium?
- The area grade is low — what's the realistic commute time and amenity access for the typical tenant pool here? Any planned neighborhood developments (good or bad) we should know about?
- What's the average days-on-market for RENTAL listings here right now (not sales)? A rising rental-DOM trend means longer vacancies and softer asking-rent achievability than the comps imply.
- What's the recent tenant-quality profile in this submarket — average credit score on applications, eviction rate, late-payment / NSF rate, and stable-employment percentage? A property-management company in the area should have these aggregated.
- How much new apartment / multifamily construction is in the pipeline within 1–3 miles? Heavy new supply (>2% of stock underway) typically softens rents 12–24 months out; light construction supports rent growth.
Investment metrics
- 1% rule
- 5.48% ✓
- Cap rate
- 49.60%
- Cash-on-cash
- 154.67%
- DSCR
- 7.88
- GRM
- 1.5
CMA / ARV
- ARV (on-the-fly)
- $32,724
- Comps found
- 8
Show comp detail 8 sales within ~0.75 mi
| Address | Dist | Beds/Ba | Sqft | Sold | Price | $/sf | Match |
|---|---|---|---|---|---|---|---|
| 14111 Savannah Ave | 0.14mi | 4/2.0 | 1,924 (+6%) | 2mo | $34,000 | $18 | 82 |
| 14810 Shaw Ave | 0.28mi | 4/2.0 | 1,698 (-7%) | 6mo | $35,000 | $21 | 70 |
| 14310 Potomac Ave | 0.02mi | 5/2.0 (+1) | 1,982 (+9%) | 12mo | $36,000 | $18 | 69 |
| 13436 Hartford Rd | 0.30mi | 4/2.0 | 1,920 (+6%) | 11mo | $89,500 | $47 | 67 |
| 14119 Bardwell Ave | 0.18mi | 4/2.5 | 1,582 (-13%) | 3mo | $9,975 | $6 | 65 |
| 14004 Savannah Ave | 0.17mi | 4/2.0 | 1,996 (+10%) | 13mo | $40,000 | $20 | 65 |
| 13428 Hartford Rd | 0.31mi | 4/2.0 | 1,988 (+9%) | 9mo | $34,000 | $17 | 62 |
| 13500 Third Ave | 0.45mi | 4/2.0 | 2,090 (+15%) | 16mo | $30,000 | $14 | 40 |
Match score weights: distance 35% · size 25% · config 20% · recency 20%. Top-matched comps best support the ARV.
Projected returns pro-forma
-3.0% appreciation · 5.16% rent growth · sell at horizon
- IRR
- —
- Equity multiple
- 9.07×
- Total profit
- $64,390
- Equity at exit
- $4,249
- IRR
- —
- Equity multiple
- 20.48×
- Total profit
- $155,421
- Equity at exit
- $2,464
Cash invested: $7,980 (down + closing). Projections, not guarantees.
Landlord ↔ Tenant lean methodology
- Overall (STATE)
- 73 Landlord-Friendly
- State Ohio
- 73 Landlord-Friendly · R+6
- County
- — inherits STATE
- City
- — inherits STATE
ZIP-level market 44112
- Rents YoY
- 5.2%
- Active inventory
- 99
- Price-to-rent
- 1.5×
Monthly cashflow live
- Estimated rent
- $1,563 high interval (Pro) →
- Mortgage (P&I)
- −$149
- Tax from tax record
- −$44 /mo · $534/yr
- Insurance
- −$12
- HOA
- −$0
- Vacancy / Maint / Mgmt
- −$328
- Net cashflow
- $1,029
Break-even live
UW: 25.0% down · 7.5% · 30yr · 1.5% tax · 5.0% vac · 8.0% maint · 8.0% mgmt
Financing live
Cash to close
- Down payment
- $7,125
- Closing costs
- $855
- Reserves months
- —
- Total cash needed
- —
Loan-product check · same deal, 3 products live
Conventional
25% down · 7.5% · 30yr
- Down + closing
- —
- Monthly P&I
- —
- Monthly cashflow
- —
- DSCR
- —
- Eligible?
- —
Personal DTI + credit; lowest rate.
DSCR
20% down · 8.5% · 30yr
- Down + closing
- —
- Monthly P&I
- —
- Monthly cashflow
- —
- DSCR
- —
- Eligible?
- —
No personal income docs; deal must DSCR.
Hard money
10% down · 12.0% · 12mo
- Down + closing
- —
- Monthly P&I
- —
- Monthly cashflow
- —
- DSCR
- —
- Eligible?
- —
Short-term bridge; refi at stabilization.
Rent comps 25 comps
| Address | Beds | Baths | Sqft | Rent | $/sqft | DOM | Units | Dist |
|---|---|---|---|---|---|---|---|---|
| 14200 Scioto Ave Cleveland, OH | 3.0 | 1.0 | 1256 | $1,350 | $1.07 | 16d | 1 | 0.11mi |
| 12819 Edmonton Ave Cleveland, OH | 4.0 | 1.0 | 1423 | $1,795 | $1.26 | 16d | 1 | 0.60mi |
| 15801 Hazel Rd Cleveland, OH | 3.0 | 1.5 | 1908 | $1,550 | $0.81 | 16d | 1 | 0.70mi |
| 16000 Terrace Rd Cleveland, OH | 1.0–3.0 | 1.0–2.0 | 1000 | $1,210 | $1.21 | 1d | 39 | 0.89mi |
| 910 Dresden Rd Cleveland, OH | 4.0 | 2.0 | 1839 | $1,800 | $0.98 | 16d | 1 | 0.89mi |
| 14120 Superior Ave Unit 4 East Cleveland, OH | 3.0 | 1.0 | 1408 | $1,350 | $0.96 | 43d | 1 | 0.97mi |
| 14120 Superior Ave Unit 1 East Cleveland, OH | 3.0 | 1.0 | 1400 | $1,350 | $0.96 | 10d | 1 | 0.97mi |
| 1229 Melbourne Rd Cleveland, OH | 5.0 | 1.5 | 1600 | $2,000 | $1.25 | 43d | 1 | 1.04mi |
| 651 E 115th St Cleveland, OH | 4.0 | 2.0 | 1550 | $1,800 | $1.16 | 21d | 1 | 1.20mi |
| 1024 Greyton Rd Cleveland, OH | 5.0 | 2.5 | 1800 | $2,500 | $1.39 | 43d | 1 | 1.20mi |
| 915 Nela View Rd Cleveland, OH | 4.0 | 1.0 | 1300 | $2,600 | $2.00 | 16d | 1 | 1.20mi |
| 3337 Sylvanhurst Rd Cleveland, OH | 3.0 | 1.0 | 1334 | $1,800 | $1.35 | 7d | 1 | 1.22mi |
| 983 Greyton Rd Cleveland, OH | 3.0 | 2.0 | 1457 | $1,495 | $1.03 | 16d | 1 | 1.23mi |
| 571 E 115th St Cleveland, OH | 4.0 | 2.0 | 2220 | $1,808 | $0.81 | 16d | 1 | 1.24mi |
| 821 Nela View Rd Cleveland, OH | 4.0 | 2.5 | 2178 | $2,100 | $0.96 | 7d | 1 | 1.28mi |
| 14120 Superior Rd Cleveland, OH | 3.0 | 1.0 | 1390 | $1,400 | $1.01 | 43d | 1 | 1.33mi |
| 3430 Winsford Rd Cleveland, OH | 4.0 | 1.5 | 1800 | $1,590 | $0.88 | 16d | 1 | 1.34mi |
| 963 Selwyn Rd Cleveland, OH | 4.0 | 1.0 | 1300 | $2,650 | $2.04 | 1d | 1 | 1.35mi |
| 3406 Henderson Rd Cleveland, OH | 4.0 | 1.5 | 1343 | $2,250 | $1.68 | 16d | 1 | 1.36mi |
| 2827 Avondale Ave Apt 2 Cleveland Heights, OH | 3.0 | 1.0 | 1680 | $1,275 | $0.76 | 23d | 1 | 1.44mi |
| 14172 Superior Rd Unit 1 Cleveland Heights, OH | 3.0 | 1.0 | 1446 | $1,295 | $0.90 | 23d | 1 | 1.44mi |
| 1641 Coventry Rd Cleveland, OH | 3.0 | 1.0 | 1848 | $1,200 | $0.65 | 16d | 1 | 1.47mi |
| 2401 N Taylor Rd Cleveland, OH | 3.0 | 1.0 | 1347 | $1,325 | $0.98 | 7d | 1 | 1.47mi |
| 1099 Woodview Rd Cleveland, OH | 4.0 | 1.0 | 1500 | $2,500 | $1.67 | 1d | 1 | 1.48mi |
| 1633 Eddington Rd Unit 1 Cleveland Heights, OH | 3.0 | 1.0 | 1538 | $1,100 | $0.72 | 23d | 1 | 1.48mi |
Listing history 19 events
-
2026-06-18days on market $28,500 Active 21 DOM
-
2026-06-17days on market $28,500 Active 20 DOM
-
2026-06-16days on market $28,500 Active 19 DOM
-
2026-06-15days on market $28,500 Active 18 DOM
-
2026-06-13days on market $28,500 Active 16 DOM
-
2026-06-13days on market $28,500 Active 15 DOM
-
2026-06-09days on market $28,500 Active 12 DOM
-
2026-06-08pricedays on market $28,500 Active 11 DOM
-
2026-06-07days on market $35,000 Active 10 DOM
-
2026-06-05days on market $35,000 Active 7 DOM
-
2026-06-03days on market $35,000 Active 6 DOM
-
2026-06-02days on market $35,000 Active 5 DOM
-
2026-06-01days on market $35,000 Active 4 DOM
-
2026-05-31days on market $35,000 Active 3 DOM
-
2026-05-28$35,000 Active
-
2017-02-10soldstatus $10,000 Sold 203-char remark
Show marketing remark (203 chars)
A great find in E. Cleveland. 4 Bed, 2 Bath duplex that has been owned and occupied by the same owners for over 30 years. Currently used as a single family but could easily be converted back to a duplex.
-
2016-12-19status Pending 203-char remark
Show marketing remark (203 chars)
A great find in E. Cleveland. 4 Bed, 2 Bath duplex that has been owned and occupied by the same owners for over 30 years. Currently used as a single family but could easily be converted back to a duplex.
-
2016-11-08price $17,500 203-char remark
Show marketing remark (203 chars)
A great find in E. Cleveland. 4 Bed, 2 Bath duplex that has been owned and occupied by the same owners for over 30 years. Currently used as a single family but could easily be converted back to a duplex.
-
2016-10-10$20,000 Active 203-char remark
Show marketing remark (203 chars)
A great find in E. Cleveland. 4 Bed, 2 Bath duplex that has been owned and occupied by the same owners for over 30 years. Currently used as a single family but could easily be converted back to a duplex.
ⓘ Source: listings_history table (triggers on properties + properties_extension) + one-shot
backfill from property_details.listing_events for pre-trigger history.
Tax reassessment forecast OH · Partial reset (capped growth)
- Current annual tax
- $534 · $44/mo
- Projected year-2 tax
- $534 · $44/mo
- Expected delta
- $0/yr ($0/mo · 0.0%)
ⓘ Screening estimate from a state-policy table — verify with the county assessor before closing.
Climate risk First Street
- Flood 1/10 Low FEMA zone X (unshaded) · 0% chance over 30 yrs
- Wildfire 1/10 Low
- Heat 3/10 Moderate 7 d/yr ≥95°F today · 17 d/yr by 30 yrs out
- Wind 1/10 Low
- Air quality 3/10 Moderate 3 unhealthy d/yr today · 5 by 30 yrs out
Nearby sold comps map
Loading sold comps map…
Walkable amenities ~0.75 mi
Loading nearby amenities…
Taxation est. · year 1
- Rental income
- $18,750
- − Mortgage interest
- −$1,596
- − Property taxes
- −$534
- − Insurance
- −$142
- − Repairs & maintenance
- −$1,500
- − Management
- −$1,500
- − Depreciation
- −$829
- Taxable income
- $12,648
- Est. tax owed @ 24.0%
- −$3,036
- After-tax cash flow
- $9,307/yr
For passive investors: Depreciation is non-cash, so a rental often shows a tax loss while cash-flowing — sheltering income. Rental losses are passive: they offset passive income freely, and up to $25,000/yr can offset ordinary (W-2) income if you actively participate and your MAGI is under $100k (phasing out to $0 by $150k); unused losses carry forward. On sale, claimed depreciation is recaptured at up to 25%, and gains may owe capital-gains tax (a 1031 exchange can defer both). Figures are a year-1 estimate at your 24.0% rate — not tax advice; consult a CPA.
Schools (NCES district)
- District
- East Cleveland City School District
- NCES district ID
- 3904390
- Math proficiency
- 4% ▼ -16.00%
- Reading proficiency
- 17% ▼ -13.00%
- Median HH income
- $22,726
- Composite
- 7.38/100
- National rank
- #9954
- State rank
- #652 of 656 in OH
Livability — East Cleveland
- Score
- 66/100
- State rank
- #650
- US rank
- #11510
Category grades
Schools grade is shown separately in the Schools card above.
Census & demographics
- Census place
- East Cleveland, OH
- County
- Cuyahoga County · 1,090,369 people
- City population
- 17,848
- Metro
- Cleveland-Elyria, OH
- Population (ZIP)
- 17,848
- Household income
- $28,799
- Rent vs Own
- Severe rent burden
- 1702.0
Population outlook (Cuyahoga County) Hauer SSP2
- Today (2025)
- 1,244,621 people
- By 2030
- 1,230,093 · -1.2%
- By 2040
- 1,189,108 · -4.5%
- By 2050
- 1,145,706 · -7.9%
- By 2075
- 1,076,557 · -13.5%
- By 2100
- 978,987 · -21.3%
Race, ethnicity, and origin ACS 2023
- Neighborhood character
- Predominantly Black (89%)
- Race & ethnicity
- Black 89% White 7% Two or more races 2% Hispanic / Latino 1%
- Common ancestry
- Lithuanian 1%
- Foreign-born
- 4% · Canada
- Languages at home
- 93% English-only · French/Haitian/Cajun 3% Spanish 2% Russian/Polish/Slavic 1%
Political lean MEDSL · Cuyahoga
- 2024 margin
- Solid D (+31.5) · D 65.4% · R 33.9%
- 2008→2024 swing
- -7.4pp toward R · 2008: 38.9pp · 2024: 31.5pp
- All cycles
- 2024: D+31.5 2020: D+34.1 2016: D+35.0 2012: D+38.7 2008: D+38.9
Not yet ingested
- Civics
- —
Market trends
- HPI YoY
- ▼ -115.61%
- Current HPI
- 67.2162
- Rent YoY
- ▲ 5.16%
- Metro
- Cleveland-Elyria, OH
- State GDP YoY
- ▲ 1.98%
- F500 in state
- 48
Industry mix (Fortune 500 HQ in OH)
| Industry | F500 HQs | Revenue |
|---|---|---|
| Insurance | 3 | $145B |
|
||
| Industrial Machinery | 3 | $49B |
|
||
| Financial Services | 3 | $24B |
|
||
| Consumer Goods | 2 | $93B |
|
||
| Aerospace / Defense | 2 | $47B |
|
||
| Utilities | 2 | $33B |
|
||
Price history
+75.0% since first listed5 events — show timeline
- 2026-05-28 Listed $35,000 MLSNOW
- 2017-02-10 Sold (MLS) $10,000 MLSNOW
- 2016-12-19 Pending — MLSNOW
- 2016-11-08 Price Changed $17,500 MLSNOW
- 2016-10-10 Listed $20,000 MLSNOW
Property tax history
+1.3%/yrLatest (2025): $534 · +0.0% YoY. Source: county tax records.
Cash-flow waterfall
monthlySold comps — $/sqft
last 12 mo · ≤1 miLoading sold comps…