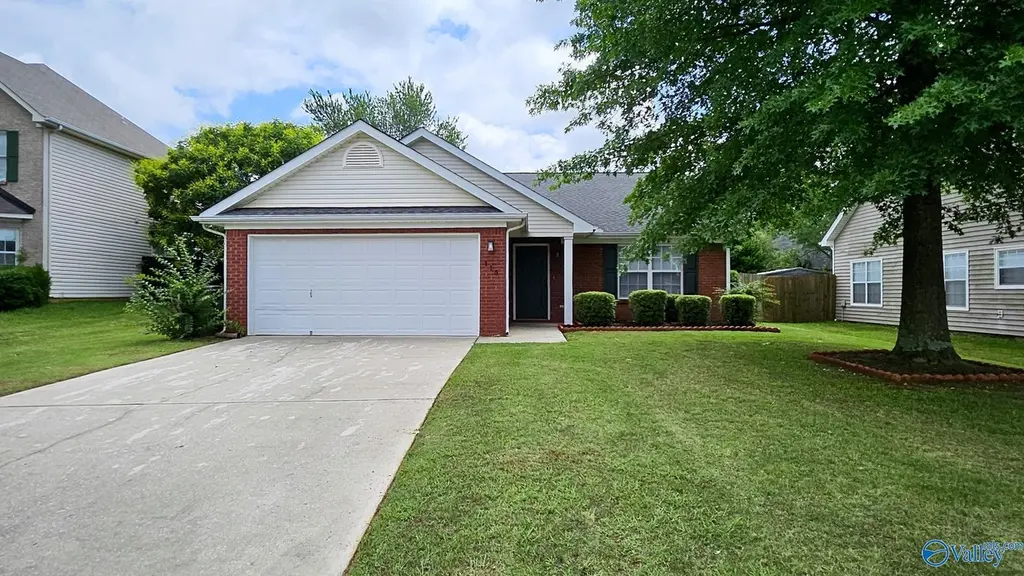
110 Lonesome Ct · Madison, AL
Flood risk 1/10 · Minimal
- FEMA flood zone
- X (unshaded)
- Chance of flooding over 30 yrs
- 0.0%
- Est. flood insurance / yr
- $507 – $1,088
Fire risk 3/10 · Minor
- Est. fire insurance / yr
- $916 – $1,700
Heat risk 6/10 · Moderate
- Hot days now (above 104°F)
- 7 days/yr
- Hot days in 30 yrs
- 19 days/yr
Wind risk 4/10 · Minor
- Chance of severe wind over 30 yrs
- 16.0%
Air-quality risk 2/10 · Minimal
- Unhealthy air days now
- 1 days/yr
- Unhealthy air days in 30 yrs
- 1 days/yr
Risk factors via First Street. Map © Google.
Why this score? — see what drove the D grade
The composite is a weighted blend of 9 inputs, each scored 0–100. Each bar is that input's sub-score; the figure is the points it added to the 100-point composite (weight × sub-score).
- Appreciation +10.0/10.0
- Cash flow +7.2/30.0
- ARV discount +6.5/15.0
- Schools +5.6/10.0
- Livability +3.8/5.0
- Rent growth +2.9/5.0
- Condition / age +2.5/5.0
- 1% rule +1.4/10.0
- DSCR +1.3/10.0
$296,500
🖨 Deal sheet (PDF) 📄 Offer letter ✓ Due diligence
Listing remarks
Welcome home to this beautifully updated 3-bedroom, 2-bathroom property offering modern finishes and a fantastic location! Step inside to discover brand-new waterproof LVP flooring, fresh interior paint, and stunning new granite countertops throughout the home. New lighting, faucets, and fixtures provide a stylish, move-in-ready feel from top to bottom. The floor plan offers comfortable living, while the attached 2-car garage provides ample storage and convenience. Ideally situated just minutes from the heart of Madison and less than 15 minutes from Huntsville, you'll enjoy easy access to shopping, dining, entertainment, and major employers. With extensive updates already completed!
Key facts
- New lighting
- 7,840 sq ft lot
- 2 garage spots
Tags
Property features AI
Finance
- HOA & community: No homeowners association; Subdivision: Eastfield At Homestead
Exterior
- Parking: Two-car garage; Concrete driveway
- Utilities: Public water; Public sewer; Electric service
- Home design: Single-family residence; One-story; Residential property; Built in 1998
- Construction: Brick construction; Slab foundation
- Exterior features: Covered porch
Interior
- Kitchen: Range; Dishwasher; Microwave; Refrigerator
- Bathrooms: 2 full bathrooms
- Heating & cooling: Central heating; Central cooling
- Interior features: 8 total rooms
- Laundry & utility: Electric water heater
Neighborhood map
What this means for you Summary
Snapshot
- This is a 3-bed/1.0-bath single-family listed at $296k.
Deal economics
- At list price, monthly cash flow is $-414 ($-5k/yr) — negative.
- To cash-flow at today's rent, offer at most $223k (24.7% below list).
- To meet the 1% rule (rent ≥ 1% of price), the offer needs to be $189k (36.1% below list).
- Recommended offer: $189k (36.1% below list) — sets the bar for 1% rule.
- Cap rate 4.6% vs local median 2.6% in Madison — top-decile yield for the area; either an underpriced asset or a hidden risk that comps aren't pricing in. Stress-test before assuming the spread holds.
Location & tenants
- Location reads 76/100 on livability (#12 in AL, #3,280 nationally) — a middle-class / working-renter tenant base. Strengths: employment A+, housing A+, crime B+; Watch: amenities F, commute F.
- Madison City (suburban): math 51% / reading 71% proficiency, ranked #4 of 129 in AL (top 3%) — acceptable for families but not a draw, mixed tenant base, ~2y average lease; only 17% free/reduced lunch — higher-income household profile.
- Zoned schools: Columbia Elementary School (math 52% / reading 77%, grade B, #43 of 627 statewide, top 7%, 784 students, 23% FRL); Discovery Middle School (math 46% / reading 69%, grade B, #13 of 257 statewide, top 5%, 1,334 students, 25% FRL); Bob Jones High School (math 53% / reading 51%, grade D+, #11 of 305 statewide, top 4%, 1,920 students, 24% FRL).
- Market conditions: Rents rising (+1.6%/yr); 390 active listings in the ZIP; 38 comparable units currently listed for rent nearby; rentals at typical pace (median 26d on market — plan ~3-4 weeks tenant-placement turnaround); high-income renter base; 4,709 units permitted in Madison County in 2024 (1,186 in 5+ unit buildings).
Forward outlook
- In year one you build about $32k of equity ($2k loan paydown + $30k appreciation (10.0% local appreciation)).
- Madison County population projected at +18% by 2050 — long-run rental-demand tailwind backs the buy-and-hold thesis.
- By year 2, paydown + projected appreciation supports a ~$51k cash-out refi (75% LTV) — recoverable capital for the next deal without selling this one.
Negotiation context
- It's been on market 19 days — a 2% lower offer ($292k) is reasonable based on typical stale-listing flexibility.
Risks & watch-outs
- Climate carrying-cost: extreme-heat days projected 7→19/yr by 2055 (HVAC capex compounding) — expect insurance premiums to compound above CPI over the hold.
Questions for the listing agent
- What do current leases actually rent for vs. the listed asking? Can we see a recent rent roll and the last 12 months of T-12 income?
- Is there a deadline driving the sale (1031 exchange, divorce, estate, relocation)? That informs how much negotiation room exists.
- Schools are A-rated — typically a magnet for longer-tenancy family renters. What's the average tenant stay here, and is there a school-zone premium baked into asking?
- The area grade is low — what's the realistic commute time and amenity access for the typical tenant pool here? Any planned neighborhood developments (good or bad) we should know about?
- What's the average days-on-market for RENTAL listings here right now (not sales)? A rising rental-DOM trend means longer vacancies and softer asking-rent achievability than the comps imply.
- What's the recent tenant-quality profile in this submarket — average credit score on applications, eviction rate, late-payment / NSF rate, and stable-employment percentage? A property-management company in the area should have these aggregated.
- How much new for-sale + rental construction is in the pipeline within 1–3 miles? Heavy new supply typically softens prices + rents 12–24 months out; constrained supply supports both.
Investment metrics
- 1% rule
- 0.64% ✗
- Cap rate
- 4.62%
- Cash-on-cash
- -5.98%
- DSCR
- 0.73
- GRM
- 13.0
CMA / ARV
- ARV (on-the-fly)
- $290,055
- Comps found
- 12
Show comp detail 12 sales within ~0.75 mi
| Address | Dist | Beds/Ba | Sqft | Sold | Price | $/sf | Match |
|---|---|---|---|---|---|---|---|
| 102 Wildweed Ct | 0.08mi | 3/2.0 | 1,564 (-1%) | 1mo | $310,000 | $198 | 89 |
| 105 Prairie Ct | 0.24mi | 3/2.0 | 1,653 (+4%) | 4mo | $300,000 | $181 | 75 |
| 117 Sleepy Hollow Ln | 0.31mi | 3/2.0 | 1,567 (-1%) | 8mo | $293,000 | $187 | 73 |
| 531 Gooch Ln | 0.21mi | 3/2.0 | 1,619 (+2%) | 13mo | $292,000 | $180 | 72 |
| 107 Bitterweed Ct | 0.08mi | 3/2.5 | 1,684 (+6%) | 10mo | $289,135 | $172 | 72 |
| 107 Palomino Ct | 0.26mi | 3/2.0 | 1,723 (+9%) | 10mo | $315,000 | $183 | 61 |
| 105 Eastfield Dr | 0.11mi | 3/2.5 | 1,810 (+14%) | 13mo | $325,000 | $180 | 54 |
| 110 Kim Cir | 0.71mi | 3/2.0 | 1,565 (-1%) | 13mo | $276,000 | $176 | 50 |
| 248 Haystack Dr | 0.61mi | 3/2.0 | 1,761 (+11%) | 1mo | $444,700 | $253 | 48 |
| 240 Haystack Dr | 0.64mi | 3/2.0 | 1,761 (+11%) | 1mo | $439,900 | $250 | 46 |
| 104 Patra Dr | 0.62mi | 3/2.0 | 1,778 (+12%) | 3mo | $300,000 | $169 | 44 |
| 242 Haystack Dr | 0.63mi | 3/2.0 | 1,761 (+11%) | 8mo | $439,900 | $250 | 42 |
Match score weights: distance 35% · size 25% · config 20% · recency 20%. Top-matched comps best support the ARV.
Projected returns pro-forma
10.0% appreciation · 1.58% rent growth · sell at horizon
- IRR
- 19.7%
- Equity multiple
- 2.59×
- Total profit
- $132,391
- Equity at exit
- $267,111
- IRR
- 17.8%
- Equity multiple
- 5.88×
- Total profit
- $405,383
- Equity at exit
- $576,034
Cash invested: $83,020 (down + closing). Projections, not guarantees.
Landlord ↔ Tenant lean methodology
- Overall (STATE)
- 90 Strongly Landlord-Friendly
- State Alabama
- 90 Strongly Landlord-Friendly · R+15
- County
- — inherits STATE
- City
- — inherits STATE
ZIP-level market 35758
- Home prices YoY
- 4.2%
- Rents YoY
- 1.6%
- Active inventory
- 390
- Price-to-rent
- 13.0×
Monthly cashflow live
- Estimated rent
- $1,895 high interval (Pro) →
- Mortgage (P&I)
- −$1,555
- Tax from tax record
- −$232 /mo · $2,786/yr
- Insurance
- −$124
- HOA
- −$0
- Vacancy / Maint / Mgmt
- −$398
- Net cashflow
- $-414
Break-even live
Sensitivity live
| Price | -10% $-246 | -5% $-330 | +0% $-414 | +5% $-498 | +10% $-582 |
|---|---|---|---|---|---|
| Rent | -10% $-564 | -5% $-489 | +0% $-414 | +5% $-339 | +10% $-264 |
| Rate | -1.0pp $-265 | -0.5pp $-339 | base $-414 | +0.5pp $-491 | +1.0pp $-569 |
UW: 25.0% down · 7.5% · 30yr · 1.5% tax · 5.0% vac · 8.0% maint · 8.0% mgmt
Financing live
Cash to close
- Down payment
- $74,125
- Closing costs
- $8,895
- Reserves months
- —
- Total cash needed
- —
Loan-product check · same deal, 3 products live
Conventional
25% down · 7.5% · 30yr
- Down + closing
- —
- Monthly P&I
- —
- Monthly cashflow
- —
- DSCR
- —
- Eligible?
- —
Personal DTI + credit; lowest rate.
DSCR
20% down · 8.5% · 30yr
- Down + closing
- —
- Monthly P&I
- —
- Monthly cashflow
- —
- DSCR
- —
- Eligible?
- —
No personal income docs; deal must DSCR.
Hard money
10% down · 12.0% · 12mo
- Down + closing
- —
- Monthly P&I
- —
- Monthly cashflow
- —
- DSCR
- —
- Eligible?
- —
Short-term bridge; refi at stabilization.
Rent comps 38 comps
| Address | Beds | Baths | Sqft | Rent | $/sqft | DOM | Units | Dist |
|---|---|---|---|---|---|---|---|---|
| 110 Wildweed Ct Madison, AL | 3.0 | 2.0 | 1481 | $1,750 | $1.18 | 45d | 1 | 0.05mi |
| 111 Tumbleweed Dr Madison, AL | 4.0 | 2.0 | 2010 | $2,450 | $1.22 | 15d | 1 | 0.41mi |
| 649 Gooch Ln Madison, AL | 4.0 | 2.0 | 1913 | $2,061 | $1.08 | 45d | 1 | 0.49mi |
| 333 Hay Rake Dr Madison, AL | 3.0 | 2.5 | 2047 | $2,200 | $1.07 | 15d | 1 | 0.57mi |
| 333 Hay Rake Dr Unit 1 Madison, AL | 3.0 | 3.0 | 2047 | $2,200 | $1.07 | 25d | 1 | 0.57mi |
| 318 Cornstalk CIR Madison, AL | 3.0 | 2.0 | 1837 | $1,895 | $1.03 | 25d | 1 | 0.76mi |
| 318 Cornstalk CIR Madison, AL | 3.0 | 2.0 | 1837 | $1,995 | $1.09 | 45d | 1 | 0.76mi |
| 206 Osceola Cir Madison, AL | 3.0 | 2.0 | 1850 | $1,850 | $1.00 | 45d | 1 | 0.77mi |
| 6079 Wall Triana Hwy Madison, AL | 3.0 | 2.0 | 1630 | $2,100 | $1.29 | 45d | 1 | 0.78mi |
| 311 Cornstalk Cir Madison, AL | 3.0 | 2.0 | 1850 | $1,995 | $1.08 | 45d | 1 | 0.78mi |
| 309 Cornstalk CIR Madison, AL | 3.0 | 2.0 | 1850 | $1,995 | $1.08 | 45d | 1 | 0.79mi |
| 204 Stockyard CIR Madison, AL | 4.0 | 2.0 | 2106 | $2,300 | $1.09 | 15d | 1 | 0.80mi |
| 1150 Balch Rd Madison, AL | 1.0–3.0 | 1.0–2.0 | 1020 | $1,616 | $1.58 | 23d | 50 | 0.82mi |
| 112 Willow Rose Ln Madison, AL | 4.0 | 2.0 | 2106 | $2,500 | $1.19 | 25d | 1 | 0.95mi |
| 106 Champions Green Dr Madison, AL | 3.0 | 2.0 | 1950 | $1,995 | $1.02 | 25d | 1 | 0.99mi |
| 1435 Balch Rd Madison, AL | 1.0–3.0 | 1.0–2.0 | 1061 | $1,755 | $1.65 | 15d | 24 | 1.01mi |
| 115 Clift Creek DR Madison, AL | 4.0 | 3.0 | 1943 | $2,495 | $1.28 | 15d | 1 | 1.06mi |
| 206 Stockyard CIR Madison, AL | 3.0 | 2.0 | 1703 | $2,234 | $1.31 | 45d | 1 | 1.07mi |
| 560 Jack Clift Blvd Madison, AL | 1.0–2.0 | 1.0–2.0 | 978 | $2,410 | $2.46 | 23d | 10 | 1.08mi |
| 207 Stockyard CIR Madison, AL | 4.0 | 3.0 | 1943 | $2,350 | $1.21 | 45d | 1 | 1.09mi |
| 104 Kings Cross Dr Madison, AL | 3.0 | 2.0 | 1905 | $2,050 | $1.08 | 25d | 1 | 1.14mi |
| 104 Kings Cross Dr Madison, AL | 3.0 | 2.0 | 1906 | $2,050 | $1.08 | 45d | 1 | 1.14mi |
| 117 Willow Bluff Dr Madison, AL | 3.0 | 2.0 | 1242 | $1,600 | $1.29 | 45d | 1 | 1.19mi |
| 5541 Promenade Point Pkwy NW Madison, AL | 1.0–3.0 | 1.0–2.0 | 1556 | $2,300 | $1.48 | 23d | 1 | 1.20mi |
| 403 Barrington Hills Dr Madison, AL | 4.0 | 2.0 | 1820 | $1,950 | $1.07 | 23d | 1 | 1.21mi |
| 5550 Promenade Point Pkwy Madison, AL | 1.0–3.0 | 1.0–2.0 | 968 | $1,404 | $1.45 | 15d | 13 | 1.22mi |
| 1542 Balch Rd Madison, AL | 1.0–3.0 | 1.0–2.0 | 1077 | $1,920 | $1.78 | 15d | 21 | 1.24mi |
| 237 Knox Creek Trl NW Madison, AL | 3.0 | 2.0 | 1280 | $1,650 | $1.29 | 25d | 1 | 1.24mi |
| 4095 Lawsons Ridge Dr Madison, AL | 1.0–3.0 | 1.0–2.0 | 1028 | $1,691 | $1.64 | 15d | 12 | 1.35mi |
| 500 Oval Ave NW Madison, AL | 2.0–4.0 | 2.5–3.0 | 1776 | $2,185 | $1.23 | 15d | 50 | 1.35mi |
| 102 McDermotts Way Madison, AL | 3.0 | 2.0 | 1462 | $1,675 | $1.15 | 16d | 1 | 1.37mi |
| 502 Creek Bed Cir NW Madison, AL | 4.0 | 2.5 | 2200 | $1,980 | $0.90 | 45d | 1 | 1.42mi |
| 110 Fernwood Cir Madison, AL | 3.0 | 2.0 | 1410 | $1,398 | $0.99 | 45d | 1 | 1.43mi |
| 139 Angela Dr Madison, AL | 2.0 | 2.0 | 1160 | $995 | $0.86 | 16d | 1 | 1.45mi |
| 100 Edison Ave NW Madison, AL | 1.0–3.0 | 1.0–2.0 | 1025 | $1,820 | $1.77 | 15d | 26 | 1.46mi |
| 109 DuPont Cir Madison, AL | 3.0 | 2.0 | 1725 | $1,895 | $1.10 | 16d | 1 | 1.46mi |
| 330 Kenneth Blvd NW Madison, AL | 3.0 | 2.0 | 1430 | $1,575 | $1.10 | 23d | 1 | 1.47mi |
| 1010 Elliston Pl NW Madison, AL | 3.0 | 1.0–2.0 | 1051 | $1,825 | $1.74 | 15d | 19 | 1.49mi |
Listing history 13 events
-
2026-06-22days on market $296,500 Active 19 DOM
-
2026-06-18days on market $296,500 Active 16 DOM
-
2026-06-17days on market $296,500 Active 15 DOM
-
2026-06-16days on market $296,500 Active 14 DOM
-
2026-06-15price $296,500 Active 13 DOM
-
2026-06-15days on market $298,500 Active 13 DOM
-
2026-06-14days on market $298,500 Active 11 DOM
-
2026-06-10days on market $298,500 Active 8 DOM
-
2026-06-09days on market $298,500 Active 7 DOM
-
2026-06-08days on market $298,500 Active 6 DOM
-
2026-06-07days on market $298,500 Active 5 DOM
-
2026-06-03remarks 692-char remark
-
2026-06-03$298,500 Active 1 DOM
ⓘ Source: listings_history table (triggers on properties + properties_extension) + one-shot
backfill from property_details.listing_events for pre-trigger history.
Tax reassessment forecast AL · Resets to sale price
- Current annual tax
- $2,786 · $232/mo
- Projected year-2 tax
- $2,786 · $232/mo
- Expected delta
- $0/yr ($0/mo · 0.0%)
ⓘ Screening estimate from a state-policy table — verify with the county assessor before closing.
Climate risk First Street
- Flood 1/10 Low FEMA zone X (unshaded) · 0% chance over 30 yrs
- Wildfire 3/10 Moderate
- Heat 6/10 Major 7 d/yr ≥104°F today · 19 d/yr by 30 yrs out
- Wind 4/10 Moderate 16% chance of damaging wind over 30 yrs
- Air quality 2/10 Low 1 unhealthy d/yr today · 1 by 30 yrs out
Nearby sold comps map
Loading sold comps map…
Walkable amenities ~0.75 mi
Loading nearby amenities…
Taxation est. · year 1
- Rental income
- $22,734
- − Mortgage interest
- −$16,609
- − Property taxes
- −$2,786
- − Insurance
- −$1,482
- − Repairs & maintenance
- −$1,819
- − Management
- −$1,819
- − Depreciation
- −$8,625
- Taxable loss
- −$10,406
- Est. tax savings @ 24.0%
- +$2,497
- After-tax cash flow
- $-2,470/yr
For passive investors: Depreciation is non-cash, so a rental often shows a tax loss while cash-flowing — sheltering income. Rental losses are passive: they offset passive income freely, and up to $25,000/yr can offset ordinary (W-2) income if you actively participate and your MAGI is under $100k (phasing out to $0 by $150k); unused losses carry forward. On sale, claimed depreciation is recaptured at up to 25%, and gains may owe capital-gains tax (a 1031 exchange can defer both). Figures are a year-1 estimate at your 24.0% rate — not tax advice; consult a CPA.
Schools (NCES district)
- District
- Madison City
- NCES district ID
- 0100008
- Math proficiency
- 51% ▼ -25.00%
- Reading proficiency
- 71% ▼ -2.00%
- Median HH income
- $89,091
- Composite
- 55.56/100
- National rank
- #1238
- State rank
- #4 of 129 in AL
Livability — Madison
- Score
- 76/100
- State rank
- #12
- US rank
- #3280
Category grades
Schools grade is shown separately in the Schools card above.
Census & demographics
- Census place
- Madison, AL
- County
- Madison County · 380,832 people
- City population
- 93,742
- Metro
- Huntsville, AL
- Population (ZIP)
- 50,266
- Household income
- $117,380
- Rent vs Own
- Severe rent burden
- 875.0
Population outlook (Madison County) Hauer SSP2
- Today (2025)
- 392,086 people
- By 2030
- 409,788 · +4.5%
- By 2040
- 440,557 · +12.4%
- By 2050
- 460,990 · +17.6%
- By 2075
- 502,872 · +28.3%
- By 2100
- 513,623 · +31.0%
Race, ethnicity, and origin ACS 2023
- Neighborhood character
- Predominantly White (68%)
- Race & ethnicity
- White 68% Black 14% Hispanic / Latino 8% Asian 7% Two or more races 7%
- Hispanic origin (detail)
- Mexican 3% Puerto Rican 2%
- Common ancestry
- Slovak 3% Italian 2% Lithuanian 2%
- Foreign-born
- 9% · Canada, South Korea, Vietnam
- Languages at home
- 87% English-only · Spanish 5% Other Asian/Pacific 2% Chinese 1%
Political lean MEDSL · Madison
- 2024 margin
- Lean R (+9.0) · D 44.7% · R 53.7% · Other 1.6%
- 2008→2024 swing
- +6.0pp toward D · 2008: -14.9pp · 2024: -9.0pp
- All cycles
- 2024: R+9.0 2020: R+8.0 2016: R+16.8 2012: R+18.7 2008: R+14.9
Not yet ingested
- Civics
- —
Market trends
- HPI YoY
- ▲ 14.46%
- Current HPI
- 355.2784
- Rent YoY
- ▲ 1.58%
- Metro
- Huntsville, AL
- State GDP YoY
- ▲ 2.94%
- F500 in state
- 4
Industry mix (Fortune 500 HQ in AL)
| Industry | F500 HQs | Revenue |
|---|---|---|
| Financial Services | 1 | $8B |
|
||
| Healthcare | 1 | $5B |
|
||
Price history
1 event — show timeline
- 2026-06-02 Listed $298,500 VMLS
Property tax history
+7.0%/yrLatest (2024): $2,786 · +3.8% YoY. Source: county tax records.
Cash-flow waterfall
monthlySold comps — $/sqft
last 12 mo · ≤1 miLoading sold comps…