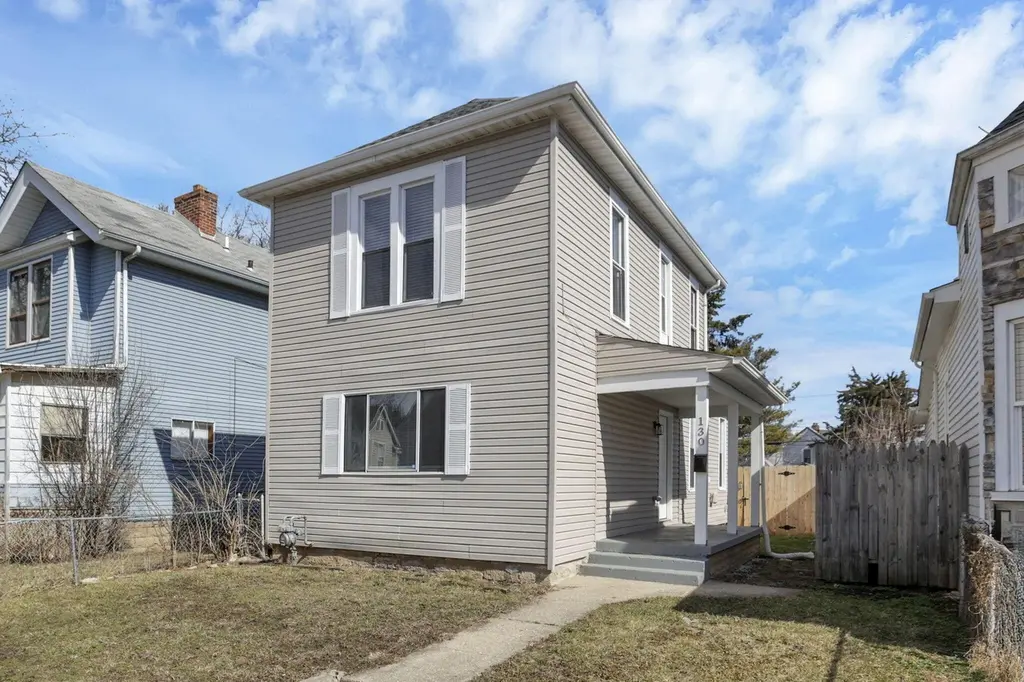
130 Chicago Ave · Columbus, OH
Flood risk 1/10 · Minimal
- FEMA flood zone
- X
- Chance of flooding over 30 yrs
- 0.0%
- Est. flood insurance / yr
- $473 – $860
Fire risk 1/10 · Minimal
- Est. fire insurance / yr
- $713 – $1,323
Heat risk 4/10 · Minor
- Hot days now (above 100°F)
- 7 days/yr
- Hot days in 30 yrs
- 18 days/yr
Wind risk 2/10 · Minimal
- Chance of severe wind over 30 yrs
- 1.0%
Air-quality risk 3/10 · Minor
- Unhealthy air days now
- 2 days/yr
- Unhealthy air days in 30 yrs
- 4 days/yr
Risk factors via First Street. Map © Google.
Why this score? — see what drove the C- grade
The composite is a weighted blend of 9 inputs, each scored 0–100. Each bar is that input's sub-score; the figure is the points it added to the 100-point composite (weight × sub-score).
- Cash flow +16.5/30.0
- Appreciation +10.0/10.0
- DSCR +5.1/10.0
- ARV discount +5.1/15.0
- Livability +4.0/5.0
- 1% rule +3.9/10.0
- Rent growth +2.5/5.0
- Condition / age +2.5/5.0
- Schools +1.7/10.0
$169,900
🖨 Deal sheet 📄 Offer letter ✓ Due diligence
Listing remarks MLS
Rapidly Appreciating Franklinton Property! Laminate vinyl floorings throughout the entirety of this property. New Furnace. Large back yard with a concrete parking pad large enough for 3 cars. A great property to keep as a rental, or renovate and sell as an easy flip. 24 hour notice for showings.
Key facts
- 4,356 sq ft lot
- Built 1900
- Listed 15 days
Property features AI
Finance
- HOA & community: Community sidewalks
Exterior
- Parking: On-street parking
- Utilities: Public water; Public sewer
- Home design: Single-family residence; Two stories; Built in 1900; No shared/common walls
- Construction: Block and stone foundation
- Exterior features: Fenced yard; Sidewalks in the community
Interior
- Bedrooms: One main-level bedroom
- Flooring: Vinyl flooring
- Bathrooms: One full bathroom
- Heating & cooling: Hot water heating
- Interior features: Decorative fireplace; Full basement
Neighborhood map
What this means for you Summary
Snapshot
- This is a 3-bed/1.0-bath single-family listed at $170k.
Deal economics
- At list price, monthly cash flow is $99 ($1k/yr) — positive.
- The deal already cash-flows at list — no discount required.
- To meet the 1% rule (rent ≥ 1% of price), the offer needs to be $151k (11.3% below list).
- Recommended offer: $151k (11.3% below list) — sets the bar for 1% rule.
- Cap rate 7.0% vs local median 3.8% in Columbus — top-decile yield for the area; either an underpriced asset or a hidden risk that comps aren't pricing in. Stress-test before assuming the spread holds.
Location & tenants
- Location reads 81/100 on livability (#97 in OH, #1,491 nationally) — a professional / high-income tenant draw. Strengths: commute A+, cost of living A+, housing A+; Watch: employment C-, crime F.
- Columbus City School District (urban): math 15% / reading 26% proficiency, ranked #626 of 656 in OH (top 95%) — low school quality limits family demand, transient renter base, plan for 1-2y turnover; 72% free/reduced lunch — lower-income household profile, screen leases tightly.
- Market conditions: 50 active listings in the ZIP; 40 comparable units currently listed for rent nearby; rentals at typical pace (median 24d on market — plan ~3-4 weeks tenant-placement turnaround); lower-income renter base — watch delinquency; 8,139 units permitted in Franklin County in 2024 (5,940 in 5+ unit buildings).
- At $1,508/mo this rent would consume 56% of the median local household income ($32k/yr) (locally 126% of renters already pay >50% of income on rent) — very limited rent-growth headroom before tenants either downsize or default.
Forward outlook
- In year one you build about $18k of equity ($1k loan paydown + $17k appreciation (10.0% local appreciation)).
- Franklin County population projected at +34% by 2050 — long-run rental-demand tailwind backs the buy-and-hold thesis.
- At projected returns (10.0% appreciation + 3.0% rent growth), your $48k cash investment doubles in ~3 years — after that, you're playing with house money.
- By year 3, paydown + projected appreciation supports a ~$46k cash-out refi (75% LTV) — recoverable capital for the next deal without selling this one.
Negotiation context
- It's been on market 15 days — a 2% lower offer ($167k) is reasonable based on typical stale-listing flexibility.
- 12 sale attempts since 22y ago with the ask held roughly flat each time — persistent listings suggest the price (not the market) is what's stuck; bring a comps-based counter.
- Current owner paid $137k; 24% above their basis — modest negotiation headroom, anchor on the comps not their cost.
Risks & watch-outs
- Watch-outs: built in 1900 — expect roof / HVAC / electrical / plumbing capex.
Questions for the listing agent
- Built in 1900 — when were the roof, HVAC, electrical panel, plumbing, and water heater last replaced?
- Is there a deadline driving the sale (1031 exchange, divorce, estate, relocation)? That informs how much negotiation room exists.
- Crime grade is F in this area — have there been break-ins, vandalism, or insurance claims at this property in the last 3 years? What carrier currently insures it and at what premium?
- What's the average days-on-market for RENTAL listings here right now (not sales)? A rising rental-DOM trend means longer vacancies and softer asking-rent achievability than the comps imply.
- What's the recent tenant-quality profile in this submarket — average credit score on applications, eviction rate, late-payment / NSF rate, and stable-employment percentage? A property-management company in the area should have these aggregated.
- How much new for-sale + rental construction is in the pipeline within 1–3 miles? Heavy new supply typically softens prices + rents 12–24 months out; constrained supply supports both.
Investment metrics
- 1% rule
- 0.89% ✗
- Cap rate
- 6.99%
- Cash-on-cash
- 2.49%
- DSCR
- 1.11
- GRM
- 9.4
CMA / ARV
- ARV (on-the-fly)
- $161,280
- Comps found
- 12
Show comp detail 12 sales within ~0.75 mi
| Address | Dist | Beds/Ba | Sqft | Sold | Price | $/sf | Match |
|---|---|---|---|---|---|---|---|
| 67 N Central Ave | 0.25mi | 3/1.5 | 1,176 (+2%) | 1mo | $78,000 | $66 | 82 |
| 121 Chicago Ave | 0.03mi | 2/1.5 (-1) | 1,234 (+7%) | 4mo | $178,000 | $144 | 76 |
| 76 N Central Ave | 0.22mi | 3/1.5 | 1,254 (+9%) | 2mo | $67,000 | $53 | 72 |
| 155 Schultz Ave | 0.46mi | 3/1.0 | 1,100 (-4%) | 7mo | $164,000 | $149 | 65 |
| 141 N Guilford Ave | 0.33mi | 2/1.0 (-1) | 1,232 (+7%) | 6mo | $80,000 | $65 | 63 |
| 32 Hayden Ave | 0.20mi | 3/1.5 | 1,320 (+15%) | 7mo | $184,480 | $140 | 59 |
| 373 Dana Ave | 0.73mi | 3/1.0 | 1,144 (-1%) | 7mo | $112,000 | $98 | 59 |
| 104 S Cypress Ave | 0.43mi | 3/2.0 | 1,276 (+11%) | 4mo | $269,900 | $212 | 55 |
| 139 S Princeton Ave | 0.39mi | 2/1.0 (-1) | 1,034 (-10%) | 8mo | $195,000 | $189 | 53 |
| 211 S Princeton Ave | 0.49mi | 3/1.5 | 1,280 (+11%) | 5mo | $186,000 | $145 | 52 |
| 309 Dana Ave | 0.64mi | 3/2.0 | 1,222 (+6%) | 6mo | $158,700 | $130 | 51 |
| 112 S Cypress Ave | 0.44mi | 3/1.5 | 1,320 (+15%) | 4mo | $157,500 | $119 | 50 |
Match score weights: distance 35% · size 25% · config 20% · recency 20%. Top-matched comps best support the ARV.
Projected returns pro-forma
10.0% appreciation · 3.0% rent growth · sell at horizon
- IRR
- 26.1%
- Equity multiple
- 3.08×
- Total profit
- $98,798
- Equity at exit
- $153,059
- IRR
- 22.9%
- Equity multiple
- 7.01×
- Total profit
- $285,939
- Equity at exit
- $330,078
Cash invested: $47,572 (down + closing). Projections, not guarantees.
Landlord ↔ Tenant lean methodology
- Overall (STATE)
- 73 Landlord-Friendly
- State Ohio
- 73 Landlord-Friendly · R+6
- County
- — inherits STATE
- City
- — inherits STATE
ZIP-level market 43222
- Active inventory
- 50
- Price-to-rent
- 9.4×
Monthly cashflow live
- Estimated rent
- $1,508 high interval (Pro) →
- Mortgage (P&I)
- −$891
- Tax from tax record
- −$131 /mo · $1,568/yr
- Insurance
- −$71
- HOA
- −$0
- Vacancy / Maint / Mgmt
- −$317
- Net cashflow
- $99
Break-even live
UW: 25.0% down · 7.5% · 30yr · 1.5% tax · 5.0% vac · 8.0% maint · 8.0% mgmt
Financing live
Cash to close
- Down payment
- $42,475
- Closing costs
- $5,097
- Reserves months
- —
- Total cash needed
- —
Loan-product check · same deal, 3 products live
Conventional
25% down · 7.5% · 30yr
- Down + closing
- —
- Monthly P&I
- —
- Monthly cashflow
- —
- DSCR
- —
- Eligible?
- —
Personal DTI + credit; lowest rate.
DSCR
20% down · 8.5% · 30yr
- Down + closing
- —
- Monthly P&I
- —
- Monthly cashflow
- —
- DSCR
- —
- Eligible?
- —
No personal income docs; deal must DSCR.
Hard money
10% down · 12.0% · 12mo
- Down + closing
- —
- Monthly P&I
- —
- Monthly cashflow
- —
- DSCR
- —
- Eligible?
- —
Short-term bridge; refi at stabilization.
Rent comps 40 comps
| Address | Beds | Baths | Sqft | Rent | $/sqft | DOM | Units | Dist |
|---|---|---|---|---|---|---|---|---|
| 129 Chicago Ave Columbus, OH | 2.0 | 2.5 | 1260 | $1,895 | $1.50 | 23d | 1 | 0.01mi |
| 121 Chicago Ave Columbus, OH | 2.0 | 2.0 | 1234 | $1,550 | $1.26 | 43d | 1 | 0.02mi |
| 51 N Princeton Ave Columbus, OH | 3.0 | 1.0 | 1188 | $1,175 | $0.99 | 23d | 1 | 0.14mi |
| 85 N Yale Ave Columbus, OH | 3.0 | 1.0 | 1215 | $1,100 | $0.91 | 19d | 1 | 0.15mi |
| 85 N Yale Ave Columbus, OH | 3.0 | 1.0 | 1215 | $1,100 | $0.91 | 7d | 1 | 0.15mi |
| 73 Hayden Ave Columbus, OH | 2.0 | 1.0 | 894 | $1,350 | $1.51 | 7d | 1 | 0.17mi |
| 100 N Central Ave Columbus, OH | 2.0 | 1.0 | 932 | $1,043 | $1.12 | 43d | 1 | 0.19mi |
| 163 N Central Ave Columbus, OH | 2.0 | 2.5 | 1100 | $1,650 | $1.50 | 43d | 1 | 0.22mi |
| 137 N Guilford Ave Columbus, OH | 4.0 | 2.0 | 1456 | $1,850 | $1.27 | 43d | 1 | 0.30mi |
| 87-89 Dana Ave Columbus, OH | 2.0 | 1.0 | 948 | $1,100 | $1.16 | 21d | 1 | 0.33mi |
| 1137 W Broad St Columbus, OH | 1.0–2.0 | 1.0 | 770 | $1,860 | $2.42 | 43d | 1 | 0.34mi |
| 58 Stevens Ave Columbus, OH | 3.0 | 1.0 | 1176 | $1,250 | $1.06 | 43d | 1 | 0.36mi |
| 85 Stevens Ave Columbus, OH | 2.0 | 1.0 | 816 | $995 | $1.22 | 43d | 1 | 0.37mi |
| 76 Rodgers Ave Columbus, OH | 3.0 | 1.5 | 1422 | $1,695 | $1.19 | 23d | 1 | 0.39mi |
| 142 Dana Ave Unit 142 Columbus, OH | 2.0 | 1.0 | 700 | $825 | $1.18 | 43d | 1 | 0.40mi |
| 120 S Central Ave Columbus, OH | 1.0–3.0 | 1.0–2.0 | 944 | $1,295 | $1.37 | 14d | 12 | 0.41mi |
| 32 Schultz Ave Columbus, OH | 3.0 | 1.0 | 1218 | $1,250 | $1.03 | 21d | 1 | 0.44mi |
| 189 W Park Ave Unit 189 Columbus, OH | 3.0 | 2.0 | 1276 | $1,395 | $1.09 | 7d | 1 | 0.47mi |
| 153 S Cypress Ave Columbus, OH | 3.0 | 1.0 | 1472 | $1,650 | $1.12 | 7d | 1 | 0.49mi |
| 185 S Cypress Ave Columbus, OH | 2.0 | 1.0 | 1104 | $1,695 | $1.54 | 43d | 1 | 0.53mi |
| 125 Avondale Ave Columbus, OH | 3.0 | 1.5 | 1344 | $1,695 | $1.26 | 43d | 1 | 0.55mi |
| 80 S Souder Ave Columbus, OH | 2.0 | 1.0–2.0 | 744 | $1,713 | $2.30 | 2d | 47 | 0.71mi |
| 394 S Guilford Ave Columbus, OH | 3.0 | 1.5 | 1404 | $1,450 | $1.03 | 7d | 1 | 0.80mi |
| 411 S Yale Ave Columbus, OH | 2.0 | 1.0 | 784 | $1,425 | $1.82 | 43d | 1 | 0.80mi |
| 827 W Rich St Unit 827 Columbus, OH | 2.0 | 1.0 | 1078 | $1,175 | $1.09 | 23d | 1 | 0.82mi |
| 821 W Rich St Unit 821 Columbus, OH | 2.0 | 1.0 | 1078 | $1,175 | $1.09 | 23d | 1 | 0.83mi |
| 710 Grandview Crossing Way Columbus, OH | 2.0 | 1.0–2.0 | 706 | $2,240 | $3.17 | 1d | 5 | 0.84mi |
| 1314 City View Dr Columbus, OH | 1.0–3.0 | 1.0–2.0 | 961 | $3,539 | $3.68 | 1d | 51 | 0.85mi |
| 378 Hawkes Ave Columbus, OH | 3.0 | 2.0 | 1200 | $1,649 | $1.37 | 23d | 1 | 0.87mi |
| 1485 Walsh Ave Columbus, OH | 2.0 | 1.0 | 720 | $1,450 | $2.01 | 23d | 1 | 0.93mi |
| 108 Columbian Ave Unit B Columbus, OH | 2.0 | 1.0 | 820 | $900 | $1.10 | 7d | 1 | 0.94mi |
| 432 Catherine St Columbus, OH | 3.0 | 1.0 | 1073 | $1,325 | $1.23 | 14d | 1 | 0.96mi |
| 432 Catherine St Columbus, OH | 3.0 | 1.0 | 1073 | $1,325 | $1.23 | 12d | 1 | 0.96mi |
| 1444 City View Dr Columbus, OH | 1.0–2.0 | 1.0–2.0 | 883 | $2,621 | $2.97 | 1d | 38 | 0.97mi |
| 436 Catherine St Columbus, OH | 2.0 | 1.5 | 960 | $1,300 | $1.35 | 7d | 1 | 0.97mi |
| 622 W State St Columbus, OH | 2.0 | 2.0 | 1200 | $2,190 | $1.82 | 17d | 1 | 0.98mi |
| 741 Sullivant Ave Columbus, OH | 2.0 | 1.5 | 1250 | $1,290 | $1.03 | 23d | 1 | 0.98mi |
| 839 McClain Rd Unit B Columbus, OH | 2.0 | 1.0 | 960 | $1,895 | $1.97 | 7d | 1 | 1.03mi |
| 721 Grandview Crossing Way Columbus, OH | 2.0 | 1.0–2.0 | 701 | $2,068 | $2.95 | 2d | 8 | 1.03mi |
| 786 Thomas Ave Unit 786 Columbus, OH | 2.0 | 1.5 | 876 | $1,295 | $1.48 | 23d | 1 | 1.05mi |
Listing history 12 events
-
2026-06-18days on market $169,900 Active 15 DOM
-
2026-06-17days on market $169,900 Active 14 DOM
-
2026-06-16days on market $169,900 Active 13 DOM
-
2026-06-15days on market $169,900 Active 12 DOM
-
2026-06-13days on market $169,900 Active 10 DOM
-
2026-06-13pricedays on market $169,900 Active 9 DOM
-
2026-06-09days on market $174,900 Active 6 DOM
-
2026-06-08days on market $174,900 Active 5 DOM
-
2026-06-07days on market $174,900 Active 4 DOM
-
2026-06-03status $174,900 Active 1 DOM
-
2026-06-02remarks 699-char remark
-
2026-06-02$174,900 Coming Soon 1 DOM
ⓘ Source: listings_history table (triggers on properties + properties_extension) + one-shot
backfill from property_details.listing_events for pre-trigger history.
Tax reassessment forecast OH · Partial reset (capped growth)
- Current annual tax
- $1,568 · $131/mo
- Projected year-2 tax
- $2,109 · $176/mo
- Expected delta
- +$541/yr (+$45/mo · 34.5%)
ⓘ Screening estimate from a state-policy table — verify with the county assessor before closing.
Climate risk First Street
- Flood 1/10 Low FEMA zone X · 0% chance over 30 yrs
- Wildfire 1/10 Low
- Heat 4/10 Moderate 7 d/yr ≥100°F today · 18 d/yr by 30 yrs out
- Wind 2/10 Low 100% chance of damaging wind over 30 yrs
- Air quality 3/10 Moderate 2 unhealthy d/yr today · 4 by 30 yrs out
Nearby sold comps map
Loading sold comps map…
Walkable amenities ~0.75 mi
Loading nearby amenities…
Taxation est. · year 1
- Rental income
- $18,094
- − Mortgage interest
- −$9,517
- − Property taxes
- −$1,568
- − Insurance
- −$850
- − Repairs & maintenance
- −$1,448
- − Management
- −$1,448
- − Depreciation
- −$4,943
- Taxable loss
- −$1,677
- Est. tax savings @ 24.0%
- +$403
- After-tax cash flow
- $1,588/yr
For passive investors: Depreciation is non-cash, so a rental often shows a tax loss while cash-flowing — sheltering income. Rental losses are passive: they offset passive income freely, and up to $25,000/yr can offset ordinary (W-2) income if you actively participate and your MAGI is under $100k (phasing out to $0 by $150k); unused losses carry forward. On sale, claimed depreciation is recaptured at up to 25%, and gains may owe capital-gains tax (a 1031 exchange can defer both). Figures are a year-1 estimate at your 24.0% rate — not tax advice; consult a CPA.
Schools (NCES district)
- District
- Columbus City School District
- NCES district ID
- 3904380
- Math proficiency
- 15% ▼ -17.00%
- Reading proficiency
- 26% ▼ -12.00%
- Median HH income
- $38,483
- Composite
- 17.19/100
- National rank
- #9105
- State rank
- #626 of 656 in OH
Livability — Columbus
- Score
- 81/100
- State rank
- #97
- US rank
- #1491
Category grades
Schools grade is shown separately in the Schools card above.
Census & demographics
- Census place
- Columbus, OH
- County
- Franklin County · 1,351,780 people
- City population
- 612,189
- Metro
- Columbus, OH
- Population (ZIP)
- 4,819
- Household income
- $32,321
- Rent vs Own
- Severe rent burden
- 126.0
Population outlook (Franklin County) Hauer SSP2
- Today (2025)
- 1,456,139 people
- By 2030
- 1,556,890 · +6.9%
- By 2040
- 1,757,349 · +20.7%
- By 2050
- 1,950,539 · +34.0%
- By 2075
- 2,376,171 · +63.2%
- By 2100
- 2,636,796 · +81.1%
Race, ethnicity, and origin ACS 2023
- Neighborhood character
- Highly diverse neighborhood (Simpson 0.71)
- Race & ethnicity
- White 43% Hispanic / Latino 28% Two or more races 21% Black 18% Asian 2%
- Hispanic origin (detail)
- Mexican 1% Puerto Rican 16% Dominican 5%
- Common ancestry
- Lithuanian 1% Slovak 1% Ukrainian 1%
- Foreign-born
- 8% · Canada, South Korea
- Languages at home
- 86% English-only · Spanish 11% Korean 1% Russian/Polish/Slavic 0%
Political lean MEDSL · Franklin
- 2024 margin
- Strong D (+28.4) · D 63.7% · R 35.3% · Other 1.0%
- 2008→2024 swing
- +7.7pp toward D · 2008: 20.7pp · 2024: 28.4pp
- All cycles
- 2024: D+28.4 2020: D+31.4 2016: D+25.9 2012: D+21.7 2008: D+20.7
Not yet ingested
- Civics
- —
Market trends
- HPI YoY
- ▲ 231.44%
- Current HPI
- 654.0855
- Rent YoY
- —
- Metro
- Columbus, OH
- State GDP YoY
- ▲ 1.98%
- F500 in state
- 48
Industry mix (Fortune 500 HQ in OH)
| Industry | F500 HQs | Revenue |
|---|---|---|
| Insurance | 3 | $145B |
|
||
| Industrial Machinery | 3 | $49B |
|
||
| Financial Services | 3 | $24B |
|
||
| Consumer Goods | 2 | $93B |
|
||
| Aerospace / Defense | 2 | $47B |
|
||
| Utilities | 2 | $33B |
|
||
Price history
+338.3% since first listed37 events — show timeline
- 2026-06-01 Coming Soon $174,900 CBRMLS
- 2026-04-21 Price Changed $169,900 CBRMLS
- 2026-04-20 Rental Removed $1,500 APPFOLIO
- 2026-04-09 Price Changed $172,500 CBRMLS
- 2026-03-21 Relisted — CBRMLS
- 2026-03-09 Pending — CBRMLS
- 2026-03-09 Listing Removed — CBRMLS
- 2026-03-04 Listed $174,900 CBRMLS
- 2026-03-02 Coming Soon — CBRMLS
- 2025-12-16 Listed for Rent $1,500 APPFOLIO
- 2024-10-02 Rental Removed $1,600 RENTALBEAST
- 2024-09-27 Listed for Rent $1,600 RENTALBEAST
- 2024-09-27 Rental Removed $1,600 BUILDIUM
- 2024-09-17 Listed for Rent $1,600 BUILDIUM
- 2023-08-11 Sold (Public Records) $137,000 Public Records
- 2023-08-07 Sold (MLS) $137,000 CBRMLS
- 2023-07-24 Pending — CBRMLS
- 2023-07-20 Listed $135,000 CBRMLS
- 2021-12-29 Sold (MLS) $82,000 CBRMLS
- 2021-12-03 Pending — CBRMLS
- 2021-11-22 Price Changed $89,000 CBRMLS
- 2021-11-17 Listed $95,000 CBRMLS
- 2017-12-21 Sold (MLS) $35,000 CBRMLS
- 2017-12-11 Relisted — CBRMLS
- 2017-12-07 Listing Removed — CBRMLS
- 2017-10-27 Price Changed $39,900 CBRMLS
- 2017-10-20 Price Changed $44,900 CBRMLS
- 2017-09-25 Listed $49,900 CBRMLS
- 2013-05-15 Sold (Public Records) $182,400 Public Records
- 2011-05-16 Sold (Public Records) $39,000 Public Records
- 2005-12-16 Listing Removed — CBRMLS
- 2005-11-02 Listed $64,900 CBRMLS
- 2005-10-31 Listing Removed — CBRMLS
- 2005-08-17 Listed $64,900 CBRMLS
- 2005-02-10 Sold (Public Records) $25,000 Public Records
- 2005-01-01 Listing Removed — CBRMLS
- 2004-06-29 Listed $39,900 CBRMLS
Property tax history
+13.2%/yrLatest (2024): $1,568 · -0.8% YoY. Source: county tax records.
Cash-flow waterfall
monthlySold comps — $/sqft
last 12 mo · ≤1 miLoading sold comps…