 Fourplex
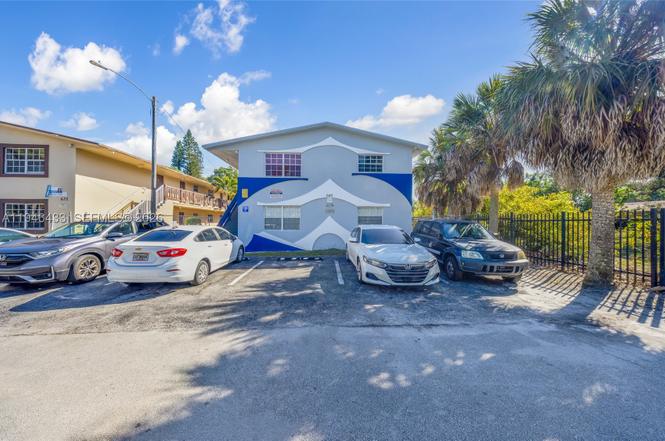
640 SW 16th Ave · Fort Lauderdale, FL
Flood risk 5/10 · Moderate
- FEMA flood zone
- AH
- Chance of flooding over 30 yrs
- 0.5%
- Est. flood insurance / yr
- $1,142 – $2,507
Fire risk 1/10 · Minimal
- Est. fire insurance / yr
- $947 – $1,759
Heat risk 10/10 · Severe
- Hot days now (above 105°F)
- 7 days/yr
- Hot days in 30 yrs
- 26 days/yr
Wind risk 10/10 · Severe
- Chance of severe wind over 30 yrs
- 99.0%
Air-quality risk 2/10 · Minimal
- Unhealthy air days now
- 2 days/yr
- Unhealthy air days in 30 yrs
- 2 days/yr
Risk factors via First Street. Map © Google.
Why this score? — see what drove the D- grade
The composite is a weighted blend of 9 inputs, each scored 0–100. Each bar is that input's sub-score; the figure is the points it added to the 100-point composite (weight × sub-score).
- Cash flow +10.5/30.0
- ARV discount +7.5/15.0
- Schools +4.1/10.0
- Livability +4.1/5.0
- 1% rule +3.1/10.0
- DSCR +3.0/10.0
- Rent growth +2.8/5.0
- Condition / age +2.5/5.0
- Appreciation +0.0/10.0
$1,450,000
🖨 Deal sheet 📄 Offer letter ✓ Due diligence
Multi-family units
County records classify this as Multi-Family (2-4 Unit). Listing-text estimate: 4 units. confirmed
Listing remarks MLS
Property is 4,868 Sq. Ft. and is on 7,000 Sq. Ft. lot. Building is composed of (2) 4 bedrooms & 2 bathrooms and (2) 3 bedrooms and 2 bathrooms. Property well maintained and individually metered. Laundry room on premises, free usage for tenants. New roo f under warranty, security cameras, central A/C in all units and hurricane shutters.
Key facts
- Two story fourplex
- Individually metered
- Freshly painted
Tags
Property features AI
Finance
- Other:
- Financial info: Actual rents reported: $3,010; $2,900; $2,700; $2,700
- HOA & community:
Exterior
- Parking: Total of 5 parking spaces (open parking)
- Security:
- Utilities: Cable available; Public water; Public sewer
- Home design: 2-story building; Zoned RM-15
- Construction: Block construction; Shingle roof; Resale property (year built details: resale)
- Exterior features: Less than quarter-acre lot; Open parking
Interior
- Kitchen:
- Bedrooms: Four-bedroom unit (1 unit); Four-bedroom unit (1 unit); Three-bedroom unit (1 unit); Three-bedroom unit (1 unit)
- Flooring: Tile
- Bathrooms: Each unit has 2 full bathrooms
- Heating & cooling: Central heating; Central air conditioning
- Interior features: Tile flooring
- Laundry & utility:
Neighborhood map
What this means for you Summary
Snapshot
- This is a 2×4bd/2.0ba + 2×3bd/2.0ba units multifamily listed at $1.45M.
Deal economics
- At list price, monthly cash flow is $-885 ($-11k/yr) — negative. Per door: $-221/mo.
- To cash-flow at today's rent, offer at most $1.32M (8.8% below list).
- To meet the 1% rule (rent ≥ 1% of price), the offer needs to be $1.18M (18.9% below list).
- Recommended offer: $1.18M (18.9% below list) — sets the bar for 1% rule.
- Cap rate 5.7% vs local median 2.2% in Fort Lauderdale — top-decile yield for the area; either an underpriced asset or a hidden risk that comps aren't pricing in. Stress-test before assuming the spread holds.
Location & tenants
- Location reads 82/100 on livability (#78 in FL, #1,293 nationally) — a professional / high-income tenant draw. Strengths: crime A+, amenities A+, health & safety A+; Watch: cost of living D-.
- Broward (suburban): math 42% / reading 53% proficiency, ranked #46 of 73 in FL (top 63%) — families likely to look elsewhere, expect single-tenant / working-renter base with shorter leases.
- Market conditions: Rents rising (+1.3%/yr); 412 active listings in the ZIP; solid renter incomes; 2,111 units permitted in Broward County in 2024 (1,265 in 5+ unit buildings).
- At $11,757/mo this rent would consume 186% of the median local household income ($76k/yr) (locally 1903% of renters already pay >50% of income on rent) — very limited rent-growth headroom before tenants either downsize or default.
Forward outlook
- Local home prices are declining (-3.0%/yr); year-one equity from $10k of loan paydown is wiped out by about $44k of value loss. Plan a longer hold.
- Broward County population projected at +34% by 2050 — long-run rental-demand tailwind backs the buy-and-hold thesis.
Negotiation context
- It's been on market 147 days — a 12% lower offer ($1.28M) is reasonable based on typical stale-listing flexibility.
- 4 sale attempts since 13y ago with the ask held roughly flat each time — persistent listings suggest the price (not the market) is what's stuck; bring a comps-based counter.
- Current owner paid $440k; list at $1.45M implies a 230% gain — meaningful room to come down on a strong offer.
Risks & watch-outs
- Watch-outs: flood insurance adds $152/mo.
- Climate carrying-cost: in FEMA flood zone AH (mandatory federal flood insurance); severe wind risk, 99% chance of damaging wind over 30y; extreme-heat days projected 7→26/yr by 2055 (HVAC capex compounding) — expect insurance premiums to compound above CPI over the hold.
Questions for the listing agent
- What do current leases actually rent for vs. the listed asking? Can we see a recent rent roll and the last 12 months of T-12 income?
- It's been on market 147 days. Have you received any prior offers? Is the seller open to a 19% concession, seller financing, or rate buy-down credit?
- Can we see the unit-by-unit rent roll, current vacancy, and any below-market leases? What's the average tenancy length?
- What capital expenditures (roof, boiler, parking lot, exteriors) have been made in the last 5 years, and what's planned in the next 2?
- Built in 1976 — when were the roof, HVAC, electrical panel, plumbing, and water heater last replaced?
- What's the actual annual flood-insurance premium (NFIP or private), and is the property in a SFHA with mandatory coverage?
- Why hasn't it sold? Are there any deal-killer items the seller is aware of (foundation, flood, title, zoning, code violations)?
- Is there a deadline driving the sale (1031 exchange, divorce, estate, relocation)? That informs how much negotiation room exists.
- Schools are B-rated — typically a magnet for longer-tenancy family renters. What's the average tenant stay here, and is there a school-zone premium baked into asking?
- The area grade is low — what's the realistic commute time and amenity access for the typical tenant pool here? Any planned neighborhood developments (good or bad) we should know about?
- What's the average days-on-market for RENTAL listings here right now (not sales)? A rising rental-DOM trend means longer vacancies and softer asking-rent achievability than the comps imply.
- What's the recent tenant-quality profile in this submarket — average credit score on applications, eviction rate, late-payment / NSF rate, and stable-employment percentage? A property-management company in the area should have these aggregated.
- How much new apartment / multifamily construction is in the pipeline within 1–3 miles? Heavy new supply (>2% of stock underway) typically softens rents 12–24 months out; light construction supports rent growth.
Investment metrics
- 1% rule
- 0.81% ✗
- Cap rate
- 5.69%
- Cash-on-cash
- -2.17%
- DSCR
- 0.90
- GRM
- 10.3
CMA / ARV
No comps found within radius.
Projected returns pro-forma
-3.0% appreciation · 1.3% rent growth · sell at horizon
- IRR
- -22.6%
- Equity multiple
- 0.23×
- Total profit
- $-310,811
- Equity at exit
- $216,200
- IRR
- -21.8%
- Equity multiple
- -0.04×
- Total profit
- $-420,522
- Equity at exit
- $125,369
Cash invested: $406,000 (down + closing). Projections, not guarantees.
Landlord ↔ Tenant lean methodology
- Overall (STATE)
- 87 Strongly Landlord-Friendly
- State Florida
- 87 Strongly Landlord-Friendly · R+3
- County
- — inherits STATE
- City
- — inherits STATE
ZIP-level market 33312
- Rents YoY
- 1.3%
- Active inventory
- 412
- Price-to-rent
- 38.4×
Monthly cashflow live
- Estimated rent
- $11,757 high interval (Pro) →
- Mortgage (P&I)
- −$7,604
- Tax est. 1.5%
- −$1,812 /mo · $21,750/yr
- Insurance
- −$604
- Flood insurance flood zone
- −$152 /mo · $1,824/yr
- HOA
- −$0
- Vacancy / Maint / Mgmt
- −$2,469
- Net cashflow
- $-885
Break-even live
4-unit breakdown (identical units grouped — click to expand)
| Units | Beds | Baths | Est. rent |
|---|---|---|---|
| 2× units | 4 | 2 | $6,286 |
| #1 | 4 | 2 | $3,143 |
| #2 | 4 | 2 | $3,143 |
| 2× units | 3 | 2 | $5,470 |
| #3 | 3 | 2 | $2,735 |
| #4 | 3 | 2 | $2,735 |
| Total (4 units) | $11,757 | ||
UW: 25.0% down · 7.5% · 30yr · 1.5% tax · 5.0% vac · 8.0% maint · 8.0% mgmt
Financing live
Cash to close
- Down payment
- $362,500
- Closing costs
- $43,500
- Reserves months
- —
- Total cash needed
- —
Loan-product check · same deal, 3 products live
Conventional
25% down · 7.5% · 30yr
- Down + closing
- —
- Monthly P&I
- —
- Monthly cashflow
- —
- DSCR
- —
- Eligible?
- —
Personal DTI + credit; lowest rate.
DSCR
20% down · 8.5% · 30yr
- Down + closing
- —
- Monthly P&I
- —
- Monthly cashflow
- —
- DSCR
- —
- Eligible?
- —
No personal income docs; deal must DSCR.
Hard money
10% down · 12.0% · 12mo
- Down + closing
- —
- Monthly P&I
- —
- Monthly cashflow
- —
- DSCR
- —
- Eligible?
- —
Short-term bridge; refi at stabilization.
Listing history 23 events
-
2026-06-18days on market $1,450,000 Active 147 DOM
-
2026-06-17days on market $1,450,000 Active 146 DOM
-
2026-06-16days on market $1,450,000 Active 145 DOM
-
2026-06-15days on market $1,450,000 Active 144 DOM
-
2026-06-13days on market $1,450,000 Active 142 DOM
-
2026-06-09days on market $1,450,000 Active 138 DOM
-
2026-06-07days on market $1,450,000 Active 136 DOM
-
2026-06-04days on market $1,450,000 Active 133 DOM
-
2026-06-03days on market $1,450,000 Active 132 DOM
-
2026-06-02days on market $1,450,000 Active 131 DOM
-
2026-06-01days on market $1,450,000 Active 130 DOM
-
2026-05-31days on market $1,450,000 Active 129 DOM
-
2026-02-06price $1,450,000
-
2026-01-22$1,500,000 Active
-
2025-11-09historical
-
2025-07-02price $1,750,000
-
2025-04-24status Active
-
2025-04-24historical Active Under Contract
-
2025-04-02status Pending
-
2024-12-30price $1,900,000
-
2024-09-13$2,300,000 Active
-
2014-08-08soldstatus $440,000 Sold 343-char remark
Show marketing remark (343 chars)
Property is 4,868 Sq. Ft. and is on 7,000 Sq. Ft. lot. Building is composed of (2) 4 bedrooms & 2 bathrooms and (2) 3 bedrooms and 2 bathrooms. Property well maintained and individually metered. Laundry room on premises, free usage for tenants. New roo f under warranty, security cameras, central A/C in all units and hurricane shutters.
-
2013-11-27$440,000 Active 343-char remark
Show marketing remark (343 chars)
Property is 4,868 Sq. Ft. and is on 7,000 Sq. Ft. lot. Building is composed of (2) 4 bedrooms & 2 bathrooms and (2) 3 bedrooms and 2 bathrooms. Property well maintained and individually metered. Laundry room on premises, free usage for tenants. New roo f under warranty, security cameras, central A/C in all units and hurricane shutters.
ⓘ Source: listings_history table (triggers on properties + properties_extension) + one-shot
backfill from property_details.listing_events for pre-trigger history.
Climate risk First Street
- Flood 5/10 Major FEMA zone AH · 50% chance over 30 yrs
- Wildfire 1/10 Low
- Heat 10/10 Extreme 7 d/yr ≥105°F today · 26 d/yr by 30 yrs out
- Wind 10/10 Extreme 99% chance of damaging wind over 30 yrs
- Air quality 2/10 Low 2 unhealthy d/yr today · 2 by 30 yrs out
Nearby sold comps map
Loading sold comps map…
Walkable amenities ~0.75 mi
Loading nearby amenities…
Taxation est. · year 1
- Rental income
- $141,084
- − Mortgage interest
- −$81,223
- − Property taxes
- −$21,750
- − Insurance
- −$9,074
- − Repairs & maintenance
- −$11,287
- − Management
- −$11,287
- − Depreciation
- −$42,182
- Taxable loss
- −$35,718
- Est. tax savings @ 24.0%
- +$8,572
- After-tax cash flow
- $-2,043/yr
For passive investors: Depreciation is non-cash, so a rental often shows a tax loss while cash-flowing — sheltering income. Rental losses are passive: they offset passive income freely, and up to $25,000/yr can offset ordinary (W-2) income if you actively participate and your MAGI is under $100k (phasing out to $0 by $150k); unused losses carry forward. On sale, claimed depreciation is recaptured at up to 25%, and gains may owe capital-gains tax (a 1031 exchange can defer both). Figures are a year-1 estimate at your 24.0% rate — not tax advice; consult a CPA.
Schools (NCES district)
- District
- Broward
- NCES district ID
- 1200180
- Math proficiency
- 42% ▼ -18.00%
- Reading proficiency
- 53% ▼ -5.00%
- Median HH income
- $52,139
- Composite
- 40.88/100
- National rank
- #3621
- State rank
- #46 of 73 in FL
Livability — Fort Lauderdale
- Score
- 82/100
- State rank
- #78
- US rank
- #1293
Category grades
Schools grade is shown separately in the Schools card above.
Census & demographics
- Census place
- Fort Lauderdale, FL
- County
- Broward County · 1,963,430 people
- City population
- 235,769
- Metro
- Miami-Fort Lauderdale-Pompano Beach, FL
- Population (ZIP)
- 52,798
- Household income
- $75,952
- Rent vs Own
- Severe rent burden
- 1903.0
Population outlook (Broward County) Hauer SSP2
- Today (2025)
- 2,207,033 people
- By 2030
- 2,360,704 · +7.0%
- By 2040
- 2,661,208 · +20.6%
- By 2050
- 2,946,698 · +33.5%
- By 2075
- 3,602,273 · +63.2%
- By 2100
- 3,970,984 · +79.9%
Race, ethnicity, and origin ACS 2023
- Neighborhood character
- Highly diverse neighborhood (Simpson 0.70)
- Race & ethnicity
- White 34% Hispanic / Latino 32% Black 29% Two or more races 20% Asian 2%
- Hispanic origin (detail)
- Mexican 2% Puerto Rican 5% Cuban 6% Salvadoran 1%
- Common ancestry
- Hispanic 6% Romanian 3% Italian 1%
- Foreign-born
- 33% · Canada, Jamaica, Dominican Republic
- Languages at home
- 59% English-only · Spanish 29% French/Haitian/Cajun 7% Other Indo-European 2%
Political lean MEDSL · Broward
- 2024 margin
- D (+17.0) · D 58.0% · R 41.0%
- 2008→2024 swing
- -17.8pp toward R · 2008: 34.7pp · 2024: 17.0pp
- All cycles
- 2024: D+17.0 2020: D+29.8 2016: D+35.0 2012: D+34.9 2008: D+34.7
Not yet ingested
- Civics
- —
Market trends
- HPI YoY
- ▼ -323.99%
- Current HPI
- 382.6298
- Rent YoY
- ▲ 1.30%
- Metro
- Miami-Fort Lauderdale-Pompano Beach, FL
- State GDP YoY
- ▲ 3.28%
- F500 in state
- 36
Industry mix (Fortune 500 HQ in FL)
| Industry | F500 HQs | Revenue |
|---|---|---|
| Industrial Technology | 2 | $29B |
|
||
| Insurance | 2 | $17B |
|
||
| Retail | 1 | $60B |
|
||
| Technology Distribution | 1 | $58B |
|
||
| Homebuilding | 1 | $35B |
|
||
| Technology Manufacturing | 1 | $35B |
|
||
Price history
+229.5% since first listed11 events — show timeline
- 2026-02-06 Price Changed $1,450,000 MARMLS
- 2026-01-22 Listed $1,500,000 MARMLS
- 2025-11-09 Listing Removed — MARMLS
- 2025-07-02 Price Changed $1,750,000 MARMLS
- 2025-04-24 Relisted — MARMLS
- 2025-04-24 Contingent — MARMLS
- 2025-04-02 Pending — MARMLS
- 2024-12-30 Price Changed $1,900,000 MARMLS
- 2024-09-13 Listed $2,300,000 MARMLS
- 2014-08-08 Sold (MLS) $440,000 MARMLS
- 2013-11-27 Listed $440,000 MARMLS
Cash-flow waterfall
monthlySold comps — $/sqft
last 12 mo · ≤1 miLoading sold comps…