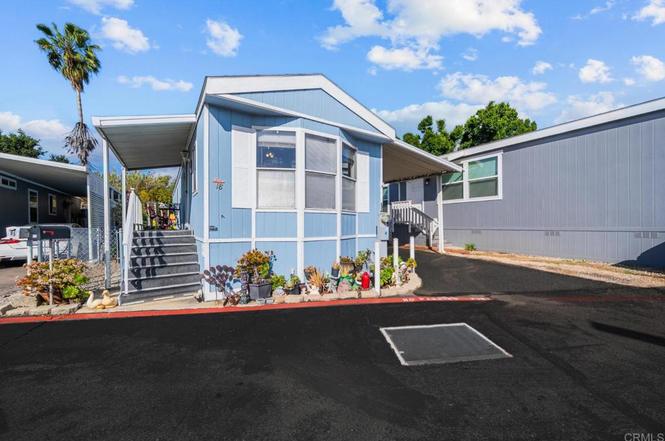
12044 Royal Rd Spc 18 · Winter Gardens, CA
Flood risk 1/10 · Minimal
- FEMA flood zone
- X (unshaded)
- Chance of flooding over 30 yrs
- 0.0%
- Est. flood insurance / yr
- $507 – $1,088
Fire risk 5/10 · Moderate
- Est. fire insurance / yr
- $659 – $1,223
Heat risk 5/10 · Moderate
- Hot days now (above 98°F)
- 5 days/yr
- Hot days in 30 yrs
- 14 days/yr
Wind risk 1/10 · Minimal
- Chance of severe wind over 30 yrs
- —
Air-quality risk 4/10 · Minor
- Unhealthy air days now
- 6 days/yr
- Unhealthy air days in 30 yrs
- 7 days/yr
Risk factors via First Street. Map © Google.
Why this score? — see what drove the B+ grade
The composite is a weighted blend of 9 inputs, each scored 0–100. Each bar is that input's sub-score; the figure is the points it added to the 100-point composite (weight × sub-score).
- Cash flow +30.0/30.0
- ARV discount +13.6/15.0
- 1% rule +10.0/10.0
- DSCR +10.0/10.0
- Schools +4.4/10.0
- Livability +3.1/5.0
- Condition / age +2.5/5.0
- Rent growth +2.3/5.0
- Appreciation +0.0/10.0
$109,000
🖨 Deal sheet 📄 Offer letter ✓ Due diligence
Listing remarks
Welcome to Westward Ho Manor Mobile Home Community, an all-ages park offering great amenities and convenience. This single-wide mobile home, built in 1998, features 2 bedrooms and 1 bathroom with an open-concept layout that creates a comfortable and functional living space. The home is original, offering a great opportunity for a buyer to personalize and add value. The kitchen includes appliances and opens to the main living area, making it ideal for everyday living. Additional features include an indoor laundry room, central heating, a storage shed, and two parking spaces. The current space rent is approximately $1,350 per month. The community offers excellent amenities including a clubhou
Key facts
- Central heating
- Clubhouse
- Two parking spaces
Tags
Property features AI
Finance
- HOA & community: Located in a mobile home community (Westward Ho Manor Mobile Home Community)
Exterior
- Parking: Two parking spaces; Two carport spaces
- Utilities: Public sewer
- Home design: Single-story manufactured/mobile home; Entry at front
- Construction: Mobile home dimensions approximately 13 ft by 56 ft; Single-story
- Exterior features: Community pool; Lot is level/flat; Has a view; One shed on the property; Located in Westward Ho Manor Mobile Home Community; Curbs in the community
Interior
- Bathrooms: One full bathroom
- Heating & cooling: Central cooling; Central furnace heating
- Interior features: Front entry on one level; All bedrooms on the same level; Has a spa
- Laundry & utility: Laundry inside the home
Neighborhood map
What this means for you Summary
Snapshot
- This is a 2-bed/1.0-bath manufactured listed at $109k.
Deal economics
- At list price, monthly cash flow is $975 ($12k/yr) — positive.
- The deal already cash-flows at list — no discount required.
- Meets the 1% rule at list price ($2k rent vs $109k).
- Recommended offer: $99k (9.0% below list) — sets the bar for market timing.
- Cap rate 17.0% vs local median 2.7% in Winter Gardens — top-decile yield for the area; either an underpriced asset or a hidden risk that comps aren't pricing in. Stress-test before assuming the spread holds.
Location & tenants
- Location reads 61/100 on livability (#515 in CA) — a middle-class / working-renter tenant base. Strengths: commute A+, employment A-, housing A-; Watch: schools C-, crime D-, amenities F.
- Lakeside Union Elementary (suburban): math 41% / reading 52% proficiency, ranked #480 of 1,400 in CA (top 34%) — families likely to look elsewhere, expect single-tenant / working-renter base with shorter leases.
- Market conditions: Rents soft (-0.8%/yr); 238 active listings in the ZIP; 7 comparable units currently listed for rent nearby; rentals leasing fast (median 2d on market — plan ~1-2 weeks tenant-placement turnaround); 11,759 units permitted in San Diego County in 2024 (7,244 in 5+ unit buildings).
- This rent runs 34% of the median local income ($74k/yr) — at the standard rent-burdened threshold; future hikes will face affordability resistance.
Forward outlook
- Local home prices are declining (-3.0%/yr); year-one equity from $754 of loan paydown is wiped out by about $3k of value loss. Plan a longer hold.
- San Diego County population projected at +20% by 2050 — long-run rental-demand tailwind backs the buy-and-hold thesis.
- At projected returns (-3.0% appreciation + 0.0% rent growth), your $31k cash investment doubles in ~4 years — after that, you're playing with house money.
Negotiation context
- It's been on market 103 days — a 9% lower offer ($99k) is reasonable based on typical stale-listing flexibility.
- 2 sale attempts; this cycle's ask has dropped $10k (8%) from the opening price — seller is motivated, your offer sets the floor, not the list.
Risks & watch-outs
- Climate carrying-cost: moderate wildfire risk; extreme-heat days projected 5→14/yr by 2055 (HVAC capex compounding) — expect insurance premiums to compound above CPI over the hold.
Questions for the listing agent
- It's been on market 103 days. Have you received any prior offers? Is the seller open to a 9% concession, seller financing, or rate buy-down credit?
- Why hasn't it sold? Are there any deal-killer items the seller is aware of (foundation, flood, title, zoning, code violations)?
- Is there a deadline driving the sale (1031 exchange, divorce, estate, relocation)? That informs how much negotiation room exists.
- Crime grade is D in this area — have there been break-ins, vandalism, or insurance claims at this property in the last 3 years? What carrier currently insures it and at what premium?
- What's the average days-on-market for RENTAL listings here right now (not sales)? A rising rental-DOM trend means longer vacancies and softer asking-rent achievability than the comps imply.
- What's the recent tenant-quality profile in this submarket — average credit score on applications, eviction rate, late-payment / NSF rate, and stable-employment percentage? A property-management company in the area should have these aggregated.
- How much new for-sale + rental construction is in the pipeline within 1–3 miles? Heavy new supply typically softens prices + rents 12–24 months out; constrained supply supports both.
Investment metrics
- 1% rule
- 1.91% ✓
- Cap rate
- 17.02%
- Cash-on-cash
- 38.32%
- DSCR
- 2.71
- GRM
- 4.4
CMA / ARV
- ARV (on-the-fly)
- $126,074
- Comps found
- 4
Show comp detail 4 sales within ~0.75 mi
| Address | Dist | Beds/Ba | Sqft | Sold | Price | $/sf | Match |
|---|---|---|---|---|---|---|---|
| 12044 Royal Rd #93 | 0.00mi | 2/1.0 | 800 (+7%) | 4mo | $135,000 | $169 | 85 |
| 12250 Vista Del Cajon Rd Spc 8 | 0.36mi | 2/1.0 | 770 (+3%) | 4mo | $130,000 | $169 | 75 |
| 12044 Royal Rd #51 | 0.00mi | 2/1.0 | 784 (+5%) | 20mo | $165,000 | $210 | 75 |
| 12044 Royal Rd | 0.06mi | 2/1.0 | 800 (+7%) | 20mo | $130,000 | $163 | 69 |
Match score weights: distance 35% · size 25% · config 20% · recency 20%. Top-matched comps best support the ARV.
Projected returns pro-forma
-3.0% appreciation · 0.0% rent growth · sell at horizon
- IRR
- 31.1%
- Equity multiple
- 2.25×
- Total profit
- $38,302
- Equity at exit
- $16,252
- IRR
- 36.7%
- Equity multiple
- 3.94×
- Total profit
- $89,652
- Equity at exit
- $9,424
Cash invested: $30,520 (down + closing). Projections, not guarantees.
Landlord ↔ Tenant lean methodology
- Overall (STATE)
- 18 Strongly Tenant-Friendly
- State California
- 18 Strongly Tenant-Friendly · D+13
- County
- — inherits STATE
- City
- — inherits STATE
ZIP-level market 92021
- Rents YoY
- -0.8%
- Active inventory
- 238
- Price-to-rent
- 4.4×
Monthly cashflow live
- Estimated rent
- $2,080 high interval (Pro) →
- Mortgage (P&I)
- −$572
- Tax from tax record
- −$51 /mo · $616/yr
- Insurance
- −$45
- HOA
- −$0
- Vacancy / Maint / Mgmt
- −$437
- Net cashflow
- $975
Break-even live
UW: 25.0% down · 7.5% · 30yr · 1.5% tax · 5.0% vac · 8.0% maint · 8.0% mgmt
Financing live
Cash to close
- Down payment
- $27,250
- Closing costs
- $3,270
- Reserves months
- —
- Total cash needed
- —
Loan-product check · same deal, 3 products live
Conventional
25% down · 7.5% · 30yr
- Down + closing
- —
- Monthly P&I
- —
- Monthly cashflow
- —
- DSCR
- —
- Eligible?
- —
Personal DTI + credit; lowest rate.
DSCR
20% down · 8.5% · 30yr
- Down + closing
- —
- Monthly P&I
- —
- Monthly cashflow
- —
- DSCR
- —
- Eligible?
- —
No personal income docs; deal must DSCR.
Hard money
10% down · 12.0% · 12mo
- Down + closing
- —
- Monthly P&I
- —
- Monthly cashflow
- —
- DSCR
- —
- Eligible?
- —
Short-term bridge; refi at stabilization.
Rent comps 7 comps
| Address | Beds | Baths | Sqft | Rent | $/sqft | DOM | Units | Dist |
|---|---|---|---|---|---|---|---|---|
| 1641 Greenfield Dr Unit 1641 El Cajon, CA | 1.0 | 1.0 | 600 | $1,900 | $3.17 | 2d | 1 | 0.93mi |
| 1546 Broadway El Cajon, CA | 1.0 | 1.0 | 625 | $1,745 | $2.79 | 2d | 1 | 1.17mi |
| 1294 N Mollison Ave El Cajon, CA | 1.0–2.0 | 1.0 | 750 | $2,128 | $2.84 | 2d | 8 | 1.37mi |
| 425 E Bradley Ave El Cajon, CA | 1.0–2.0 | 1.0 | 771 | $2,350 | $3.05 | 2d | 13 | 1.37mi |
| 1005 N Mollison Ave El Cajon, CA | 2.0 | 1.0 | 750 | $2,195 | $2.93 | 2d | 1 | 1.47mi |
| 310 E Bradley Ave El Cajon, CA | 1.0–2.0 | 1.0 | 664 | $2,050 | $3.09 | 2d | 1 | 1.49mi |
| 1037 Peach Ave El Cajon, CA | 1.0 | 1.0 | 560 | $1,694 | $3.03 | 2d | 4 | 1.50mi |
Listing history 11 events
-
2026-06-18days on market $109,000 Active 103 DOM
-
2026-06-17days on market $109,000 Active 102 DOM
-
2026-06-16days on market $109,000 Active 101 DOM
-
2026-06-15days on market $109,000 Active 100 DOM
-
2026-06-13days on market $109,000 Active 98 DOM
-
2026-06-10pricestatus $109,000 Active 94 DOM
-
2026-05-23status Pending Sale
-
2026-05-22status Active
-
2026-04-14status Pending Sale
-
2026-03-19price $105,000
-
2026-01-05$119,000 Active
ⓘ Source: listings_history table (triggers on properties + properties_extension) + one-shot
backfill from property_details.listing_events for pre-trigger history.
Tax reassessment forecast CA · Resets to sale price
- Current annual tax
- $616 · $51/mo
- Projected year-2 tax
- $828 · $69/mo
- Expected delta
- +$212/yr (+$18/mo · 34.5%)
ⓘ Screening estimate from a state-policy table — verify with the county assessor before closing.
Climate risk First Street
- Flood 1/10 Low FEMA zone X (unshaded) · 0% chance over 30 yrs
- Wildfire 5/10 Major
- Heat 5/10 Major 5 d/yr ≥98°F today · 14 d/yr by 30 yrs out
- Wind 1/10 Low
- Air quality 4/10 Moderate 6 unhealthy d/yr today · 7 by 30 yrs out
Nearby sold comps map
Loading sold comps map…
Walkable amenities ~0.75 mi
Loading nearby amenities…
Taxation est. · year 1
- Rental income
- $24,958
- − Mortgage interest
- −$6,106
- − Property taxes
- −$616
- − Insurance
- −$545
- − Repairs & maintenance
- −$1,997
- − Management
- −$1,997
- − Depreciation
- −$3,171
- Taxable income
- $10,527
- Est. tax owed @ 24.0%
- −$2,527
- After-tax cash flow
- $9,170/yr
For passive investors: Depreciation is non-cash, so a rental often shows a tax loss while cash-flowing — sheltering income. Rental losses are passive: they offset passive income freely, and up to $25,000/yr can offset ordinary (W-2) income if you actively participate and your MAGI is under $100k (phasing out to $0 by $150k); unused losses carry forward. On sale, claimed depreciation is recaptured at up to 25%, and gains may owe capital-gains tax (a 1031 exchange can defer both). Figures are a year-1 estimate at your 24.0% rate — not tax advice; consult a CPA.
Schools (NCES district)
- District
- Lakeside Union Elementary
- NCES district ID
- 0620790
- Math proficiency
- 41% ▬ 0.00%
- Reading proficiency
- 52% ▼ -1.00%
- Median HH income
- $65,574
- Composite
- 43.51/100
- National rank
- #6453
- State rank
- #480 of 1400 in CA
Livability — Winter Gardens
- Score
- 61/100
- State rank
- #515
- US rank
- #17448
Category grades
Schools grade is shown separately in the Schools card above.
Census & demographics
- Census place
- Winter Gardens, CA
- County
- San Diego County · 3,178,799 people
- Metro
- San Diego-Chula Vista-Carlsbad, CA
- Population (ZIP)
- 70,501
- Household income
- $74,013
- Rent vs Own
- Severe rent burden
- 4178.0
Population outlook (San Diego County) Hauer SSP2
- Today (2025)
- 3,678,185 people
- By 2030
- 3,856,546 · +4.8%
- By 2040
- 4,171,407 · +13.4%
- By 2050
- 4,421,607 · +20.2%
- By 2075
- 4,831,599 · +31.4%
- By 2100
- 4,832,502 · +31.4%
Race, ethnicity, and origin ACS 2023
- Neighborhood character
- Diverse neighborhood (Simpson 0.62)
- Race & ethnicity
- White 54% Hispanic / Latino 28% Two or more races 14% Black 6% Asian 5% Native American 2%
- Hispanic origin (detail)
- Mexican 24%
- Common ancestry
- Arab 6% Italian 2% Lithuanian 2%
- Foreign-born
- 22% · Canada
- Languages at home
- 65% English-only · Spanish 18% Arabic 7% Other Indo-European 3%
Political lean MEDSL · San Diego
- 2024 margin
- D (+16.8) · D 56.9% · R 40.1% · Other 2.9%
- 2008→2024 swing
- +6.6pp toward D · 2008: 10.2pp · 2024: 16.8pp
- All cycles
- 2024: D+16.8 2020: D+22.8 2016: D+17.8 2012: D+5.1 2008: D+10.2
Not yet ingested
- Civics
- —
Market trends
- HPI YoY
- ▼ -654.88%
- Current HPI
- 335.0617
- Rent YoY
- ▼ -0.83%
- Metro
- San Diego-Chula Vista-Carlsbad, CA
- State GDP YoY
- ▲ 3.21%
- F500 in state
- 116
Industry mix (Fortune 500 HQ in CA)
| Industry | F500 HQs | Revenue |
|---|---|---|
| Technology | 27 | $1,492B |
|
||
| Financial Services | 3 | $174B |
|
||
| Retail | 3 | $44B |
|
||
| Insurance | 3 | $26B |
|
||
| Media / Entertainment | 2 | $115B |
|
||
| Pharmaceuticals / Biotech | 2 | $62B |
|
||
Price history
-11.8% since first listed5 events — show timeline
- 2026-05-23 Pending — CRMLS
- 2026-05-22 Relisted — CRMLS
- 2026-04-14 Pending — CRMLS
- 2026-03-19 Price Changed $105,000 CRMLS
- 2026-01-05 Listed $119,000 CRMLS
Property tax history
+3.3%/yrLatest (2013): $616 · +3.7% YoY. Source: county tax records.
Cash-flow waterfall
monthlySold comps — $/sqft
last 12 mo · ≤1 miLoading sold comps…