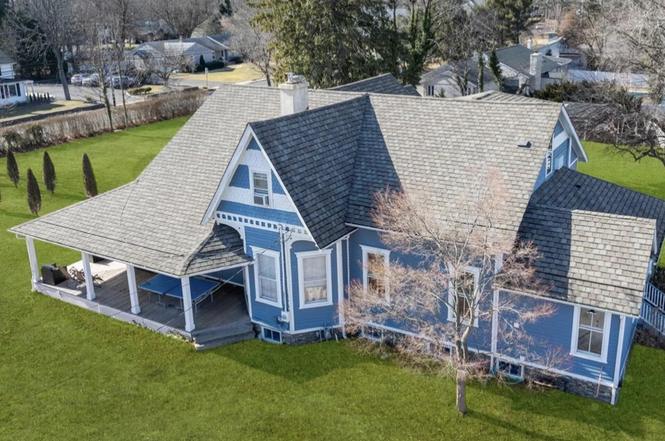
489 Cedar Ave #485 · West Long Branch, NJ
Flood risk 1/10 · Minimal
- FEMA flood zone
- X (unshaded)
- Chance of flooding over 30 yrs
- 0.0%
- Est. flood insurance / yr
- $473 – $860
Fire risk 1/10 · Minimal
- Est. fire insurance / yr
- $526 – $976
Heat risk 7/10 · Major
- Hot days now (above 93°F)
- 7 days/yr
- Hot days in 30 yrs
- 15 days/yr
Wind risk 8/10 · Major
- Chance of severe wind over 30 yrs
- 80.0%
Air-quality risk 3/10 · Minor
- Unhealthy air days now
- 3 days/yr
- Unhealthy air days in 30 yrs
- 4 days/yr
Risk factors via First Street. Map © Google.
Why this score? — see what drove the C+ grade
The composite is a weighted blend of 9 inputs, each scored 0–100. Each bar is that input's sub-score; the figure is the points it added to the 100-point composite (weight × sub-score).
- Cash flow +30.0/30.0
- 1% rule +10.0/10.0
- DSCR +10.0/10.0
- Schools +4.3/10.0
- Livability +3.5/5.0
- Rent growth +2.5/5.0
- Condition / age +2.5/5.0
- ARV discount +0.0/15.0
- Appreciation +0.0/10.0
$2,490,000
🖨 Deal sheet (PDF) 📄 Offer letter ✓ Due diligence
Listing remarks
Location, Location, Location! Larchwood/Cedar Avenue Corner Property. Rare opportunity to own over 1.1 acres on one of West Long Branch's most desirable intersections. This spacious 6-bedroom, 3-bath home offers over 3,700 square feet of living space and features an updated kitchen and baths, hardwood floors throughout, soaring ceilings, a large open floor plan, and a generous primary suite. Enjoy the charm of the home's wraparound balcony and the beauty of one of the area's largest residential parcels. Whether you're looking to move right in and enjoy, renovate, expand, or build your mansion, the possibilities are endless. The expansive property offers ample room for a pool, sports court,
Key facts
- Over 1.1 acres
- Sports court
- Wraparound balcony
Tags
Property features AI
Exterior
- Parking: No garage spaces
- Home design: Single-family property
- Exterior features: Shingle roof
Interior
- Bedrooms: 6 bedrooms
- Bathrooms: 3 full bathrooms
- Heating & cooling: Forced air heating; Central air conditioning
- Interior features: No fireplaces; Full walk-out basement
Neighborhood map
What this means for you Summary
Snapshot
- This is a 6-bed/3.0-bath single-family listed at $2.49M.
Deal economics
- At list price, monthly cash flow is $40k ($476k/yr) — positive.
- The deal already cash-flows at list — no discount required.
- Meets the 1% rule at list price ($70k rent vs $2.49M).
- Cap rate 25.4% vs local median 1.9% in West Long Branch — top-decile yield for the area; either an underpriced asset or a hidden risk that comps aren't pricing in. Stress-test before assuming the spread holds.
Location & tenants
- Location reads 70/100 on livability (#268 in NJ) — a middle-class / working-renter tenant base. Strengths: crime A+, employment A+, housing A+; Watch: amenities F, commute F, cost of living F.
- West Long Branch School District (suburban): math 37% / reading 55% proficiency, ranked #154 of 472 in NJ (top 33%) — families likely to look elsewhere, expect single-tenant / working-renter base with shorter leases; only 8% free/reduced lunch — higher-income household profile.
- Zoned schools: Betty Mcelmon Elementary School (math 42% / reading 52%, grade D-, #308 of 1,303 statewide, top 26%, 326 students, 14% FRL); Frank Antonides School (math 34% / reading 56%, grade D, #147 of 431 statewide, top 35%, 217 students, 15% FRL); Shore Regional High School (math 39% / reading 52%, grade D-, #138 of 399 statewide, top 36%, 585 students, 8% FRL) — zoned schools at 12% FRL track the district average.
- Market conditions: 48 active listings in the ZIP; 14 comparable units currently listed for rent nearby; rentals at typical pace (median 26d on market — plan ~3-4 weeks tenant-placement turnaround); 2,840 units permitted in Monmouth County in 2024 (484 in 5+ unit buildings).
Forward outlook
- Local home prices are declining (-3.0%/yr); year-one equity from $17k of loan paydown is wiped out by about $75k of value loss. Plan a longer hold.
- Monmouth County population projected at -11% by 2050 — secular population decline; favor cash flow + early exit over multi-decade hold.
- At projected returns (-3.0% appreciation + 3.0% rent growth), your $697k cash investment doubles in ~2 years — after that, you're playing with house money.
Negotiation context
- Only 6 days on market — expect competitive offers; lowballing is unlikely to land.
- Current owner paid $700k; list at $2.49M implies a 256% gain — meaningful room to come down on a strong offer.
Risks & watch-outs
- Watch-outs: built in 1949 — expect roof / HVAC / electrical / plumbing capex.
- Climate carrying-cost: severe wind risk, 80% chance of damaging wind over 30y; extreme-heat days projected 7→15/yr by 2055 (HVAC capex compounding) — expect insurance premiums to compound above CPI over the hold.
Questions for the listing agent
- Built in 1949 — when were the roof, HVAC, electrical panel, plumbing, and water heater last replaced?
- Is there a deadline driving the sale (1031 exchange, divorce, estate, relocation)? That informs how much negotiation room exists.
- Schools are A-rated — typically a magnet for longer-tenancy family renters. What's the average tenant stay here, and is there a school-zone premium baked into asking?
- What's the average days-on-market for RENTAL listings here right now (not sales)? A rising rental-DOM trend means longer vacancies and softer asking-rent achievability than the comps imply.
- What's the recent tenant-quality profile in this submarket — average credit score on applications, eviction rate, late-payment / NSF rate, and stable-employment percentage? A property-management company in the area should have these aggregated.
- How much new for-sale + rental construction is in the pipeline within 1–3 miles? Heavy new supply typically softens prices + rents 12–24 months out; constrained supply supports both.
Investment metrics
- 1% rule
- 2.82% ✓
- Cap rate
- 25.42%
- Cash-on-cash
- 68.31%
- DSCR
- 4.04
- GRM
- 3.0
CMA / ARV
- ARV (on-the-fly)
- $1,831,258
- Comps found
- 1
Show comp detail 1 sale within ~0.75 mi
| Address | Dist | Beds/Ba | Sqft | Sold | Price | $/sf | Match |
|---|---|---|---|---|---|---|---|
| 57 Hollywood Ave | 0.25mi | 6/3.5 | 3,848 (+4%) | 4mo | $1,900,000 | $494 | 77 |
Match score weights: distance 35% · size 25% · config 20% · recency 20%. Top-matched comps best support the ARV.
Projected returns pro-forma
-3.0% appreciation · 3.0% rent growth · sell at horizon
- IRR
- 67.7%
- Equity multiple
- 4.05×
- Total profit
- $2,124,587
- Equity at exit
- $371,267
- IRR
- 71.9%
- Equity multiple
- 8.32×
- Total profit
- $5,106,020
- Equity at exit
- $215,290
Cash invested: $697,200 (down + closing). Projections, not guarantees.
Landlord ↔ Tenant lean methodology
- Overall (STATE)
- 21 Tenant-Leaning
- State New Jersey
- 21 Tenant-Leaning · D+6
- County
- — inherits STATE
- City
- — inherits STATE
ZIP-level market 07764
- Home prices YoY
- -28.1%
- Active inventory
- 48
- Price-to-rent
- 3.0×
Monthly cashflow live
- Estimated rent
- $70,332 high interval (Pro) →
- Mortgage (P&I)
- −$13,058
- Tax from tax record
- −$1,777 /mo · $21,330/yr
- Insurance
- −$1,038
- HOA
- −$0
- Vacancy / Maint / Mgmt
- −$14,770
- Net cashflow
- $39,689
Break-even live
Sensitivity live
| Price | -10% $41,099 | -5% $40,394 | +0% $39,689 | +5% $38,985 | +10% $38,280 |
|---|---|---|---|---|---|
| Rent | -10% $34,133 | -5% $36,911 | +0% $39,689 | +5% $42,467 | +10% $45,246 |
| Rate | -1.0pp $40,943 | -0.5pp $40,323 | base $39,689 | +0.5pp $39,044 | +1.0pp $38,388 |
UW: 25.0% down · 7.5% · 30yr · 1.5% tax · 5.0% vac · 8.0% maint · 8.0% mgmt
Financing live
Cash to close
- Down payment
- $622,500
- Closing costs
- $74,700
- Reserves months
- —
- Total cash needed
- —
Loan-product check · same deal, 3 products live
Conventional
25% down · 7.5% · 30yr
- Down + closing
- —
- Monthly P&I
- —
- Monthly cashflow
- —
- DSCR
- —
- Eligible?
- —
Personal DTI + credit; lowest rate.
DSCR
20% down · 8.5% · 30yr
- Down + closing
- —
- Monthly P&I
- —
- Monthly cashflow
- —
- DSCR
- —
- Eligible?
- —
No personal income docs; deal must DSCR.
Hard money
10% down · 12.0% · 12mo
- Down + closing
- —
- Monthly P&I
- —
- Monthly cashflow
- —
- DSCR
- —
- Eligible?
- —
Short-term bridge; refi at stabilization.
Rent comps 14 comps
| Address | Beds | Baths | Sqft | Rent | $/sqft | DOM | Units | Dist |
|---|---|---|---|---|---|---|---|---|
| 64 Hollywood Ave West Long Branch, NJ | 6.0 | 4.0 | 4104 | $6,200 | $1.51 | 0d | 1 | 0.17mi |
| 7 Elinore Ave Long Branch, NJ | 5.0 | 2.0 | 2848 | $2,600 | $0.91 | 26d | 1 | 0.66mi |
| 279 Lake Ave Long Branch, NJ | 7.0 | 5.0 | 3252 | $90,000 | $27.68 | 26d | 1 | 0.75mi |
| 265 Norgrove Ave Long Branch, NJ | 5.0 | 4.0 | 2982 | $3,250 | $1.09 | 26d | 1 | 0.90mi |
| 60 Larchwood Ave Oakhurst, NJ | 6.0 | 3.0 | 2712 | $67,500 | $24.89 | 26d | 1 | 0.93mi |
| 216 Lenox Ave Long Branch, NJ | 5.0 | 2.5 | 2825 | $43,000 | $15.22 | 26d | 1 | 0.94mi |
| 25 Muncy Dr West Long Branch, NJ | 5.0 | 4.0 | 4347 | $99,000 | $22.77 | 23d | 1 | 0.98mi |
| 24 Valley Forge Rd Eatontown, NJ | 6.0 | 4.5 | 3934 | $4,500 | $1.14 | 0d | 1 | 1.14mi |
| 45 Roslyn Ct Long Branch, NJ | 7.0 | 3.5 | 2580 | $3,700 | $1.43 | 26d | 1 | 1.22mi |
| 20 Roslyn Dr Oakhurst, NJ | 6.0 | 4.5 | 2541 | $11,000 | $4.33 | 0d | 1 | 1.25mi |
| 58 Georgetown Rd Eatontown, NJ | 5.0 | 4.0 | 3665 | $57,000 | $15.55 | 23d | 1 | 1.32mi |
| 63 Jamestown Rd Eatontown, NJ | 6.0 | 3.5 | 2755 | $70,000 | $25.41 | 23d | 1 | 1.42mi |
| 223 Lewis St Oakhurst, NJ | 6.0 | 2.5 | 2499 | $4,000 | $1.60 | 26d | 1 | 1.48mi |
| 534 Apple Dr Oakhurst, NJ | 5.0 | 3.5 | 2919 | $45,000 | $15.42 | 25d | 1 | 1.49mi |
Listing history 5 events
-
2026-06-21days on market $2,490,000 Active 6 DOM
-
2026-06-18days on market $2,490,000 Active 3 DOM
-
2026-06-17days on market $2,490,000 Active 2 DOM
-
2026-06-15remarks 699-char remark
-
2026-06-15$2,490,000 Active 1 DOM
ⓘ Source: listings_history table (triggers on properties + properties_extension) + one-shot
backfill from property_details.listing_events for pre-trigger history.
Tax reassessment forecast NJ · Partial reset (capped growth)
- Current annual tax
- $21,330 · $1,777/mo
- Projected year-2 tax
- $41,665 · $3,472/mo
- Expected delta
- +$20,336/yr (+$1,695/mo · 95.3%)
ⓘ Screening estimate from a state-policy table — verify with the county assessor before closing.
Climate risk First Street
- Flood 1/10 Low FEMA zone X (unshaded) · 0% chance over 30 yrs
- Wildfire 1/10 Low
- Heat 7/10 Severe 7 d/yr ≥93°F today · 15 d/yr by 30 yrs out
- Wind 8/10 Severe 80% chance of damaging wind over 30 yrs
- Air quality 3/10 Moderate 3 unhealthy d/yr today · 4 by 30 yrs out
Nearby sold comps map
Loading sold comps map…
Walkable amenities ~0.75 mi
Loading nearby amenities…
Taxation est. · year 1
- Rental income
- $843,981
- − Mortgage interest
- −$139,479
- − Property taxes
- −$21,330
- − Insurance
- −$12,450
- − Repairs & maintenance
- −$67,518
- − Management
- −$67,518
- − Depreciation
- −$72,436
- Taxable income
- $463,250
- Est. tax owed @ 24.0%
- −$111,180
- After-tax cash flow
- $365,092/yr
For passive investors: Depreciation is non-cash, so a rental often shows a tax loss while cash-flowing — sheltering income. Rental losses are passive: they offset passive income freely, and up to $25,000/yr can offset ordinary (W-2) income if you actively participate and your MAGI is under $100k (phasing out to $0 by $150k); unused losses carry forward. On sale, claimed depreciation is recaptured at up to 25%, and gains may owe capital-gains tax (a 1031 exchange can defer both). Figures are a year-1 estimate at your 24.0% rate — not tax advice; consult a CPA.
Schools (NCES district)
- District
- West Long Branch School District
- NCES district ID
- 3417490
- Math proficiency
- 37% ▼ -26.00%
- Reading proficiency
- 55% ▼ -9.00%
- Median HH income
- $87,522
- Composite
- 42.99/100
- National rank
- #3108
- State rank
- #154 of 472 in NJ
Livability — West Long Branch
- Score
- 70/100
- State rank
- #268
- US rank
- #7916
Category grades
Schools grade is shown separately in the Schools card above.
Census & demographics
- Census place
- West Long Branch, NJ
- City population
- 8,576
- Population (ZIP)
- 8,576
Population outlook (Monmouth County) Hauer SSP2
- Today (2025)
- 620,308 people
- By 2030
- 612,309 · -1.3%
- By 2040
- 587,297 · -5.3%
- By 2050
- 551,342 · -11.1%
- By 2075
- 472,934 · -23.8%
- By 2100
- 381,534 · -38.5%
Race, ethnicity, and origin ACS 2023
- Neighborhood character
- Predominantly White (80%)
- Race & ethnicity
- White 80% Hispanic / Latino 7% Two or more races 6% Black 5% Asian 1%
- Hispanic origin (detail)
- Puerto Rican 3%
- Common ancestry
- Romanian 5% Estonian 2% Portuguese 2%
- Foreign-born
- 8% · Canada
- Languages at home
- 89% English-only · Other Indo-European 6% Spanish 3% Russian/Polish/Slavic 1%
Political lean MEDSL · Monmouth
- 2024 margin
- R (+11.4) · D 43.4% · R 54.8% · Other 1.8%
- 2008→2024 swing
- -7.7pp toward R · 2008: -3.7pp · 2024: -11.4pp
- All cycles
- 2024: R+11.4 2020: R+2.8 2016: R+9.5 2012: R+5.5 2008: R+3.7
Not yet ingested
- Civics
- —
Market trends
- HPI YoY
- ▼ -169.51%
- Current HPI
- 432.648
- Rent YoY
- —
- Metro
- —
- State GDP YoY
- ▲ 2.05%
- F500 in state
- 34
Industry mix (Fortune 500 HQ in NJ)
| Industry | F500 HQs | Revenue |
|---|---|---|
| Consumer Goods | 3 | $31B |
|
||
| Pharmaceuticals | 2 | $153B |
|
||
| Technology | 2 | $21B |
|
||
| Insurance | 2 | $20B |
|
||
| Healthcare | 2 | $19B |
|
||
| Financial Services | 1 | $70B |
|
||
Price history
+2390.0% since first listed6 events — show timeline
- 2026-06-15 Listed $2,490,000 MOMLS
- 2019-04-15 Sold (Public Records) $700,000 Public Records
- 2003-12-16 Sold (Public Records) $505,000 Public Records
- 1990-07-17 Sold (Public Records) $250,000 Public Records
- 1984-09-01 Sold (Public Records) $125,000 Public Records
- 1979-09-01 Sold (Public Records) $100,000 Public Records
Property tax history
+4.8%/yrLatest (2025): $21,330 · +4.6% YoY. Source: county tax records.
Cash-flow waterfall
monthlySold comps — $/sqft
last 12 mo · ≤1 miLoading sold comps…