 6-Plex
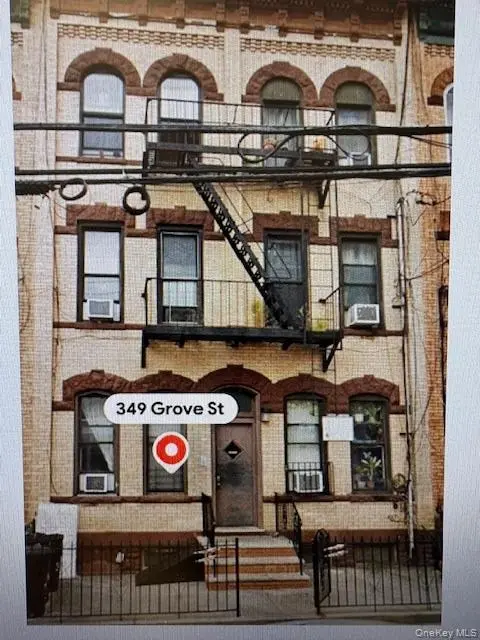
349 Grove St #6 · New York, NY
Flood risk 1/10 · Minimal
- FEMA flood zone
- X (unshaded)
- Chance of flooding over 30 yrs
- 0.0%
- Est. flood insurance / yr
- $507 – $1,088
Fire risk 1/10 · Minimal
- Est. fire insurance / yr
- $691 – $1,283
Heat risk 6/10 · Moderate
- Hot days now (above 99°F)
- 7 days/yr
- Hot days in 30 yrs
- 15 days/yr
Wind risk 6/10 · Moderate
- Chance of severe wind over 30 yrs
- 40.0%
Air-quality risk 5/10 · Moderate
- Unhealthy air days now
- 6 days/yr
- Unhealthy air days in 30 yrs
- 8 days/yr
Risk factors via First Street. Map © Google.
Why this score? — see what drove the A- grade
The composite is a weighted blend of 9 inputs, each scored 0–100. Each bar is that input's sub-score; the figure is the points it added to the 100-point composite (weight × sub-score).
- Cash flow +30.0/30.0
- 1% rule +10.0/10.0
- DSCR +10.0/10.0
- Appreciation +10.0/10.0
- ARV discount +7.5/15.0
- Schools +5.0/10.0
- Livability +3.8/5.0
- Rent growth +3.7/5.0
- Condition / age +2.5/5.0
$949,000
🖨 Deal sheet 📄 Offer letter ✓ Due diligence
Multi-family units
County records classify this as Multi-Family (5+ Unit). Listing-text estimate: 6 units. confirmed
5+ unit building — per-unit beds/baths from public records are typically unavailable; the breakdown below (if shown) is an estimate from the listing text.
Listing remarks
Three levels six units very clean well kept all paperwork in order. $103,000 gross income and $35,000 all expenses. long standing tenant and all up to date with rents. Apartment 1L will be delivered vacant. Walk to M, L, J trains and buses. Borderline of Wyckoff Heights Brooklyn and Ridgewood Queens.
Key facts
- Walk to m l j trains
- 2,500 sq ft lot
- Built 1931
Tags
Property features AI
Exterior
- Parking: On-street parking
- Utilities: Public sewer; Cable available; Electricity connected; Natural gas connected; Sewer connected; Water connected
- Home design: Triplex
- Construction: Brick construction
- Exterior features: Brick exterior; Not waterfront
Interior
- Bedrooms: Includes at least one first-floor bedroom
- Heating & cooling: Natural gas heating; Wall/window air conditioning units
- Interior features: First-floor bedroom; Unfinished basement
Neighborhood map
What this means for you Summary
Snapshot
- This is a 6 × 1-bed/1-bath units multifamily listed at $949k.
Deal economics
- At list price, monthly cash flow is $8k ($92k/yr) — positive. Per door: $1k/mo.
- The deal already cash-flows at list — no discount required.
- Meets the 1% rule at list price ($18k rent vs $949k).
- Recommended offer: $921k (3.0% below list) — sets the bar for market timing.
- Cap rate 15.9% vs local median 2.6% in New York — top-decile yield for the area; either an underpriced asset or a hidden risk that comps aren't pricing in. Stress-test before assuming the spread holds.
Location & tenants
- Location reads 75/100 on livability (#268 in NY, #4,188 nationally) — a middle-class / working-renter tenant base. Strengths: amenities A+, commute A+, health & safety A; Watch: crime F, cost of living F.
- Market conditions: Rents rising fast (+4.8%/yr); 56 active listings in the ZIP; 3 comparable units currently listed for rent nearby; rentals at typical pace (median 15d on market — plan ~3-4 weeks tenant-placement turnaround); solid renter incomes; 10,063 units permitted in Kings County in 2024 (9,789 in 5+ unit buildings).
- At $17,740/mo this rent would consume 250% of the median local household income ($85k/yr) (locally 4577% of renters already pay >50% of income on rent) — very limited rent-growth headroom before tenants either downsize or default.
Forward outlook
- In year one you build about $101k of equity ($7k loan paydown + $95k appreciation (10.0% local appreciation)).
- Kings County population projected at +13% by 2050 — modest demand growth; plan on rents tracking national, not racing it.
- At projected returns (10.0% appreciation + 4.8% rent growth), your $266k cash investment doubles in ~2 years — after that, you're playing with house money.
- By year 2, paydown + projected appreciation supports a ~$163k cash-out refi (75% LTV) — recoverable capital for the next deal without selling this one.
Negotiation context
- It's been on market 48 days — a 3% lower offer ($921k) is reasonable based on typical stale-listing flexibility.
- Current owner paid $200k; list at $949k implies a 374% gain — meaningful room to come down on a strong offer.
Risks & watch-outs
- Watch-outs: built in 1931 — expect roof / HVAC / electrical / plumbing capex.
- Climate carrying-cost: major wind risk, 40% chance of damaging wind over 30y; extreme-heat days projected 7→15/yr by 2055 (HVAC capex compounding) — expect insurance premiums to compound above CPI over the hold.
Questions for the listing agent
- It's been on market 48 days. Have you received any prior offers? Is the seller open to a 3% concession, seller financing, or rate buy-down credit?
- Can we see the unit-by-unit rent roll, current vacancy, and any below-market leases? What's the average tenancy length?
- What capital expenditures (roof, boiler, parking lot, exteriors) have been made in the last 5 years, and what's planned in the next 2?
- Built in 1931 — when were the roof, HVAC, electrical panel, plumbing, and water heater last replaced?
- Is there a deadline driving the sale (1031 exchange, divorce, estate, relocation)? That informs how much negotiation room exists.
- Schools are B-rated — typically a magnet for longer-tenancy family renters. What's the average tenant stay here, and is there a school-zone premium baked into asking?
- Crime grade is F in this area — have there been break-ins, vandalism, or insurance claims at this property in the last 3 years? What carrier currently insures it and at what premium?
- What's the average days-on-market for RENTAL listings here right now (not sales)? A rising rental-DOM trend means longer vacancies and softer asking-rent achievability than the comps imply.
- What's the recent tenant-quality profile in this submarket — average credit score on applications, eviction rate, late-payment / NSF rate, and stable-employment percentage? A property-management company in the area should have these aggregated.
- How much new apartment / multifamily construction is in the pipeline within 1–3 miles? Heavy new supply (>2% of stock underway) typically softens rents 12–24 months out; light construction supports rent growth.
Investment metrics
- 1% rule
- 1.87% ✓
- Cap rate
- 15.94%
- Cash-on-cash
- 34.47%
- DSCR
- 2.53
- GRM
- 4.5
CMA / ARV
- ARV (on-the-fly)
- $307,125
- Comps found
- 1
Show comp detail 1 sale within ~0.75 mi
| Address | Dist | Beds/Ba | Sqft | Sold | Price | $/sf | Match |
|---|---|---|---|---|---|---|---|
| 58 St Nicholas Ave | 0.57mi | 8/6.0 | 4,800 (-2%) | 3mo | $300,000 | $63 | 69 |
Match score weights: distance 35% · size 25% · config 20% · recency 20%. Top-matched comps best support the ARV.
Projected returns pro-forma
10.0% appreciation · 4.78% rent growth · sell at horizon
- IRR
- 51.8%
- Equity multiple
- 4.90×
- Total profit
- $1,035,483
- Equity at exit
- $854,934
- IRR
- 46.2%
- Equity multiple
- 11.30×
- Total profit
- $2,737,884
- Equity at exit
- $1,843,698
Cash invested: $265,720 (down + closing). Projections, not guarantees.
Landlord ↔ Tenant lean methodology
- Overall (CITY)
- 0 Strongly Tenant-Friendly
- State New York
- 15 Strongly Tenant-Friendly · D+10
- County
- — inherits STATE
- City New York
- 0 Strongly Tenant-Friendly · D+34
ZIP-level market 11237
- Home prices YoY
- 3.1%
- Rents YoY
- 4.8%
- Active inventory
- 56
- Price-to-rent
- 26.7×
Monthly cashflow live
- Estimated rent
- $17,740 high interval (Pro) →
- Mortgage (P&I)
- −$4,977
- Tax from tax record
- −$1,010 /mo · $12,116/yr
- Insurance
- −$395
- HOA
- −$0
- Vacancy / Maint / Mgmt
- −$3,725
- Net cashflow
- $7,633
Break-even live
6-unit breakdown (identical units grouped — click to expand)
| Units | Beds | Baths | Est. rent |
|---|---|---|---|
| 6× units | 1 | 1 | $17,742 |
| #1 | 1 | 1 | $2,957 |
| #2 | 1 | 1 | $2,957 |
| #3 | 1 | 1 | $2,957 |
| #4 | 1 | 1 | $2,957 |
| #5 | 1 | 1 | $2,957 |
| #6 | 1 | 1 | $2,957 |
| Total (6 units) | $17,740 | ||
UW: 25.0% down · 7.5% · 30yr · 1.5% tax · 5.0% vac · 8.0% maint · 8.0% mgmt
Financing live
Cash to close
- Down payment
- $237,250
- Closing costs
- $28,470
- Reserves months
- —
- Total cash needed
- —
Loan-product check · same deal, 3 products live
Conventional
25% down · 7.5% · 30yr
- Down + closing
- —
- Monthly P&I
- —
- Monthly cashflow
- —
- DSCR
- —
- Eligible?
- —
Personal DTI + credit; lowest rate.
DSCR
20% down · 8.5% · 30yr
- Down + closing
- —
- Monthly P&I
- —
- Monthly cashflow
- —
- DSCR
- —
- Eligible?
- —
No personal income docs; deal must DSCR.
Hard money
10% down · 12.0% · 12mo
- Down + closing
- —
- Monthly P&I
- —
- Monthly cashflow
- —
- DSCR
- —
- Eligible?
- —
Short-term bridge; refi at stabilization.
Rent comps 3 comps
| Address | Beds | Baths | Sqft | Rent | $/sqft | DOM | Units | Dist |
|---|---|---|---|---|---|---|---|---|
| 1679 Gates Ave Ridgewood, NY | 2.0 | 1.0 | 5600 | $3,600 | $0.64 | 24d | 1 | 0.23mi |
| 7-87 Woodward Ave Unit 1L Ridgewood, NY | 2.0 | 1.0 | 3400 | $3,350 | $0.99 | 15d | 1 | 0.61mi |
| 60-88 67th Ave Unit 2 Flushing, NY | 3.0 | 1.0 | 3540 | $3,750 | $1.06 | 3d | 1 | 0.96mi |
Listing history 17 events
-
2026-06-18days on market $949,000 Active 48 DOM
-
2026-06-17days on market $949,000 Active 47 DOM
-
2026-06-16days on market $949,000 Active 46 DOM
-
2026-06-15days on market $949,000 Active 45 DOM
-
2026-06-13days on market $949,000 Active 43 DOM
-
2026-06-10days on market $949,000 Active 39 DOM
-
2026-06-08days on market $949,000 Active 38 DOM
-
2026-06-08days on market $949,000 Active 37 DOM
-
2026-06-04days on market $949,000 Active 34 DOM
-
2026-06-03days on market $949,000 Active 33 DOM
-
2026-06-01days on market $949,000 Active 31 DOM
-
2026-05-31days on market $949,000 Active 30 DOM
-
2026-04-30$949,000 Active
-
2003-11-25soldstatus $200,000
-
1994-11-30soldstatus $99,500
-
1987-07-23soldstatus $73,000
-
1984-05-01soldstatus $35,000
ⓘ Source: listings_history table (triggers on properties + properties_extension) + one-shot
backfill from property_details.listing_events for pre-trigger history.
Tax reassessment forecast NY · Partial reset (capped growth)
- Current annual tax
- $12,116 · $1,010/mo
- Projected year-2 tax
- $14,077 · $1,173/mo
- Expected delta
- +$1,961/yr (+$163/mo · 16.2%)
ⓘ Screening estimate from a state-policy table — verify with the county assessor before closing.
Climate risk First Street
- Flood 1/10 Low FEMA zone X (unshaded) · 0% chance over 30 yrs
- Wildfire 1/10 Low
- Heat 6/10 Major 7 d/yr ≥99°F today · 15 d/yr by 30 yrs out
- Wind 6/10 Major 40% chance of damaging wind over 30 yrs
- Air quality 5/10 Major 6 unhealthy d/yr today · 8 by 30 yrs out
Nearby sold comps map
Loading sold comps map…
Walkable amenities ~0.75 mi
Loading nearby amenities…
Taxation est. · year 1
- Rental income
- $212,880
- − Mortgage interest
- −$53,159
- − Property taxes
- −$12,116
- − Insurance
- −$4,745
- − Repairs & maintenance
- −$17,030
- − Management
- −$17,030
- − Depreciation
- −$27,607
- Taxable income
- $81,192
- Est. tax owed @ 24.0%
- −$19,486
- After-tax cash flow
- $72,108/yr
For passive investors: Depreciation is non-cash, so a rental often shows a tax loss while cash-flowing — sheltering income. Rental losses are passive: they offset passive income freely, and up to $25,000/yr can offset ordinary (W-2) income if you actively participate and your MAGI is under $100k (phasing out to $0 by $150k); unused losses carry forward. On sale, claimed depreciation is recaptured at up to 25%, and gains may owe capital-gains tax (a 1031 exchange can defer both). Figures are a year-1 estimate at your 24.0% rate — not tax advice; consult a CPA.
Schools (NCES district)
No district data.
Livability — New York
- Score
- 75/100
- State rank
- #268
- US rank
- #4188
Category grades
Schools grade is shown separately in the Schools card above.
Census & demographics
- Census place
- New York, NY
- County
- Kings County · 2,614,986 people
- City population
- 7,731,280
- Metro
- New York-Newark-Jersey City, NY-NJ-PA
- Population (ZIP)
- 45,334
- Household income
- $85,196
- Rent vs Own
- Severe rent burden
- 4577.0
Population outlook (Kings County) Hauer SSP2
- Today (2025)
- 2,847,441 people
- By 2030
- 2,937,006 · +3.1%
- By 2040
- 3,095,491 · +8.7%
- By 2050
- 3,228,968 · +13.4%
- By 2075
- 3,321,723 · +16.7%
- By 2100
- 3,111,387 · +9.3%
Race, ethnicity, and origin ACS 2023
- Neighborhood character
- Diverse neighborhood (Simpson 0.65)
- Race & ethnicity
- Hispanic / Latino 52% White 26% Two or more races 17% Black 10% Asian 7% Native American 2%
- Hispanic origin (detail)
- Mexican 9% Puerto Rican 15% Cuban 1% Dominican 9%
- Common ancestry
- Romanian 2% Scotch-Irish 1% Lithuanian 1%
- Foreign-born
- 33% · Canada, China, Jamaica
- Languages at home
- 48% English-only · Spanish 41% Chinese 3% Other Indo-European 2%
Political lean MEDSL · Kings
- 2024 margin
- Solid D (+44.0) · D 72.0% · R 28.0%
- 2008→2024 swing
- -15.5pp toward R · 2008: 59.4pp · 2024: 44.0pp
- All cycles
- 2024: D+44.0 2020: D+54.8 2016: D+61.8 2012: D+63.9 2008: D+59.4
Not yet ingested
- Civics
- —
Market trends
- HPI YoY
- ▲ 14.38%
- Current HPI
- 481.1869
- Rent YoY
- ▲ 4.78%
- Metro
- New York-Newark-Jersey City, NY-NJ-PA
- State GDP YoY
- ▲ 2.60%
- F500 in state
- 92
Industry mix (Fortune 500 HQ in NY)
| Industry | F500 HQs | Revenue |
|---|---|---|
| Financial Services | 10 | $950B |
|
||
| Consumer Goods | 9 | $162B |
|
||
| Insurance | 4 | $225B |
|
||
| Telecommunications | 2 | $144B |
|
||
| Pharmaceuticals | 2 | $112B |
|
||
| Media / Entertainment | 2 | $69B |
|
||
Price history
+2611.4% since first listed5 events — show timeline
- 2026-04-30 Listed $949,000 OneKey® MLS as Distributed by MLS Grid
- 2003-11-25 Sold (Public Records) $200,000 Public Records
- 1994-11-30 Sold (Public Records) $99,500 Public Records
- 1987-07-23 Sold (Public Records) $73,000 Public Records
- 1984-05-01 Sold (Public Records) $35,000 Public Records
Property tax history
+5.1%/yrLatest (2025): $12,116 · +2.3% YoY. Source: county tax records.
Cash-flow waterfall
monthlySold comps — $/sqft
last 12 mo · ≤1 miLoading sold comps…