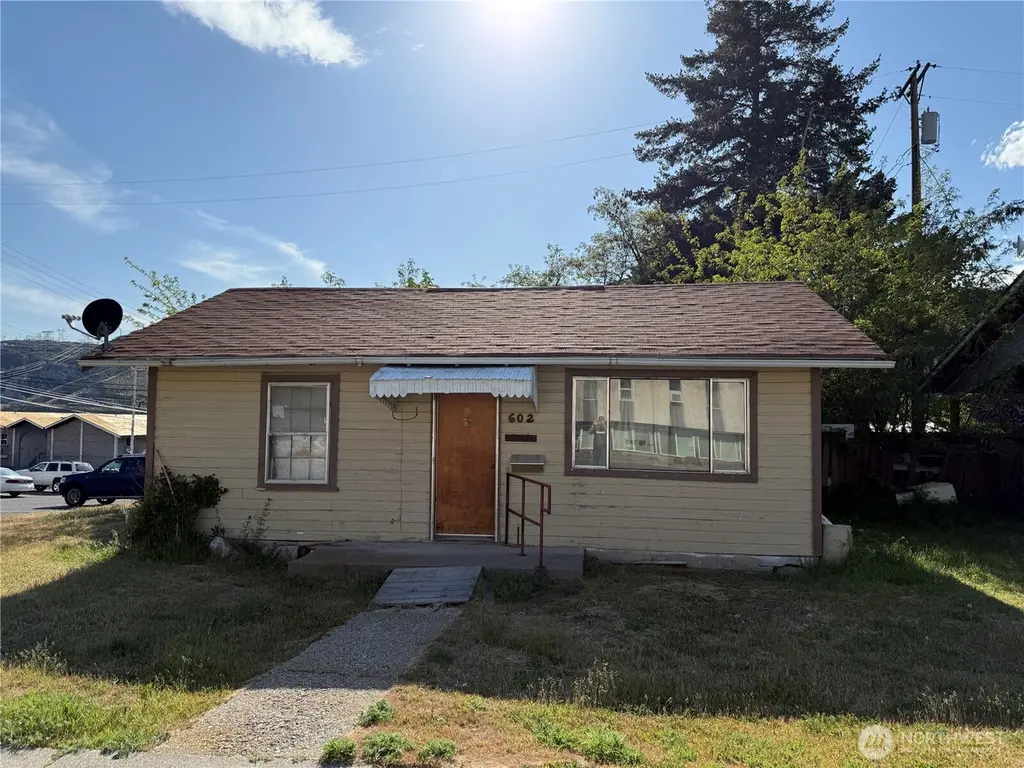
602 Cedar St · Coulee Dam, WA
Flood risk 1/10 · Minimal
- FEMA flood zone
- —
- Chance of flooding over 30 yrs
- 0.0%
- Est. flood insurance / yr
- —
Fire risk 9/10 · Severe
- Est. fire insurance / yr
- $604 – $1,122
Heat risk 4/10 · Minor
- Hot days now (above 96°F)
- 7 days/yr
- Hot days in 30 yrs
- 14 days/yr
Wind risk 1/10 · Minimal
- Chance of severe wind over 30 yrs
- —
Air-quality risk 9/10 · Severe
- Unhealthy air days now
- 15 days/yr
- Unhealthy air days in 30 yrs
- 20 days/yr
Risk factors via First Street. Map © Google.
Why this score? — see what drove the A- grade
The composite is a weighted blend of 9 inputs, each scored 0–100. Each bar is that input's sub-score; the figure is the points it added to the 100-point composite (weight × sub-score).
- Cash flow +30.0/30.0
- ARV discount +15.0/15.0
- DSCR +10.0/10.0
- 1% rule +8.6/10.0
- Appreciation +5.0/10.0
- Livability +3.6/5.0
- Schools +3.0/10.0
- Rent growth +2.5/5.0
- Condition / age +2.5/5.0
$75,000
🖨 Deal sheet 📄 Offer letter ✓ Due diligence
Listing remarks
Opportunity awaits at 602 Cedar St in Coulee Dam! This property is being sold AS-IS, offering a great chance to renovate and bring new life to the home. Situated on a generous lot in a quiet small-town setting near the Columbia River and Grand Coulee Dam, the property has plenty of potential for customization and improvement. Conveniently located near local amenities, parks, schools, and outdoor recreation. Bring your ideas and transform this property into something special!
Key facts
- Near columbia river
- Generous lot
- Near parks
Tags
Property features AI
Finance
- Financial info: Financing options include Cash, FHA, USDA Loan, and VA Loan
Exterior
- Parking: Driveway
- Utilities: Electric service; Public water; No sewer
- Home design: Single-family residence; One story; Main level entry; House
- Construction: Wood construction; Composition roof; Effective year built 1935
- Exterior features: Wood exterior
Interior
- Bedrooms: 3 bedrooms (all on the main level)
- Bathrooms: 1 full bathroom (main level)
- Heating & cooling: Baseboard heating; No central air
- Interior features: Built on lot; Main-level entry
Neighborhood map
What this means for you Summary
Snapshot
- This is a 2-bed/1.0-bath single-family listed at $75k.
Deal economics
- At list price, monthly cash flow is $319 ($4k/yr) — positive.
- The deal already cash-flows at list — no discount required.
- Meets the 1% rule at list price ($1k rent vs $75k).
Location & tenants
- Location reads 71/100 on livability (#230 in WA) — a middle-class / working-renter tenant base. Strengths: cost of living A+, housing A+, crime A; Watch: health & safety C-, amenities F, commute F.
- Grand Coulee Dam School District (rural): math 26% / reading 38% proficiency, ranked #262 of 291 in WA (top 90%) — families likely to look elsewhere, expect single-tenant / working-renter base with shorter leases.
- Market conditions: 17 active listings in the ZIP; 234 units permitted in Okanogan County in 2024 (0 in 5+ unit buildings).
Forward outlook
- In year one you build about $3k of equity ($519 loan paydown + $2k appreciation (3.0% local appreciation)).
- Okanogan County population projected at -12% by 2050 — secular population decline; favor cash flow + early exit over multi-decade hold.
- At projected returns (3.0% appreciation + 3.0% rent growth), your $21k cash investment doubles in ~4 years — after that, you're playing with house money.
Negotiation context
- Only 8 days on market — expect competitive offers; lowballing is unlikely to land.
- Current owner paid $18k; list at $75k implies a 305% gain — meaningful room to come down on a strong offer.
Risks & watch-outs
- Watch-outs: built in 1935 — expect roof / HVAC / electrical / plumbing capex.
- Climate carrying-cost: severe wildfire risk — expect insurance premiums to compound above CPI over the hold.
Questions for the listing agent
- Built in 1935 — when were the roof, HVAC, electrical panel, plumbing, and water heater last replaced?
- Is there a deadline driving the sale (1031 exchange, divorce, estate, relocation)? That informs how much negotiation room exists.
- What's the average days-on-market for RENTAL listings here right now (not sales)? A rising rental-DOM trend means longer vacancies and softer asking-rent achievability than the comps imply.
- What's the recent tenant-quality profile in this submarket — average credit score on applications, eviction rate, late-payment / NSF rate, and stable-employment percentage? A property-management company in the area should have these aggregated.
- How much new for-sale + rental construction is in the pipeline within 1–3 miles? Heavy new supply typically softens prices + rents 12–24 months out; constrained supply supports both.
Investment metrics
- 1% rule
- 1.36% ✓
- Cap rate
- 11.40%
- Cash-on-cash
- 18.25%
- DSCR
- 1.81
- GRM
- 6.1
CMA / ARV
- ARV (on-the-fly)
- $101,750
- Comps found
- 2
Show comp detail 2 sales within ~0.75 mi
| Address | Dist | Beds/Ba | Sqft | Sold | Price | $/sf | Match |
|---|---|---|---|---|---|---|---|
| 801 Aspen St | 0.16mi | 2/1.0 | 875 (+8%) | 23mo | $63,000 | $72 | 61 |
| 1013 Camas St | 0.61mi | 3/1.0 (+1) | 920 (+13%) | 8mo | $115,000 | $125 | 38 |
Match score weights: distance 35% · size 25% · config 20% · recency 20%. Top-matched comps best support the ARV.
Projected returns pro-forma
3.0% appreciation · 3.0% rent growth · sell at horizon
- IRR
- 24.6%
- Equity multiple
- 2.40×
- Total profit
- $29,374
- Equity at exit
- $33,723
- IRR
- 25.4%
- Equity multiple
- 4.62×
- Total profit
- $76,069
- Equity at exit
- $51,972
Cash invested: $21,000 (down + closing). Projections, not guarantees.
Landlord ↔ Tenant lean methodology
- Overall (STATE)
- 28 Tenant-Leaning
- State Washington
- 28 Tenant-Leaning · D+8
- County
- — inherits STATE
- City
- — inherits STATE
ZIP-level market 99116
- Active inventory
- 17
- Price-to-rent
- 6.1×
Monthly cashflow live
- Estimated rent
- $1,023 medium interval (Pro) →
- Mortgage (P&I)
- −$393
- Tax from tax record
- −$65 /mo · $775/yr
- Insurance
- −$31
- HOA
- −$0
- Vacancy / Maint / Mgmt
- −$215
- Net cashflow
- $319
Break-even live
UW: 25.0% down · 7.5% · 30yr · 1.5% tax · 5.0% vac · 8.0% maint · 8.0% mgmt
Financing live
Cash to close
- Down payment
- $18,750
- Closing costs
- $2,250
- Reserves months
- —
- Total cash needed
- —
Loan-product check · same deal, 3 products live
Conventional
25% down · 7.5% · 30yr
- Down + closing
- —
- Monthly P&I
- —
- Monthly cashflow
- —
- DSCR
- —
- Eligible?
- —
Personal DTI + credit; lowest rate.
DSCR
20% down · 8.5% · 30yr
- Down + closing
- —
- Monthly P&I
- —
- Monthly cashflow
- —
- DSCR
- —
- Eligible?
- —
No personal income docs; deal must DSCR.
Hard money
10% down · 12.0% · 12mo
- Down + closing
- —
- Monthly P&I
- —
- Monthly cashflow
- —
- DSCR
- —
- Eligible?
- —
Short-term bridge; refi at stabilization.
Listing history 8 events
-
2026-06-18days on market $75,000 Active 8 DOM
-
2026-06-17days on market $75,000 Active 7 DOM
-
2026-06-16days on market $75,000 Active 6 DOM
-
2026-06-15days on market $75,000 Active 5 DOM
-
2026-06-15days on market $75,000 Active 4 DOM
-
2026-06-13days on market $75,000 Active 3 DOM
-
2026-06-12remarks 479-char remark
-
2026-06-12$75,000 Active 2 DOM
ⓘ Source: listings_history table (triggers on properties + properties_extension) + one-shot
backfill from property_details.listing_events for pre-trigger history.
Tax reassessment forecast WA · Resets to sale price
- Current annual tax
- $775 · $65/mo
- Projected year-2 tax
- $775 · $65/mo
- Expected delta
- $0/yr ($0/mo · 0.0%)
ⓘ Screening estimate from a state-policy table — verify with the county assessor before closing.
Climate risk First Street
- Flood 1/10 Low 0% chance over 30 yrs
- Wildfire 9/10 Extreme
- Heat 4/10 Moderate 7 d/yr ≥96°F today · 14 d/yr by 30 yrs out
- Wind 1/10 Low
- Air quality 9/10 Extreme 15 unhealthy d/yr today · 20 by 30 yrs out
Nearby sold comps map
Loading sold comps map…
Walkable amenities ~0.75 mi
Loading nearby amenities…
Taxation est. · year 1
- Rental income
- $12,281
- − Mortgage interest
- −$4,201
- − Property taxes
- −$775
- − Insurance
- −$375
- − Repairs & maintenance
- −$982
- − Management
- −$982
- − Depreciation
- −$2,182
- Taxable income
- $2,783
- Est. tax owed @ 24.0%
- −$668
- After-tax cash flow
- $3,165/yr
For passive investors: Depreciation is non-cash, so a rental often shows a tax loss while cash-flowing — sheltering income. Rental losses are passive: they offset passive income freely, and up to $25,000/yr can offset ordinary (W-2) income if you actively participate and your MAGI is under $100k (phasing out to $0 by $150k); unused losses carry forward. On sale, claimed depreciation is recaptured at up to 25%, and gains may owe capital-gains tax (a 1031 exchange can defer both). Figures are a year-1 estimate at your 24.0% rate — not tax advice; consult a CPA.
Schools (NCES district)
- District
- Grand Coulee Dam School District
- NCES district ID
- 5303130
- Math proficiency
- 26% ▼ -3.00%
- Reading proficiency
- 38% ▬ 0.00%
- Median HH income
- $46,635
- Composite
- 30.27/100
- National rank
- #11563
- State rank
- #262 of 291 in WA
Livability — Coulee Dam
- Score
- 71/100
- State rank
- #230
- US rank
- #7061
Category grades
Schools grade is shown separately in the Schools card above.
Census & demographics
- Census place
- Coulee Dam, WA
- Population (ZIP)
- 1,649
Population outlook (Okanogan County) Hauer SSP2
- Today (2025)
- 40,288 people
- By 2030
- 39,265 · -2.5%
- By 2040
- 37,110 · -7.9%
- By 2050
- 35,389 · -12.2%
- By 2075
- 31,609 · -21.5%
- By 2100
- 26,647 · -33.9%
Race, ethnicity, and origin ACS 2023
- Neighborhood character
- Highly diverse neighborhood (Simpson 0.76)
- Race & ethnicity
- White 49% Native American 38% Two or more races 9% Hispanic / Latino 5%
- Common ancestry
- Portuguese 3% Italian 2% Lithuanian 2%
- Foreign-born
- 3% · Canada, India
- Languages at home
- 95% English-only · Spanish 2% Other Indo-European 2%
Political lean MEDSL · Okanogan
- 2024 margin
- R (+15.0) · D 41.1% · R 56.0% · Other 2.9%
- 2008→2024 swing
- -8.0pp toward R · 2008: -7.0pp · 2024: -15.0pp
- All cycles
- 2024: R+15.0 2020: R+13.8 2016: R+21.3 2012: R+14.8 2008: R+7.0
Not yet ingested
- Civics
- —
Market trends
- HPI YoY
- —
- Current HPI
- —
- Rent YoY
- —
- Metro
- —
- State GDP YoY
- ▲ 4.65%
- F500 in state
- 22
Industry mix (Fortune 500 HQ in WA)
| Industry | F500 HQs | Revenue |
|---|---|---|
| Retail | 2 | $269B |
|
||
| Technology / Retail | 1 | $638B |
|
||
| Technology | 1 | $245B |
|
||
| Telecommunications | 1 | $38B |
|
||
| Food / Beverage | 1 | $36B |
|
||
| Automotive / Trucks | 1 | $34B |
|
||
Price history
+305.4% since first listed2 events — show timeline
- 2026-06-10 Listed $75,000 NWMLS as Distributed by MLS Grid
- 1984-10-05 Sold (Public Records) $18,500 Public Records
Property tax history
+4.2%/yrLatest (2026): $775 · +3.6% YoY. Source: county tax records.
Cash-flow waterfall
monthlySold comps — $/sqft
last 12 mo · ≤1 miLoading sold comps…