 5-Plex
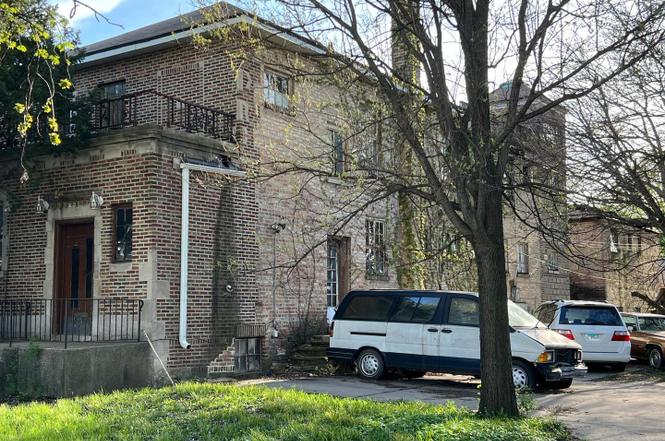
1718 S 6th Ave · Maywood, IL
Flood risk 1/10 · Minimal
- FEMA flood zone
- X (unshaded)
- Chance of flooding over 30 yrs
- 0.0%
- Est. flood insurance / yr
- $473 – $860
Fire risk 1/10 · Minimal
- Est. fire insurance / yr
- $804 – $1,492
Heat risk 3/10 · Minor
- Hot days now (above 100°F)
- 7 days/yr
- Hot days in 30 yrs
- 14 days/yr
Wind risk 2/10 · Minimal
- Chance of severe wind over 30 yrs
- —
Air-quality risk 5/10 · Moderate
- Unhealthy air days now
- 6 days/yr
- Unhealthy air days in 30 yrs
- 8 days/yr
Risk factors via First Street. Map © Google.
Why this score? — see what drove the B+ grade
The composite is a weighted blend of 9 inputs, each scored 0–100. Each bar is that input's sub-score; the figure is the points it added to the 100-point composite (weight × sub-score).
- Cash flow +30.0/30.0
- ARV discount +15.0/15.0
- 1% rule +10.0/10.0
- DSCR +10.0/10.0
- Livability +3.9/5.0
- Rent growth +2.5/5.0
- Condition / age +2.5/5.0
- Schools +1.9/10.0
- Appreciation +0.0/10.0
$254,999
🖨 Deal sheet (PDF) 📄 Offer letter ✓ Due diligence
Multi-family units
County records classify this as Multi-Family (2-4 Unit). Listing-text estimate: 5 units. estimate disagrees with records
Listing remarks
INVESTOR SPECIAL! This old italian-style mansion has been repurposed into a 5-unit building. A great opportunity to become a landlord, there is no HOA. This lot is big and spacious, there is also a seperate smaller building, a guest coach house, perfect for holding supplies and other maintenance needs. Big courtyard that can be great for parking, fits 10+ cars. Building is prepped for a basic rehab and amazing potential for income. Multi-unit building is fitted with meters. Brand ew furnace just installed. Utilities work in the units, building need a cosmetic rehab and some TLC to bring to full value. Building is easy to show, contact the listing agent today.
Key facts
- Multi-unit building
- Big lot
- 5-unit building
Tags
Property features AI
Finance
- Other: Monthly income max listed at $2,500 for unit types
- Financial info: Annual taxes reported (2022)
Exterior
- Utilities: Gas heating
- Home design: Multi-family (5+ units); Total of 5 units on the property
- Construction: Built before 1978
- Exterior features: Zoned for multi-family; Lot dimensions: 5,195
Interior
- Bedrooms: Two-bedroom units (type 1); One-bedroom units (type 2)
- Heating & cooling: Gas heating/ventilation
- Interior features: Five rooms in unit type 1; Four rooms in unit type 2
Neighborhood map
What this means for you Summary
Snapshot
- This is a 5 × 3-bed/1.5-bath units multifamily listed at $255k.
Deal economics
- At list price, monthly cash flow is $4k ($46k/yr) — positive. Per door: $766/mo.
- The deal already cash-flows at list — no discount required.
- Meets the 1% rule at list price ($8k rent vs $255k).
- Recommended offer: $224k (12.0% below list) — sets the bar for market timing.
- Cap rate 24.3% vs local median 4.5% in Maywood — top-decile yield for the area; either an underpriced asset or a hidden risk that comps aren't pricing in. Stress-test before assuming the spread holds.
Location & tenants
- Location reads 78/100 on livability (#146 in IL, #2,694 nationally) — a middle-class / working-renter tenant base. Strengths: commute A+, cost of living A+, housing A+; Watch: health & safety C-, crime D+, schools F.
- Maywood-Melrose Park-Broadview 89 (suburban): math 14% / reading 21% proficiency, ranked #738 of 919 in IL (top 80%) — low school quality limits family demand, transient renter base, plan for 1-2y turnover; 74% free/reduced lunch — lower-income household profile, screen leases tightly.
- Market conditions: 71 active listings in the ZIP; 1 comparable units currently listed for rent nearby; 6,272 units permitted in Cook County in 2024 (4,658 in 5+ unit buildings).
- At $7,946/mo this rent would consume 139% of the median local household income ($69k/yr) (locally 869% of renters already pay >50% of income on rent) — very limited rent-growth headroom before tenants either downsize or default.
Forward outlook
- Local home prices are declining (-3.0%/yr); year-one equity from $2k of loan paydown is wiped out by about $8k of value loss. Plan a longer hold.
- At projected returns (-3.0% appreciation + 3.0% rent growth), your $71k cash investment doubles in ~2 years — after that, you're playing with house money.
Negotiation context
- It's been on market 253 days — a 12% lower offer ($224k) is reasonable based on typical stale-listing flexibility.
Risks & watch-outs
- Watch-outs: property tax is 4.7% of price; built in 1930 — expect roof / HVAC / electrical / plumbing capex.
Questions for the listing agent
- It's been on market 253 days. Have you received any prior offers? Is the seller open to a 12% concession, seller financing, or rate buy-down credit?
- Can we see the unit-by-unit rent roll, current vacancy, and any below-market leases? What's the average tenancy length?
- What capital expenditures (roof, boiler, parking lot, exteriors) have been made in the last 5 years, and what's planned in the next 2?
- Built in 1930 — when were the roof, HVAC, electrical panel, plumbing, and water heater last replaced?
- Property tax is high relative to price — has the assessment been appealed recently, and will the sale trigger a re-assessment?
- Why hasn't it sold? Are there any deal-killer items the seller is aware of (foundation, flood, title, zoning, code violations)?
- Is there a deadline driving the sale (1031 exchange, divorce, estate, relocation)? That informs how much negotiation room exists.
- Schools are F-rated, which usually means shorter tenancies and higher turnover. Who's the typical renter profile here, and what's been the actual vacancy rate?
- Crime grade is D in this area — have there been break-ins, vandalism, or insurance claims at this property in the last 3 years? What carrier currently insures it and at what premium?
- What's the average days-on-market for RENTAL listings here right now (not sales)? A rising rental-DOM trend means longer vacancies and softer asking-rent achievability than the comps imply.
- What's the recent tenant-quality profile in this submarket — average credit score on applications, eviction rate, late-payment / NSF rate, and stable-employment percentage? A property-management company in the area should have these aggregated.
- How much new apartment / multifamily construction is in the pipeline within 1–3 miles? Heavy new supply (>2% of stock underway) typically softens rents 12–24 months out; light construction supports rent growth.
Investment metrics
- 1% rule
- 3.12% ✓
- Cap rate
- 24.31%
- Cash-on-cash
- 64.35%
- DSCR
- 3.86
- GRM
- 2.7
CMA / ARV
- ARV (on-the-fly)
- $415,798
- Comps found
- 1
Show comp detail 1 sale within ~0.75 mi
| Address | Dist | Beds/Ba | Sqft | Sold | Price | $/sf | Match |
|---|---|---|---|---|---|---|---|
| 2036 S 13th Ave | 0.56mi | 7/5.0 (+1) | 3,557 (+9%) | 12mo | $452,650 | $127 | 37 |
Match score weights: distance 35% · size 25% · config 20% · recency 20%. Top-matched comps best support the ARV.
Projected returns pro-forma
-3.0% appreciation · 3.0% rent growth · sell at horizon
- IRR
- 63.5%
- Equity multiple
- 3.84×
- Total profit
- $203,065
- Equity at exit
- $38,021
- IRR
- 68.0%
- Equity multiple
- 7.90×
- Total profit
- $493,015
- Equity at exit
- $22,048
Cash invested: $71,400 (down + closing). Projections, not guarantees.
Landlord ↔ Tenant lean methodology
- Overall (STATE)
- 43 Moderately Tenant-Leaning
- State Illinois
- 43 Moderately Tenant-Leaning · D+7
- County
- — inherits STATE
- City
- — inherits STATE
ZIP-level market 60153
- Home prices YoY
- -20.5%
- Active inventory
- 71
- Price-to-rent
- 13.4×
Monthly cashflow live
- Estimated rent
- $7,946 medium interval (Pro) →
- Mortgage (P&I)
- −$1,337
- Tax from tax record
- −$1,005 /mo · $12,063/yr
- Insurance
- −$106
- HOA
- −$0
- Vacancy / Maint / Mgmt
- −$1,669
- Net cashflow
- $3,829
Break-even live
Sensitivity live
| Price | -10% $4,691 | -5% $3,901 | +0% $3,829 | +5% $3,756 | +10% $3,684 |
|---|---|---|---|---|---|
| Rent | -10% $3,201 | -5% $3,515 | +0% $3,829 | +5% $4,142 | +10% $4,456 |
| Rate | -1.0pp $3,957 | -0.5pp $3,893 | base $3,829 | +0.5pp $3,762 | +1.0pp $3,695 |
5-unit breakdown (identical units grouped — click to expand)
| Units | Beds | Baths | Est. rent |
|---|---|---|---|
| 5× units | 3 | 1.5 | $7,945 |
| #1 | 3 | 1.5 | $1,589 |
| #2 | 3 | 1.5 | $1,589 |
| #3 | 3 | 1.5 | $1,589 |
| #4 | 3 | 1.5 | $1,589 |
| #5 | 3 | 1.5 | $1,589 |
| Total (5 units) | $7,946 | ||
UW: 25.0% down · 7.5% · 30yr · 1.5% tax · 5.0% vac · 8.0% maint · 8.0% mgmt
Financing live
Cash to close
- Down payment
- $63,750
- Closing costs
- $7,650
- Reserves months
- —
- Total cash needed
- —
Loan-product check · same deal, 3 products live
Conventional
25% down · 7.5% · 30yr
- Down + closing
- —
- Monthly P&I
- —
- Monthly cashflow
- —
- DSCR
- —
- Eligible?
- —
Personal DTI + credit; lowest rate.
DSCR
20% down · 8.5% · 30yr
- Down + closing
- —
- Monthly P&I
- —
- Monthly cashflow
- —
- DSCR
- —
- Eligible?
- —
No personal income docs; deal must DSCR.
Hard money
10% down · 12.0% · 12mo
- Down + closing
- —
- Monthly P&I
- —
- Monthly cashflow
- —
- DSCR
- —
- Eligible?
- —
Short-term bridge; refi at stabilization.
Rent comps 1 comps
| Address | Beds | Baths | Sqft | Rent | $/sqft | DOM | Units | Dist |
|---|---|---|---|---|---|---|---|---|
| 1508 S 1st Ave Maywood, IL | 6.0 | 2.0 | 2500 | $3,000 | $1.20 | 0d | 1 | 0.34mi |
Listing history 18 events
-
2026-06-21pricedays on market $254,999 Active 253 DOM
-
2026-06-18days on market $264,999 Active 250 DOM
-
2026-06-17days on market $264,999 Active 249 DOM
-
2026-06-16days on market $264,999 Active 248 DOM
-
2026-06-15days on market $264,999 Active 247 DOM
-
2026-06-13days on market $264,999 Active 245 DOM
-
2026-06-13days on market $264,999 Active 244 DOM
-
2026-06-09days on market $264,999 Active 241 DOM
-
2026-06-08days on market $264,999 Active 240 DOM
-
2026-06-07days on market $264,999 Active 239 DOM
-
2026-06-04days on market $264,999 Active 236 DOM
-
2026-06-03days on market $264,999 Active 235 DOM
-
2026-06-02days on market $264,999 Active 234 DOM
-
2026-06-01days on market $264,999 Active 233 DOM
-
2026-05-31days on market $264,999 Active 232 DOM
-
2026-01-05price $270,000
-
2025-12-04price $275,000
-
2025-10-11$280,000 Active
ⓘ Source: listings_history table (triggers on properties + properties_extension) + one-shot
backfill from property_details.listing_events for pre-trigger history.
Tax reassessment forecast IL · Partial reset (capped growth)
- Current annual tax
- $12,063 · $1,005/mo
- Projected year-2 tax
- $12,063 · $1,005/mo
- Expected delta
- $0/yr ($0/mo · 0.0%)
ⓘ Screening estimate from a state-policy table — verify with the county assessor before closing.
Climate risk First Street
- Flood 1/10 Low FEMA zone X (unshaded) · 0% chance over 30 yrs
- Wildfire 1/10 Low
- Heat 3/10 Moderate 7 d/yr ≥100°F today · 14 d/yr by 30 yrs out
- Wind 2/10 Low
- Air quality 5/10 Major 6 unhealthy d/yr today · 8 by 30 yrs out
Nearby sold comps map
Loading sold comps map…
Walkable amenities ~0.75 mi
Loading nearby amenities…
Taxation est. · year 1
- Rental income
- $95,352
- − Mortgage interest
- −$14,284
- − Property taxes
- −$12,063
- − Insurance
- −$1,275
- − Repairs & maintenance
- −$7,628
- − Management
- −$7,628
- − Depreciation
- −$7,418
- Taxable income
- $45,055
- Est. tax owed @ 24.0%
- −$10,813
- After-tax cash flow
- $35,130/yr
For passive investors: Depreciation is non-cash, so a rental often shows a tax loss while cash-flowing — sheltering income. Rental losses are passive: they offset passive income freely, and up to $25,000/yr can offset ordinary (W-2) income if you actively participate and your MAGI is under $100k (phasing out to $0 by $150k); unused losses carry forward. On sale, claimed depreciation is recaptured at up to 25%, and gains may owe capital-gains tax (a 1031 exchange can defer both). Figures are a year-1 estimate at your 24.0% rate — not tax advice; consult a CPA.
Schools (NCES district)
- District
- Maywood-Melrose Park-Broadview 89
- NCES district ID
- 1725110
- Math proficiency
- 14% ▲ 1.00%
- Reading proficiency
- 21% ▲ 4.00%
- Median HH income
- $45,567
- Composite
- 18.75/100
- National rank
- #14003
- State rank
- #738 of 919 in IL
Livability — Maywood
- Score
- 78/100
- State rank
- #146
- US rank
- #2694
Category grades
Schools grade is shown separately in the Schools card above.
Census & demographics
- Census place
- Maywood, IL
- County
- Cook County · 4,486,803 people
- City population
- 23,201
- Metro
- Chicago-Naperville-Elgin, IL-IN-WI
- Population (ZIP)
- 23,201
- Household income
- $68,815
- Rent vs Own
- Severe rent burden
- 869.0
Population outlook (Cook County) Hauer SSP2
- Today (2025)
- 5,347,519 people
- By 2030
- 5,357,703 · +0.2%
- By 2040
- 5,324,924 · -0.4%
- By 2050
- 5,230,762 · -2.2%
- By 2075
- 4,785,735 · -10.5%
- By 2100
- 4,188,836 · -21.7%
Race, ethnicity, and origin ACS 2023
- Neighborhood character
- Diverse neighborhood (Simpson 0.56)
- Race & ethnicity
- Black 57% Hispanic / Latino 33% Two or more races 11% White 6%
- Hispanic origin (detail)
- Mexican 28% Puerto Rican 3%
- Common ancestry
- Romanian 1% British 1%
- Foreign-born
- 14% · Canada, Jamaica
- Languages at home
- 68% English-only · Spanish 30% French/Haitian/Cajun 2%
Political lean MEDSL · Cook
- 2024 margin
- Solid D (+42.0) · D 70.4% · R 28.4% · Other 1.2%
- 2008→2024 swing
- -11.4pp toward R · 2008: 53.4pp · 2024: 42.0pp
- All cycles
- 2024: D+42.0 2020: D+50.3 2016: D+53.0 2012: D+49.4 2008: D+53.4
Not yet ingested
- Civics
- —
Market trends
- HPI YoY
- ▼ -86.90%
- Current HPI
- 336.2159
- Rent YoY
- —
- Metro
- Chicago-Naperville-Elgin, IL-IN-WI
- State GDP YoY
- ▲ 1.59%
- F500 in state
- 60
Industry mix (Fortune 500 HQ in IL)
| Industry | F500 HQs | Revenue |
|---|---|---|
| Insurance | 4 | $201B |
|
||
| Consumer Goods | 4 | $87B |
|
||
| Industrial Machinery | 3 | $64B |
|
||
| Healthcare | 2 | $55B |
|
||
| Retail / Pharmacy | 1 | $148B |
|
||
| Agriculture / Food | 1 | $86B |
|
||
Price history
-3.6% since first listed3 events — show timeline
- 2026-01-05 Price Changed $270,000 MRED as Distributed by MLS Grid
- 2025-12-04 Price Changed $275,000 MRED as Distributed by MLS Grid
- 2025-10-11 Listed $280,000 MRED as Distributed by MLS Grid
Property tax history
-0.9%/yrLatest (2023): $12,063 · -22.4% YoY. Source: county tax records.
Cash-flow waterfall
monthlySold comps — $/sqft
last 12 mo · ≤1 miLoading sold comps…