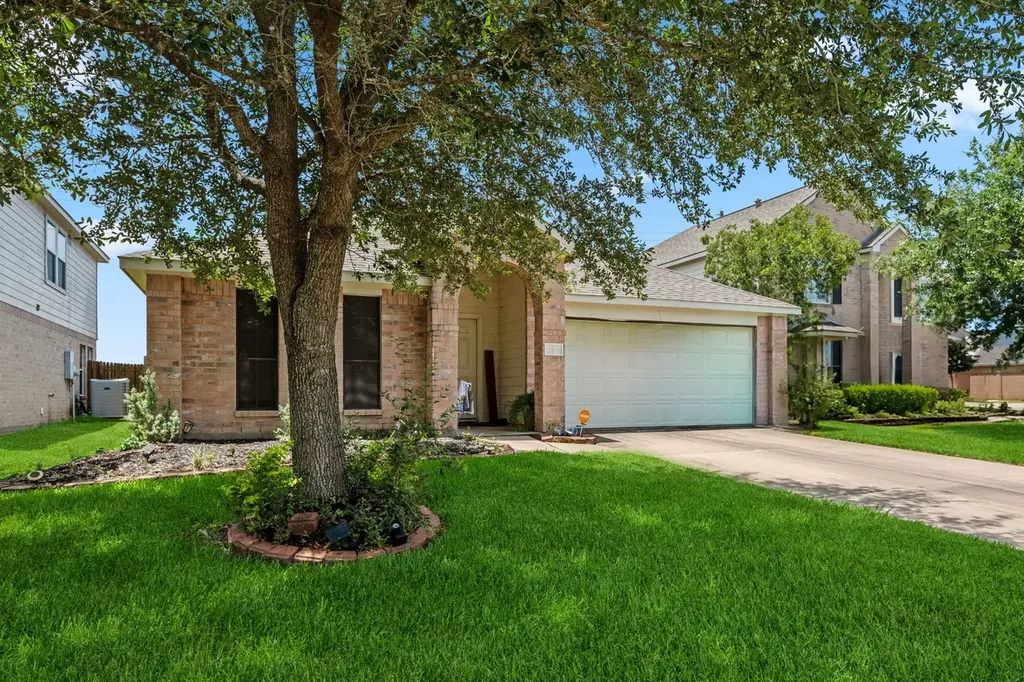
2419 Alcove Foster Ct · Fresno, TX
Flood risk 1/10 · Minimal
- FEMA flood zone
- X (unshaded)
- Chance of flooding over 30 yrs
- 0.0%
- Est. flood insurance / yr
- $507 – $1,088
Fire risk 4/10 · Minor
- Est. fire insurance / yr
- $1,222 – $2,270
Heat risk 9/10 · Severe
- Hot days now (above 110°F)
- 7 days/yr
- Hot days in 30 yrs
- 24 days/yr
Wind risk 9/10 · Severe
- Chance of severe wind over 30 yrs
- 99.0%
Air-quality risk 2/10 · Minimal
- Unhealthy air days now
- 2 days/yr
- Unhealthy air days in 30 yrs
- 2 days/yr
Risk factors via First Street. Map © Google.
Why this score? — see what drove the C grade
The composite is a weighted blend of 9 inputs, each scored 0–100. Each bar is that input's sub-score; the figure is the points it added to the 100-point composite (weight × sub-score).
- Cash flow +15.4/30.0
- ARV discount +13.5/15.0
- 1% rule +6.2/10.0
- DSCR +4.7/10.0
- Schools +4.5/10.0
- Appreciation +4.0/10.0
- Livability +3.1/5.0
- Condition / age +2.5/5.0
- Rent growth +2.3/5.0
$235,000
🖨 Deal sheet (PDF) 📄 Offer letter ✓ Due diligence
Listing remarks
Aggressively priced for a quick move, this beautifully maintained brick home in the desirable Winfield Lakes subdivision offers the perfect blend of comfort, functionality, and energy efficiency! Featuring 3 bedrooms, 2 full baths, and a dedicated office/study that could easily serve as an optional 4th bedroom, this home is designed to fit a variety of lifestyles. Inside, you’ll find a spacious layout with a cozy gas fireplace creating the perfect focal point for the living area. The private primary suite includes a relaxing soaking tub, separate stand-up shower, and plenty of space to unwind. Step outside to enjoy the covered back porch, ideal for entertaining or relaxing evenings at
Key facts
- Cozy gas fireplace
- Soaking tub
- Brick home
Tags
Property features AI
Finance
- HOA & community: Triquest Management HOA; Annual association fee of $550; Community curbs
Exterior
- Parking: Attached 2-car garage
- Security: Smoke detectors
- Utilities: Public water; Public sewer
- Home design: Residential property; Full ownership; Single-story entry (all main rooms listed on first floor); Composition roof
- Construction: Brick construction; Built in 2007; Pillar/post/pier and slab foundation
- Exterior features: Deck; Patio; Private yard; Fenced backyard; Located on a cul-de-sac; Subdivision setting; Concrete road access
Interior
- Kitchen: Dishwasher; Gas oven; Gas range; Microwave
- Bedrooms: Primary bedroom on first floor; Additional bedrooms on first floor (total bedrooms possible: 4); Office on first floor
- Flooring: Carpet; Plank flooring; Vinyl
- Bathrooms: 2 full bathrooms
- Heating & cooling: Central heating (gas); Central electric air conditioning; Programmable thermostat
- Interior features: Double vanity; Entrance foyer; High ceilings; Kitchen/family room combo; Pantry; Soaking tub; Separate shower; Tub/shower combination; Ceiling fans; Kitchen/dining combo; Programmable thermostat
- Laundry & utility: Washer hookup; Electric dryer hookup; Gas dryer hookup
Neighborhood map
What this means for you Summary
Snapshot
- This is a 3-bed/2.0-bath single-family listed at $235k.
Deal economics
- At list price, monthly cash flow is $90 ($1k/yr) — positive.
- The deal already cash-flows at list — no discount required.
- Meets the 1% rule at list price ($3k rent vs $235k).
- Recommended offer: $231k (1.5% below list) — sets the bar for market timing.
- Cap rate 6.8% vs local median 5.4% in Fresno — meaningfully above typical; check what's discounted (condition, days-on-market, listing class) to confirm the premium yield is real.
Location & tenants
- Location reads 62/100 on livability (#943 in TX) — a middle-class / working-renter tenant base. Strengths: employment A+, housing A+, cost of living A; Watch: crime C-, amenities F, commute F.
- Fort Bend ISD (suburban): math 44% / reading 53% proficiency, ranked #140 of 826 in TX (top 17%) — families likely to look elsewhere, expect single-tenant / working-renter base with shorter leases.
- Zoned schools: Lake Olympia Middle (math 18% / reading 31%, grade F, #1,279 of 1,662 statewide, top 78%, 1,170 students, 71% FRL); Hightower H S (math 23% / reading 45%, grade F, #1,002 of 1,632 statewide, top 62%, 2,535 students, 67% FRL) — zoned schools average 69% FRL vs 35% district-wide (34 pts higher); higher-poverty schools than district average — tighter screening recommended.
- Zoned-school proficiency averages 29% at this address vs 48% district-wide (-19 pts) — the specific schools serving this property underperform the Fort Bend ISD average; the district grade overstates school quality for this exact location.
- Market conditions: Rents soft (-0.9%/yr); 175 active listings in the ZIP; 8 comparable units currently listed for rent nearby; rentals at typical pace (median 22d on market — plan ~3-4 weeks tenant-placement turnaround); solid renter incomes; 12,093 units permitted in Fort Bend County in 2024 (815 in 5+ unit buildings).
- This rent runs 34% of the median local income ($94k/yr) — at the standard rent-burdened threshold; future hikes will face affordability resistance.
Forward outlook
- Local home prices are declining (-2.0%/yr); year-one equity from $2k of loan paydown is wiped out by about $5k of value loss. Plan a longer hold.
- Fort Bend County population projected at +75% by 2050 — long-run rental-demand tailwind backs the buy-and-hold thesis.
Negotiation context
- It's been on market 21 days — a 2% lower offer ($231k) is reasonable based on typical stale-listing flexibility.
Risks & watch-outs
- Watch-outs: property tax is 3.2% of price.
- Climate carrying-cost: severe wind risk, 99% chance of damaging wind over 30y; extreme-heat days projected 7→24/yr by 2055 (HVAC capex compounding) — expect insurance premiums to compound above CPI over the hold.
Questions for the listing agent
- Property tax is high relative to price — has the assessment been appealed recently, and will the sale trigger a re-assessment?
- What does the HOA fee cover, when was the last increase, and are there any pending special assessments or reserve-fund shortfalls?
- Is there a deadline driving the sale (1031 exchange, divorce, estate, relocation)? That informs how much negotiation room exists.
- Schools are D-rated, which usually means shorter tenancies and higher turnover. Who's the typical renter profile here, and what's been the actual vacancy rate?
- What's the average days-on-market for RENTAL listings here right now (not sales)? A rising rental-DOM trend means longer vacancies and softer asking-rent achievability than the comps imply.
- What's the recent tenant-quality profile in this submarket — average credit score on applications, eviction rate, late-payment / NSF rate, and stable-employment percentage? A property-management company in the area should have these aggregated.
- How much new for-sale + rental construction is in the pipeline within 1–3 miles? Heavy new supply typically softens prices + rents 12–24 months out; constrained supply supports both.
Investment metrics
- 1% rule
- 1.12% ✓
- Cap rate
- 6.75%
- Cash-on-cash
- 1.65%
- DSCR
- 1.07
- GRM
- 7.4
CMA / ARV
- ARV (on-the-fly)
- $271,032
- Comps found
- 12
Show comp detail 12 sales within ~0.75 mi
| Address | Dist | Beds/Ba | Sqft | Sold | Price | $/sf | Match |
|---|---|---|---|---|---|---|---|
| 2406 Grove View Trl | 0.19mi | 4/2.0 (+1) | 2,165 (+10%) | 2mo | $297,500 | $137 | 67 |
| 2923 Vales Point Dr | 0.47mi | 4/2.0 (+1) | 2,079 (+6%) | 1mo | $306,900 | $148 | 62 |
| 2811 Darby Brook Dr | 0.31mi | 4/2.0 (+1) | 2,140 (+9%) | 4mo | $275,000 | $129 | 62 |
| 18622 Serapis St | 0.52mi | 4/3.0 (+1) | 1,876 (-4%) | 2mo | $381,920 | $204 | 58 |
| 2022 Wellfleet Xing | 0.56mi | 4/2.0 (+1) | 2,098 (+7%) | 0mo | $290,000 | $138 | 57 |
| 2719 Bergen Bay Ln | 0.37mi | 3/2.0 | 1,704 (-13%) | 4mo | $255,999 | $150 | 57 |
| 18539 Porta Marina Dr | 0.56mi | 4/3.0 (+1) | 1,876 (-4%) | 5mo | $337,740 | $180 | 53 |
| 3019 Edgewick Elm St | 0.49mi | 2/2.5 (-1) | 1,767 (-10%) | 4mo | $215,000 | $122 | 50 |
| 1927 Vermillion View St | 0.50mi | 4/2.5 (+1) | 2,215 (+13%) | 1mo | $277,500 | $125 | 47 |
| 3119 Becker Glen St | 0.61mi | 3/2.5 | 1,702 (-13%) | 2mo | $177,000 | $104 | 46 |
| 3114 Becker Glen St | 0.63mi | 3/2.5 | 1,680 (-14%) | 2mo | $219,900 | $131 | 43 |
| 2011 Manchester Crossing Dr | 0.75mi | 3/2.0 | 1,703 (-13%) | 4mo | $255,000 | $150 | 39 |
Match score weights: distance 35% · size 25% · config 20% · recency 20%. Top-matched comps best support the ARV.
Projected returns pro-forma
-1.98% appreciation · 0.0% rent growth · sell at horizon
- IRR
- -11.7%
- Equity multiple
- 0.55×
- Total profit
- $-29,625
- Equity at exit
- $45,850
- IRR
- -8.7%
- Equity multiple
- 0.42×
- Total profit
- $-38,119
- Equity at exit
- $39,383
Cash invested: $65,800 (down + closing). Projections, not guarantees.
Landlord ↔ Tenant lean methodology
- Overall (STATE)
- 87 Strongly Landlord-Friendly
- State Texas
- 87 Strongly Landlord-Friendly · R+5
- County
- — inherits STATE
- City
- — inherits STATE
ZIP-level market 77545
- Home prices YoY
- -0.8%
- Rents YoY
- -0.9%
- Active inventory
- 175
- Price-to-rent
- 7.4×
Monthly cashflow live
- Estimated rent
- $2,640 high interval (Pro) →
- Mortgage (P&I)
- −$1,232
- Tax from tax record
- −$619 /mo · $7,428/yr
- Insurance
- −$98
- HOA
- −$46
- Vacancy / Maint / Mgmt
- −$554
- Net cashflow
- $90
Break-even live
Sensitivity live
| Price | -10% $224 | -5% $157 | +0% $90 | +5% $24 | +10% $-43 |
|---|---|---|---|---|---|
| Rent | -10% $-118 | -5% $-14 | +0% $90 | +5% $195 | +10% $299 |
| Rate | -1.0pp $209 | -0.5pp $150 | base $90 | +0.5pp $30 | +1.0pp $-32 |
UW: 25.0% down · 7.5% · 30yr · 1.5% tax · 5.0% vac · 8.0% maint · 8.0% mgmt
Financing live
Cash to close
- Down payment
- $58,750
- Closing costs
- $7,050
- Reserves months
- —
- Total cash needed
- —
Loan-product check · same deal, 3 products live
Conventional
25% down · 7.5% · 30yr
- Down + closing
- —
- Monthly P&I
- —
- Monthly cashflow
- —
- DSCR
- —
- Eligible?
- —
Personal DTI + credit; lowest rate.
DSCR
20% down · 8.5% · 30yr
- Down + closing
- —
- Monthly P&I
- —
- Monthly cashflow
- —
- DSCR
- —
- Eligible?
- —
No personal income docs; deal must DSCR.
Hard money
10% down · 12.0% · 12mo
- Down + closing
- —
- Monthly P&I
- —
- Monthly cashflow
- —
- DSCR
- —
- Eligible?
- —
Short-term bridge; refi at stabilization.
Rent comps 8 comps
| Address | Beds | Baths | Sqft | Rent | $/sqft | DOM | Units | Dist |
|---|---|---|---|---|---|---|---|---|
| 3106 Presley Jane Ct Missouri City, TX | 3.0 | 2.0 | 2109 | $2,271 | $1.08 | 6d | 1 | 0.89mi |
| 3314 Dry Creek Dr Missouri City, TX | 4.0 | 3.0 | 2600 | $4,200 | $1.62 | 44d | 1 | 0.98mi |
| 3218 Clayton Terrace Dr Missouri City, TX | 4.0 | 3.0 | 2278 | $2,395 | $1.05 | 20d | 1 | 1.00mi |
| 3623 Elmwood Dale Dr Fresno, TX | 3.0 | 2.0 | 1545 | $1,765 | $1.14 | 44d | 1 | 1.09mi |
| 3212 Aldridge Dr Missouri City, TX | 4.0 | 2.5 | 2489 | $2,650 | $1.06 | 21d | 1 | 1.14mi |
| 2707 Troy Dr Missouri City, TX | 3.0 | 2.5 | 2082 | $2,245 | $1.08 | 2d | 1 | 1.15mi |
| 2709 Troy Dr Missouri City, TX | 3.0 | 2.5 | 2082 | $2,245 | $1.08 | 21d | 1 | 1.15mi |
| 2403 Orchard Run Fresno, TX | 3.0 | 2.0 | 1459 | $2,800 | $1.92 | 4d | 1 | 1.22mi |
HOA detail
- Monthly dues
- $46 · $552/yr
- Likely covers
- gas
Listing history 13 events
-
2026-06-18days on market $235,000 Active 21 DOM
-
2026-06-17statusdays on market $235,000 Active 20 DOM
-
2026-06-15days on market $235,000 Pending 19 DOM
-
2026-06-13days on market $235,000 Pending 17 DOM
-
2026-06-09days on market $235,000 Pending 13 DOM
-
2026-06-08statusdays on market $235,000 Pending 12 DOM
-
2026-06-07days on market $235,000 Active 11 DOM
-
2026-06-04days on market $235,000 Active 8 DOM
-
2026-06-03days on market $235,000 Active 7 DOM
-
2026-06-02days on market $235,000 Active 6 DOM
-
2026-06-01days on market $235,000 Active 5 DOM
-
2026-05-31days on market $235,000 Active 4 DOM
-
2026-05-27$235,000 Active
ⓘ Source: listings_history table (triggers on properties + properties_extension) + one-shot
backfill from property_details.listing_events for pre-trigger history.
Tax reassessment forecast TX · Resets to sale price
- Current annual tax
- $7,428 · $619/mo
- Projected year-2 tax
- $7,428 · $619/mo
- Expected delta
- $0/yr ($0/mo · 0.0%)
ⓘ Screening estimate from a state-policy table — verify with the county assessor before closing.
Climate risk First Street
- Flood 1/10 Low FEMA zone X (unshaded) · 0% chance over 30 yrs
- Wildfire 4/10 Moderate
- Heat 9/10 Extreme 7 d/yr ≥110°F today · 24 d/yr by 30 yrs out
- Wind 9/10 Extreme 99% chance of damaging wind over 30 yrs
- Air quality 2/10 Low 2 unhealthy d/yr today · 2 by 30 yrs out
Nearby sold comps map
Loading sold comps map…
Walkable amenities ~0.75 mi
Loading nearby amenities…
Taxation est. · year 1
- Rental income
- $31,683
- − Mortgage interest
- −$13,164
- − Property taxes
- −$7,428
- − Insurance
- −$1,175
- − Repairs & maintenance
- −$2,535
- − Management
- −$2,535
- − HOA
- −$552
- − Depreciation
- −$6,836
- Taxable loss
- −$2,542
- Est. tax savings @ 24.0%
- +$610
- After-tax cash flow
- $1,696/yr
For passive investors: Depreciation is non-cash, so a rental often shows a tax loss while cash-flowing — sheltering income. Rental losses are passive: they offset passive income freely, and up to $25,000/yr can offset ordinary (W-2) income if you actively participate and your MAGI is under $100k (phasing out to $0 by $150k); unused losses carry forward. On sale, claimed depreciation is recaptured at up to 25%, and gains may owe capital-gains tax (a 1031 exchange can defer both). Figures are a year-1 estimate at your 24.0% rate — not tax advice; consult a CPA.
Schools (NCES district)
- District
- Fort Bend ISD
- NCES district ID
- 4819650
- Math proficiency
- 44% ▼ -15.00%
- Reading proficiency
- 53% ▼ -4.00%
- Median HH income
- $82,360
- Composite
- 44.61/100
- National rank
- #2779
- State rank
- #140 of 826 in TX
Livability — Fresno
- Score
- 62/100
- State rank
- #943
- US rank
- #16815
Category grades
Schools grade is shown separately in the Schools card above.
Census & demographics
- Census place
- Fresno, TX
- County
- Fort Bend County · 836,777 people
- City population
- 26,236
- Metro
- Houston-The Woodlands-Sugar Land, TX
- Population (ZIP)
- 26,236
- Household income
- $94,474
- Rent vs Own
- Severe rent burden
- 360.0
Population outlook (Fort Bend County) Hauer SSP2
- Today (2025)
- 1,004,526 people
- By 2030
- 1,153,104 · +14.8%
- By 2040
- 1,453,718 · +44.7%
- By 2050
- 1,753,781 · +74.6%
- By 2075
- 2,455,772 · +144.5%
- By 2100
- 2,930,528 · +191.7%
Race, ethnicity, and origin ACS 2023
- Neighborhood character
- Diverse neighborhood (Simpson 0.61)
- Race & ethnicity
- Black 51% Hispanic / Latino 34% Two or more races 12% White 8% Asian 2%
- Hispanic origin (detail)
- Mexican 29%
- Common ancestry
- Portuguese 1%
- Foreign-born
- 18% · Canada
- Languages at home
- 67% English-only · Spanish 29% Other Asian/Pacific 1% Other Indo-European 1%
Political lean MEDSL · Fort Bend
- 2024 margin
- Toss-up / Even · D 49.5% · R 47.9% · Other 2.6%
- 2008→2024 swing
- +4.0pp toward D · 2008: -2.4pp · 2024: 1.6pp
- All cycles
- 2024: D+1.6 2020: D+10.6 2016: D+6.6 2012: R+6.8 2008: R+2.4
Not yet ingested
- Civics
- —
Market trends
- HPI YoY
- ▼ -1.98%
- Current HPI
- 231.3921
- Rent YoY
- ▼ -0.95%
- Metro
- Houston-The Woodlands-Sugar Land, TX
- State GDP YoY
- ▲ 3.95%
- F500 in state
- 110
Industry mix (Fortune 500 HQ in TX)
| Industry | F500 HQs | Revenue |
|---|---|---|
| Energy | 16 | $1,198B |
|
||
| Technology | 5 | $198B |
|
||
| Engineering / Construction | 4 | $72B |
|
||
| Energy Services | 3 | $60B |
|
||
| Utilities | 3 | $41B |
|
||
| Healthcare | 2 | $330B |
|
||
Price history
1 event — show timeline
- 2026-05-27 Listed $235,000 HARMLS
Property tax history
+3.3%/yrLatest (2025): $7,428 · +9.7% YoY. Source: county tax records.
Cash-flow waterfall
monthlySold comps — $/sqft
last 12 mo · ≤1 miLoading sold comps…