 12-Plex
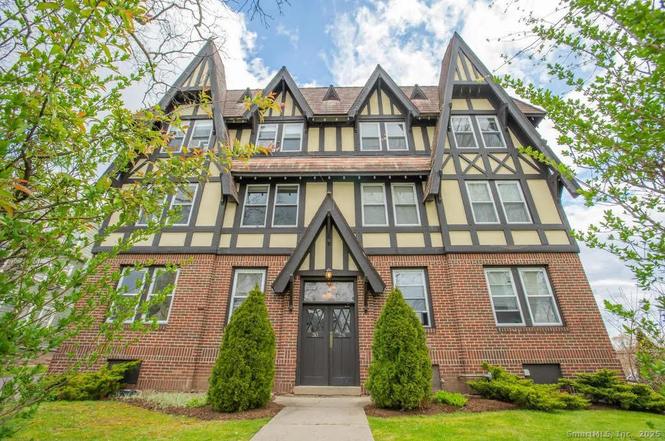
28 Whitney St · Hartford, CT
Flood risk 1/10 · Minimal
- FEMA flood zone
- X (unshaded)
- Chance of flooding over 30 yrs
- 0.0%
- Est. flood insurance / yr
- $473 – $860
Fire risk 1/10 · Minimal
- Est. fire insurance / yr
- $829 – $1,539
Heat risk 5/10 · Moderate
- Hot days now (above 97°F)
- 7 days/yr
- Hot days in 30 yrs
- 16 days/yr
Wind risk 6/10 · Moderate
- Chance of severe wind over 30 yrs
- 27.0%
Air-quality risk 3/10 · Minor
- Unhealthy air days now
- 3 days/yr
- Unhealthy air days in 30 yrs
- 4 days/yr
Risk factors via First Street. Map © Google.
Why this score? — see what drove the B- grade
The composite is a weighted blend of 9 inputs, each scored 0–100. Each bar is that input's sub-score; the figure is the points it added to the 100-point composite (weight × sub-score).
- Cash flow +30.0/30.0
- 1% rule +10.0/10.0
- DSCR +10.0/10.0
- ARV discount +7.5/15.0
- Rent growth +4.2/5.0
- Livability +3.8/5.0
- Condition / age +2.5/5.0
- Schools +1.4/10.0
- Appreciation +0.0/10.0
$1,320,000
🖨 Deal sheet 📄 Offer letter ✓ Due diligence
Multi-family units
County records classify this as Multi-Family (5+ Unit). Listing-text estimate: 12 units. confirmed
5+ unit building — per-unit beds/baths from public records are typically unavailable; the breakdown below (if shown) is an estimate from the listing text.
Listing remarks MLS
*INVESTMENT OPPORTUNITY* 28 Whitney is a 12-unit multi-family that has undergone extensive renovations in the last 12 months. This building features (6) 1-bedroom and (6) 2-bedroom units. Many units have been recently remodeled including new bathroom renovations along with electrical, plumbing, and aesthetic improvements. Newly-installed gas commercial-grade water heater from 2020. Flat roof is approximately 4 years old. Parking is leased from adjacent lot for 10 spaces, which are monitored and includes plowing. Building has a beautiful architectural deign and is conveniently located on the West Hartford line. Close y to major highways.
Key facts
- On site laundry
- Strong rental demand
- Owner paid gas heat
Tags
Neighborhood map
What this means for you Summary
Snapshot
- This is a 12 × 18-bed/12.0-bath units multifamily listed at $1.32M.
Deal economics
- At list price, monthly cash flow is $9k ($113k/yr) — positive. Per door: $783/mo.
- The deal already cash-flows at list — no discount required.
- Meets the 1% rule at list price ($23k rent vs $1.32M).
- Recommended offer: $1.16M (12.0% below list) — sets the bar for market timing.
Location & tenants
- Location reads 76/100 on livability (#58 in CT, #3,553 nationally) — a middle-class / working-renter tenant base. Strengths: amenities A+, commute A+, health & safety A+; Watch: schools D-, crime F, employment F.
- Hartford School District (urban): math 13% / reading 21% proficiency, ranked #150 of 153 in CT (top 98%) — low school quality limits family demand, transient renter base, plan for 1-2y turnover; 84% free/reduced lunch — lower-income household profile, screen leases tightly.
- Market conditions: Rents rising fast (+6.7%/yr); 47 active listings in the ZIP; lower-income renter base — watch delinquency; 1,867 units permitted in Capitol Planning Region in 2024 (1,399 in 5+ unit buildings).
- At $23,442/mo this rent would consume 671% of the median local household income ($42k/yr) (locally 2389% of renters already pay >50% of income on rent) — very limited rent-growth headroom before tenants either downsize or default.
Forward outlook
- Local home prices are declining (-3.0%/yr); year-one equity from $9k of loan paydown is wiped out by about $40k of value loss. Plan a longer hold.
- At projected returns (-3.0% appreciation + 6.7% rent growth), your $370k cash investment doubles in ~4 years — after that, you're playing with house money.
Negotiation context
- It's been on market 130 days — a 12% lower offer ($1.16M) is reasonable based on typical stale-listing flexibility.
- 8 sale attempts since 21y ago with the ask held roughly flat each time — persistent listings suggest the price (not the market) is what's stuck; bring a comps-based counter.
- Current owner paid $1.08M; 22% above their basis — modest negotiation headroom, anchor on the comps not their cost.
Risks & watch-outs
- Watch-outs: built in 1924 — expect roof / HVAC / electrical / plumbing capex.
- Climate carrying-cost: major wind risk, 27% chance of damaging wind over 30y; extreme-heat days projected 7→16/yr by 2055 (HVAC capex compounding) — expect insurance premiums to compound above CPI over the hold.
Questions for the listing agent
- It's been on market 130 days. Have you received any prior offers? Is the seller open to a 12% concession, seller financing, or rate buy-down credit?
- Can we see the unit-by-unit rent roll, current vacancy, and any below-market leases? What's the average tenancy length?
- What capital expenditures (roof, boiler, parking lot, exteriors) have been made in the last 5 years, and what's planned in the next 2?
- Built in 1924 — when were the roof, HVAC, electrical panel, plumbing, and water heater last replaced?
- Why hasn't it sold? Are there any deal-killer items the seller is aware of (foundation, flood, title, zoning, code violations)?
- Is there a deadline driving the sale (1031 exchange, divorce, estate, relocation)? That informs how much negotiation room exists.
- Schools are D-rated, which usually means shorter tenancies and higher turnover. Who's the typical renter profile here, and what's been the actual vacancy rate?
- Crime grade is F in this area — have there been break-ins, vandalism, or insurance claims at this property in the last 3 years? What carrier currently insures it and at what premium?
- What's the average days-on-market for RENTAL listings here right now (not sales)? A rising rental-DOM trend means longer vacancies and softer asking-rent achievability than the comps imply.
- What's the recent tenant-quality profile in this submarket — average credit score on applications, eviction rate, late-payment / NSF rate, and stable-employment percentage? A property-management company in the area should have these aggregated.
- How much new apartment / multifamily construction is in the pipeline within 1–3 miles? Heavy new supply (>2% of stock underway) typically softens rents 12–24 months out; light construction supports rent growth.
Investment metrics
- 1% rule
- 1.78% ✓
- Cap rate
- 14.84%
- Cash-on-cash
- 30.51%
- DSCR
- 2.36
- GRM
- 4.7
CMA / ARV
No comps found within radius.
Projected returns pro-forma
-3.0% appreciation · 6.73% rent growth · sell at horizon
- IRR
- 29.4%
- Equity multiple
- 2.29×
- Total profit
- $476,224
- Equity at exit
- $196,816
- IRR
- 38.8%
- Equity multiple
- 5.31×
- Total profit
- $1,591,242
- Equity at exit
- $114,129
Cash invested: $369,600 (down + closing). Projections, not guarantees.
Landlord ↔ Tenant lean methodology
- Overall (STATE)
- 27 Tenant-Leaning
- State Connecticut
- 27 Tenant-Leaning · D+7
- County
- — inherits STATE
- City
- — inherits STATE
ZIP-level market 06105
- Home prices YoY
- -25.6%
- Rents YoY
- 6.7%
- Active inventory
- 47
- Price-to-rent
- 56.3×
Monthly cashflow live
- Estimated rent
- $23,442 medium interval (Pro) →
- Mortgage (P&I)
- −$6,922
- Tax est. 1.5%
- −$1,650 /mo · $19,800/yr
- Insurance
- −$550
- HOA
- −$0
- Vacancy / Maint / Mgmt
- −$4,923
- Net cashflow
- $9,397
Break-even live
12-unit breakdown (identical units grouped — click to expand)
| Units | Beds | Baths | Est. rent |
|---|---|---|---|
| 12× units | 18 | 12 | $23,436 |
| #1 | 18 | 12 | $1,953 |
| #2 | 18 | 12 | $1,953 |
| #3 | 18 | 12 | $1,953 |
| #4 | 18 | 12 | $1,953 |
| #5 | 18 | 12 | $1,953 |
| #6 | 18 | 12 | $1,953 |
| #7 | 18 | 12 | $1,953 |
| #8 | 18 | 12 | $1,953 |
| #9 | 18 | 12 | $1,953 |
| #10 | 18 | 12 | $1,953 |
| #11 | 18 | 12 | $1,953 |
| #12 | 18 | 12 | $1,953 |
| Total (12 units) | $23,442 | ||
UW: 25.0% down · 7.5% · 30yr · 1.5% tax · 5.0% vac · 8.0% maint · 8.0% mgmt
Financing live
Cash to close
- Down payment
- $330,000
- Closing costs
- $39,600
- Reserves months
- —
- Total cash needed
- —
Loan-product check · same deal, 3 products live
Conventional
25% down · 7.5% · 30yr
- Down + closing
- —
- Monthly P&I
- —
- Monthly cashflow
- —
- DSCR
- —
- Eligible?
- —
Personal DTI + credit; lowest rate.
DSCR
20% down · 8.5% · 30yr
- Down + closing
- —
- Monthly P&I
- —
- Monthly cashflow
- —
- DSCR
- —
- Eligible?
- —
No personal income docs; deal must DSCR.
Hard money
10% down · 12.0% · 12mo
- Down + closing
- —
- Monthly P&I
- —
- Monthly cashflow
- —
- DSCR
- —
- Eligible?
- —
Short-term bridge; refi at stabilization.
Listing history 21 events
-
2026-04-11status Under Contract
-
2026-02-24historical Under Contract - Continue to Show
-
2026-02-06status Active
-
2025-12-31historical Under Contract - Continue to Show
-
2025-12-01$1,320,000 Active
-
2022-04-25soldstatus $1,081,216 Closed 644-char remark
Show marketing remark (644 chars)
*INVESTMENT OPPORTUNITY* 28 Whitney is a 12-unit multi-family that has undergone extensive renovations in the last 12 months. This building features (6) 1-bedroom and (6) 2-bedroom units. Many units have been recently remodeled including new bathroom renovations along with electrical, plumbing, and aesthetic improvements. Newly-installed gas commercial-grade water heater from 2020. Flat roof is approximately 4 years old. Parking is leased from adjacent lot for 10 spaces, which are monitored and includes plowing. Building has a beautiful architectural deign and is conveniently located on the West Hartford line. Close y to major highways.
-
2022-03-25historical Under Contract - Continue to Show 644-char remark
Show marketing remark (644 chars)
*INVESTMENT OPPORTUNITY* 28 Whitney is a 12-unit multi-family that has undergone extensive renovations in the last 12 months. This building features (6) 1-bedroom and (6) 2-bedroom units. Many units have been recently remodeled including new bathroom renovations along with electrical, plumbing, and aesthetic improvements. Newly-installed gas commercial-grade water heater from 2020. Flat roof is approximately 4 years old. Parking is leased from adjacent lot for 10 spaces, which are monitored and includes plowing. Building has a beautiful architectural deign and is conveniently located on the West Hartford line. Close y to major highways.
-
2022-03-11$1,150,000 Active 644-char remark
Show marketing remark (644 chars)
*INVESTMENT OPPORTUNITY* 28 Whitney is a 12-unit multi-family that has undergone extensive renovations in the last 12 months. This building features (6) 1-bedroom and (6) 2-bedroom units. Many units have been recently remodeled including new bathroom renovations along with electrical, plumbing, and aesthetic improvements. Newly-installed gas commercial-grade water heater from 2020. Flat roof is approximately 4 years old. Parking is leased from adjacent lot for 10 spaces, which are monitored and includes plowing. Building has a beautiful architectural deign and is conveniently located on the West Hartford line. Close y to major highways.
-
2020-10-26historical
-
2020-09-15$1,150,000 Active
-
2018-11-15soldstatus $888,000 Closed
-
2018-10-26historical
-
2018-10-19historical Under Contract - Continue to Show
-
2018-10-05$904,900 Active
-
2017-09-29soldstatus $845,000
-
2017-06-17historical
-
2017-06-01$895,000
-
2007-03-30soldstatus $740,000
-
2007-02-01$789,900
-
2005-03-28soldstatus $530,000
-
2005-01-15$589,000
ⓘ Source: listings_history table (triggers on properties + properties_extension) + one-shot
backfill from property_details.listing_events for pre-trigger history.
Climate risk First Street
- Flood 1/10 Low FEMA zone X (unshaded) · 0% chance over 30 yrs
- Wildfire 1/10 Low
- Heat 5/10 Major 7 d/yr ≥97°F today · 16 d/yr by 30 yrs out
- Wind 6/10 Major 27% chance of damaging wind over 30 yrs
- Air quality 3/10 Moderate 3 unhealthy d/yr today · 4 by 30 yrs out
Nearby sold comps map
Loading sold comps map…
Walkable amenities ~0.75 mi
Loading nearby amenities…
Taxation est. · year 1
- Rental income
- $281,304
- − Mortgage interest
- −$73,941
- − Property taxes
- −$19,800
- − Insurance
- −$6,600
- − Repairs & maintenance
- −$22,504
- − Management
- −$22,504
- − Depreciation
- −$38,400
- Taxable income
- $97,555
- Est. tax owed @ 24.0%
- −$23,413
- After-tax cash flow
- $89,350/yr
For passive investors: Depreciation is non-cash, so a rental often shows a tax loss while cash-flowing — sheltering income. Rental losses are passive: they offset passive income freely, and up to $25,000/yr can offset ordinary (W-2) income if you actively participate and your MAGI is under $100k (phasing out to $0 by $150k); unused losses carry forward. On sale, claimed depreciation is recaptured at up to 25%, and gains may owe capital-gains tax (a 1031 exchange can defer both). Figures are a year-1 estimate at your 24.0% rate — not tax advice; consult a CPA.
Schools (NCES district)
- District
- Hartford School District
- NCES district ID
- 0901920
- Math proficiency
- 13% ▼ -5.00%
- Reading proficiency
- 21% ▼ -6.00%
- Median HH income
- $30,521
- Composite
- 13.54/100
- National rank
- #9514
- State rank
- #150 of 153 in CT
Livability — Hartford
- Score
- 76/100
- State rank
- #58
- US rank
- #3553
Category grades
Schools grade is shown separately in the Schools card above.
Census & demographics
- Census place
- Hartford, CT
- County
- Hartford County · 754,208 people
- City population
- 121,162
- Metro
- Hartford-East Hartford-Middletown, CT
- Population (ZIP)
- 19,174
- Household income
- $41,937
- Rent vs Own
- Severe rent burden
- 2389.0
Population outlook (Capitol County) Hauer SSP2
- By 2040
- 1,063,519
Race, ethnicity, and origin ACS 2023
- Neighborhood character
- Highly diverse neighborhood (Simpson 0.71)
- Race & ethnicity
- Black 39% White 28% Hispanic / Latino 26% Two or more races 14% Asian 2%
- Hispanic origin (detail)
- Puerto Rican 18% Cuban 1% Dominican 3%
- Common ancestry
- Romanian 3% Lithuanian 2% Estonian 1%
- Foreign-born
- 20% · Canada, United Kingdom
- Languages at home
- 74% English-only · Spanish 18% Other Indo-European 3% French/Haitian/Cajun 2%
Political lean MEDSL · Capitol
- 2024 margin
- Strong D (+21.9) · D 60.1% · R 38.2% · Other 1.7%
- All cycles
- 2024: D+21.9
Not yet ingested
- Civics
- —
Market trends
- HPI YoY
- ▼ -59.58%
- Current HPI
- 173.3602
- Rent YoY
- ▲ 6.73%
- Metro
- Hartford-East Hartford-Middletown, CT
- State GDP YoY
- ▲ 1.06%
- F500 in state
- 38
Industry mix (Fortune 500 HQ in CT)
| Industry | F500 HQs | Revenue |
|---|---|---|
| Industrial Machinery | 4 | $38B |
|
||
| Insurance | 3 | $71B |
|
||
| Financial Services | 2 | $25B |
|
||
| Transportation / Logistics | 2 | $18B |
|
||
| Healthcare | 1 | $247B |
|
||
| Telecommunications | 1 | $55B |
|
||
Price history
+124.1% since first listed21 events — show timeline
- 2026-04-11 Pending — Smart MLS
- 2026-02-24 Contingent — Smart MLS
- 2026-02-06 Relisted — Smart MLS
- 2025-12-31 Contingent — Smart MLS
- 2025-12-01 Listed $1,320,000 Smart MLS
- 2022-04-25 Sold (MLS) $1,081,216 Smart MLS
- 2022-03-25 Contingent — Smart MLS
- 2022-03-11 Listed $1,150,000 Smart MLS
- 2020-10-26 Listing Removed — Smart MLS
- 2020-09-15 Listed $1,150,000 Smart MLS
- 2018-11-15 Sold (MLS) $888,000 Smart MLS
- 2018-10-26 Listing Removed — Smart MLS
- 2018-10-19 Contingent — Smart MLS
- 2018-10-05 Listed $904,900 Smart MLS
- 2017-09-29 Sold (MLS) $845,000 Smart MLS
- 2017-06-17 Listing Removed — Smart MLS
- 2017-06-01 Listed $895,000 Smart MLS
- 2007-03-30 Sold (MLS) $740,000 Smart MLS
- 2007-02-01 Listed $789,900 Smart MLS
- 2005-03-28 Sold (MLS) $530,000 Smart MLS
- 2005-01-15 Listed $589,000 Smart MLS
Cash-flow waterfall
monthlySold comps — $/sqft
last 12 mo · ≤1 miLoading sold comps…