 🏷️ Likely Rental
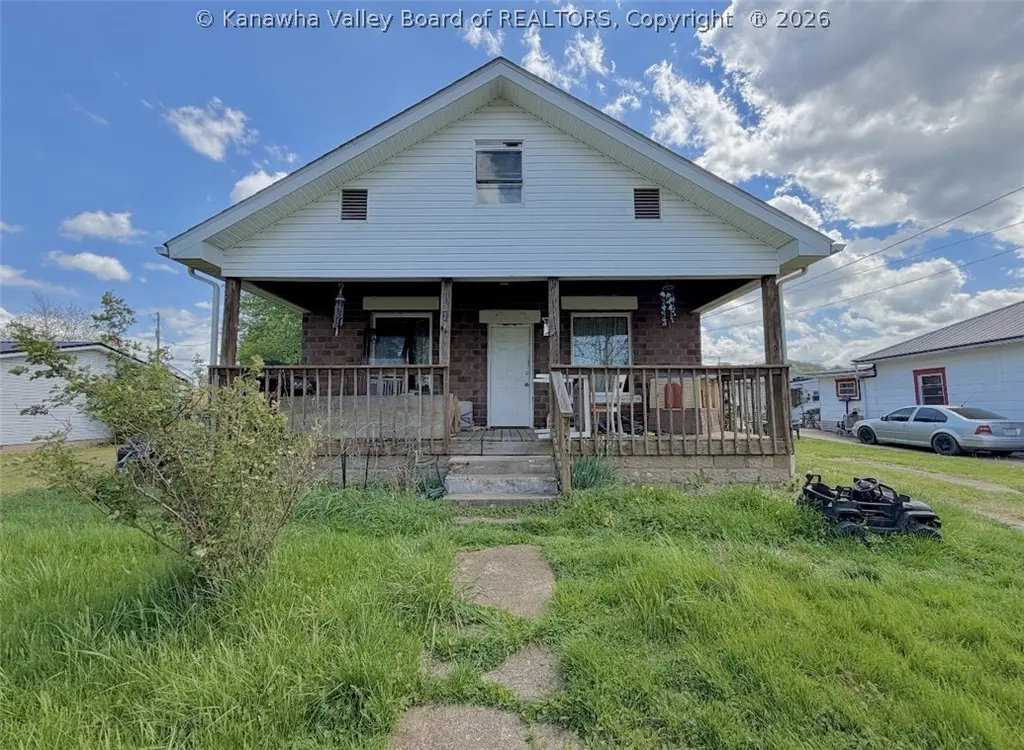
2114 Monroe Ave · Point Pleasant, WV
Flood risk 6/10 · Moderate
- FEMA flood zone
- X (unshaded)
- Chance of flooding over 30 yrs
- 0.66%
- Est. flood insurance / yr
- $473 – $860
Fire risk 3/10 · Minor
- Est. fire insurance / yr
- $787 – $1,461
Heat risk 5/10 · Moderate
- Hot days now (above 101°F)
- 7 days/yr
- Hot days in 30 yrs
- 19 days/yr
Wind risk 2/10 · Minimal
- Chance of severe wind over 30 yrs
- 1.0%
Air-quality risk 1/10 · Minimal
- Unhealthy air days now
- 0 days/yr
- Unhealthy air days in 30 yrs
- 0 days/yr
Risk factors via First Street. Map © Google.
Why this score? — see what drove the A grade
The composite is a weighted blend of 9 inputs, each scored 0–100. Each bar is that input's sub-score; the figure is the points it added to the 100-point composite (weight × sub-score).
- Cash flow +30.0/30.0
- ARV discount +15.0/15.0
- 1% rule +10.0/10.0
- DSCR +10.0/10.0
- Appreciation +10.0/10.0
- Livability +3.4/5.0
- Rent growth +2.5/5.0
- Condition / age +2.5/5.0
- Schools +2.2/10.0
$56,000
🖨 Deal sheet (PDF) 📄 Offer letter ✓ Due diligence
Listing remarks
Investor opportunity with long-term upside! This block home offers 3-4 bedrooms with two bedrooms on the main floor and two connected bedrooms upstairs, providing flexible layout options for tenants or future resell. Main floor laundry and a gas furnace add practical value, while the full unfinished basement offers additional storage space. Property is tenant-occupied with a lease in place through November 1, 2026, creating immediate rental income for the next owner. Situated on a large double lot with alley access and off-street parking, the property also presents potential for additional rental units or future expansion, subject to buyer verification and local zoning approval. Priced to s
Key facts
- Gas furnace
- Main floor laundry
- Large double lot
Tags
Property features AI
Exterior
- Utilities: Public water; Public sewer; Cable available
- Home design: Single family residence; Residential property
- Construction: Block construction; Composition/shingle roof
- Exterior features: Front porch
Interior
- Kitchen: Electric range; Refrigerator
- Bedrooms: 7 total rooms (includes bedrooms and living spaces)
- Flooring: Carpet
- Bathrooms: 1 full bathroom
- Heating & cooling: Heat pump; Forced air; Central cooling (heat pump)
- Interior features: Eat-in kitchen; Insulated windows; Full basement
Neighborhood map
What this means for you Summary
Snapshot
- This is a 4-bed/1.0-bath single-family listed at $56k.
Deal economics
- At list price, monthly cash flow is $402 ($5k/yr) — positive.
- The deal already cash-flows at list — no discount required.
- Meets the 1% rule at list price ($1k rent vs $56k).
- Cap rate 14.9% vs local median 6.1% in Point Pleasant — top-decile yield for the area; either an underpriced asset or a hidden risk that comps aren't pricing in. Stress-test before assuming the spread holds.
Location & tenants
- Location reads 67/100 on livability (#95 in WV) — a middle-class / working-renter tenant base. Strengths: cost of living A+, housing A+, crime A; Watch: health & safety C-, employment D, amenities F.
- Mason County Schools (town): math 20% / reading 33% proficiency, ranked #44 of 55 in WV (top 80%) — low school quality limits family demand, transient renter base, plan for 1-2y turnover.
- Zoned schools: Pt. Pleasant Primary (351 students, 0% FRL); Point Pleasant Junior/Senior High School (math 13% / reading 35%, grade F, #95 of 110 statewide, top 86%, 1,107 students, 0% FRL) — zoned schools average 0% FRL vs 47% district-wide (47 pts lower); this property's tenant base skews higher-income than the district average.
- Market conditions: 58 active listings in the ZIP; 1 comparable units currently listed for rent nearby; 3 units permitted in Mason County in 2024 (0 in 5+ unit buildings).
Forward outlook
- In year one you build about $6k of equity ($387 loan paydown + $6k appreciation (10.0% local appreciation)).
- Mason County population projected at -14% by 2050 — secular population decline; favor cash flow + early exit over multi-decade hold.
- At projected returns (10.0% appreciation + 3.0% rent growth), your $16k cash investment doubles in ~2 years — after that, you're playing with house money.
- By year 6, paydown + projected appreciation supports a ~$35k cash-out refi (75% LTV) — recoverable capital for the next deal without selling this one.
Negotiation context
- Only 5 days on market — expect competitive offers; lowballing is unlikely to land.
Risks & watch-outs
- Watch-outs: built in 1940 — expect roof / HVAC / electrical / plumbing capex.
- Climate carrying-cost: major flood risk; extreme-heat days projected 7→19/yr by 2055 (HVAC capex compounding) — expect insurance premiums to compound above CPI over the hold.
Questions for the listing agent
- Built in 1940 — when were the roof, HVAC, electrical panel, plumbing, and water heater last replaced?
- Is there a deadline driving the sale (1031 exchange, divorce, estate, relocation)? That informs how much negotiation room exists.
- Schools are F-rated, which usually means shorter tenancies and higher turnover. Who's the typical renter profile here, and what's been the actual vacancy rate?
- What's the average days-on-market for RENTAL listings here right now (not sales)? A rising rental-DOM trend means longer vacancies and softer asking-rent achievability than the comps imply.
- What's the recent tenant-quality profile in this submarket — average credit score on applications, eviction rate, late-payment / NSF rate, and stable-employment percentage? A property-management company in the area should have these aggregated.
- How much new for-sale + rental construction is in the pipeline within 1–3 miles? Heavy new supply typically softens prices + rents 12–24 months out; constrained supply supports both.
Investment metrics
- 1% rule
- 1.79% ✓
- Cap rate
- 14.91%
- Cash-on-cash
- 30.79%
- DSCR
- 2.37
- GRM
- 4.7
CMA / ARV
- ARV (median comp)
- $110,566
- List price
- $56,000
- Delta
- -49.35%
- Verdict
- UNDERPRICED
- Comps
- 20 within 1.0 mi
Show comp detail 11 sales within ~0.75 mi
| Address | Dist | Beds/Ba | Sqft | Sold | Price | $/sf | Match |
|---|---|---|---|---|---|---|---|
| 2114 Monroe Ave | 0.00mi | 4/1.0 | 1,190 (0%) | 0mo | $50,000 | $42 | 100 |
| 34 Windsor Ct | 0.31mi | 4/1.0 | 1,254 (+5%) | 15mo | $112,000 | $89 | 64 |
| 2222 Mt. Vernon Ave | 0.20mi | 3/2.0 (-1) | 1,164 (-2%) | 17mo | $130,000 | $112 | 64 |
| 2409 Monroe Ave | 0.35mi | 3/1.5 (-1) | 1,288 (+8%) | 10mo | $53,900 | $42 | 55 |
| 2702 Lincoln Ave | 0.70mi | 3/1.0 (-1) | 1,240 (+4%) | 4mo | $160,000 | $129 | 52 |
| 150 S Park Dr | 0.58mi | 3/1.0 (-1) | 1,304 (+10%) | 11mo | $107,000 | $82 | 43 |
| 191 N Park Dr | 0.59mi | 3/1.5 (-1) | 1,332 (+12%) | 9mo | $147,000 | $110 | 38 |
| 151 S Park Dr | 0.61mi | 3/2.0 (-1) | 1,304 (+10%) | 13mo | $135,000 | $104 | 36 |
| 103 Liberty St | 0.46mi | 3/1.0 (-1) | 1,368 (+15%) | 21mo | $140,000 | $102 | 31 |
| 2618 Madison Ave | 0.66mi | 3/1.0 (-1) | 1,348 (+13%) | 16mo | $78,000 | $58 | 29 |
| 2618 Madison Ave | 0.66mi | 3/1.0 (-1) | 1,348 (+13%) | 16mo | $78,000 | $58 | 29 |
Match score weights: distance 35% · size 25% · config 20% · recency 20%. Top-matched comps best support the ARV.
Projected returns pro-forma
10.0% appreciation · 3.0% rent growth · sell at horizon
- IRR
- 47.7%
- Equity multiple
- 4.58×
- Total profit
- $56,141
- Equity at exit
- $50,449
- IRR
- 41.5%
- Equity multiple
- 10.26×
- Total profit
- $145,204
- Equity at exit
- $108,796
Cash invested: $15,680 (down + closing). Projections, not guarantees.
Landlord ↔ Tenant lean methodology
- Overall (STATE)
- 83 Strongly Landlord-Friendly
- State West Virginia
- 83 Strongly Landlord-Friendly · R+22
- County
- — inherits STATE
- City
- — inherits STATE
ZIP-level market 25550
- Home prices YoY
- 6.7%
- Active inventory
- 58
- Price-to-rent
- 4.7×
Monthly cashflow live
- Estimated rent
- $1,000 medium interval (Pro) →
- Mortgage (P&I)
- −$294
- Tax from tax record
- −$71 /mo · $848/yr
- Insurance
- −$23
- HOA
- −$0
- Vacancy / Maint / Mgmt
- −$210
- Net cashflow
- $402
Break-even live
Sensitivity live
| Price | -10% $434 | -5% $418 | +0% $402 | +5% $387 | +10% $371 |
|---|---|---|---|---|---|
| Rent | -10% $323 | -5% $363 | +0% $402 | +5% $442 | +10% $481 |
| Rate | -1.0pp $431 | -0.5pp $417 | base $402 | +0.5pp $388 | +1.0pp $373 |
UW: 25.0% down · 7.5% · 30yr · 1.5% tax · 5.0% vac · 8.0% maint · 8.0% mgmt
Financing live
Cash to close
- Down payment
- $14,000
- Closing costs
- $1,680
- Reserves months
- —
- Total cash needed
- —
Loan-product check · same deal, 3 products live
Conventional
25% down · 7.5% · 30yr
- Down + closing
- —
- Monthly P&I
- —
- Monthly cashflow
- —
- DSCR
- —
- Eligible?
- —
Personal DTI + credit; lowest rate.
DSCR
20% down · 8.5% · 30yr
- Down + closing
- —
- Monthly P&I
- —
- Monthly cashflow
- —
- DSCR
- —
- Eligible?
- —
No personal income docs; deal must DSCR.
Hard money
10% down · 12.0% · 12mo
- Down + closing
- —
- Monthly P&I
- —
- Monthly cashflow
- —
- DSCR
- —
- Eligible?
- —
Short-term bridge; refi at stabilization.
Rent comps 1 comps
| Address | Beds | Baths | Sqft | Rent | $/sqft | DOM | Units | Dist |
|---|---|---|---|---|---|---|---|---|
| 1151 Evergreen Dr Point Pleasant, WV | 2.0–3.0 | 1.5 | 730 | $1,000 | $1.37 | 46d | 1 | 0.94mi |
Listing history 3 events
-
2026-05-18status Pending 853-char remark
-
2026-05-13$56,000 Active 853-char remark
-
1989-11-06soldstatus $16,000
ⓘ Source: listings_history table (triggers on properties + properties_extension) + one-shot
backfill from property_details.listing_events for pre-trigger history.
Tax reassessment forecast WV · Resets to sale price
- Current annual tax
- $848 · $71/mo
- Projected year-2 tax
- $848 · $71/mo
- Expected delta
- $0/yr ($0/mo · 0.0%)
ⓘ Screening estimate from a state-policy table — verify with the county assessor before closing.
Climate risk First Street
- Flood 6/10 Major FEMA zone X (unshaded) · 66% chance over 30 yrs
- Wildfire 3/10 Moderate
- Heat 5/10 Major 7 d/yr ≥101°F today · 19 d/yr by 30 yrs out
- Wind 2/10 Low 100% chance of damaging wind over 30 yrs
- Air quality 1/10 Low 0 unhealthy d/yr today · 0 by 30 yrs out
Nearby sold comps map
Loading sold comps map…
Walkable amenities ~0.75 mi
Loading nearby amenities…
Taxation est. · year 1
- Rental income
- $12,000
- − Mortgage interest
- −$3,137
- − Property taxes
- −$848
- − Insurance
- −$280
- − Repairs & maintenance
- −$960
- − Management
- −$960
- − Depreciation
- −$1,629
- Taxable income
- $4,186
- Est. tax owed @ 24.0%
- −$1,005
- After-tax cash flow
- $3,824/yr
For passive investors: Depreciation is non-cash, so a rental often shows a tax loss while cash-flowing — sheltering income. Rental losses are passive: they offset passive income freely, and up to $25,000/yr can offset ordinary (W-2) income if you actively participate and your MAGI is under $100k (phasing out to $0 by $150k); unused losses carry forward. On sale, claimed depreciation is recaptured at up to 25%, and gains may owe capital-gains tax (a 1031 exchange can defer both). Figures are a year-1 estimate at your 24.0% rate — not tax advice; consult a CPA.
Schools (NCES district)
- District
- Mason County Schools
- NCES district ID
- 5400780
- Math proficiency
- 20% ▼ -13.00%
- Reading proficiency
- 33% ▼ -10.00%
- Median HH income
- $37,623
- Composite
- 22.07/100
- National rank
- #8191
- State rank
- #44 of 55 in WV
Livability — Point Pleasant
- Score
- 67/100
- State rank
- #95
- US rank
- #10881
Category grades
Schools grade is shown separately in the Schools card above.
Census & demographics
- Census place
- Point Pleasant, WV
- County
- Mason · 14,594 people
- Population (ZIP)
- 8,925
- Household income
- $49,940
- Rent vs Own
- Severe rent burden
- 10.6
Population outlook (Mason County) Hauer SSP2
- Today (2025)
- 26,174 people
- By 2030
- 25,482 · -2.6%
- By 2040
- 23,934 · -8.6%
- By 2050
- 22,432 · -14.3%
- By 2075
- 19,241 · -26.5%
- By 2100
- 15,427 · -41.1%
Race, ethnicity, and origin ACS 2023
- Neighborhood character
- Predominantly White (95%)
- Race & ethnicity
- White 95% Two or more races 2% Hispanic / Latino 2% Black 2%
- Common ancestry
- Slovak 1% Serbian 1% Lithuanian 1%
- Foreign-born
- 0%
Political lean MEDSL · Mason
- 2024 margin
- Solid R (+58.0) · D 20.0% · R 78.0% · Other 1.9%
- 2008→2024 swing
- -45.1pp toward R · 2008: -12.9pp · 2024: -58.0pp
- All cycles
- 2024: R+58.0 2020: R+53.2 2016: R+54.7 2012: R+20.3 2008: R+12.9
Not yet ingested
- Civics
- —
Market trends
- HPI YoY
- ▲ 11.63%
- Current HPI
- 185.6226
- Rent YoY
- —
- Metro
- —
- State GDP YoY
- —
- F500 in state
- 0
Price history
+212.5% since first listed4 events — show timeline
- 2026-06-11 Sold (MLS) $50,000 KVBOR
- 2026-05-18 Pending — KVBOR
- 2026-05-13 Listed $56,000 KVBOR
- 1989-11-06 Sold (Public Records) $16,000 Public Records
Property tax history
+4.8%/yrLatest (2025): $848 · +18.7% YoY. Source: county tax records.
Cash-flow waterfall
monthlySold comps — $/sqft
last 12 mo · ≤1 miLoading sold comps…