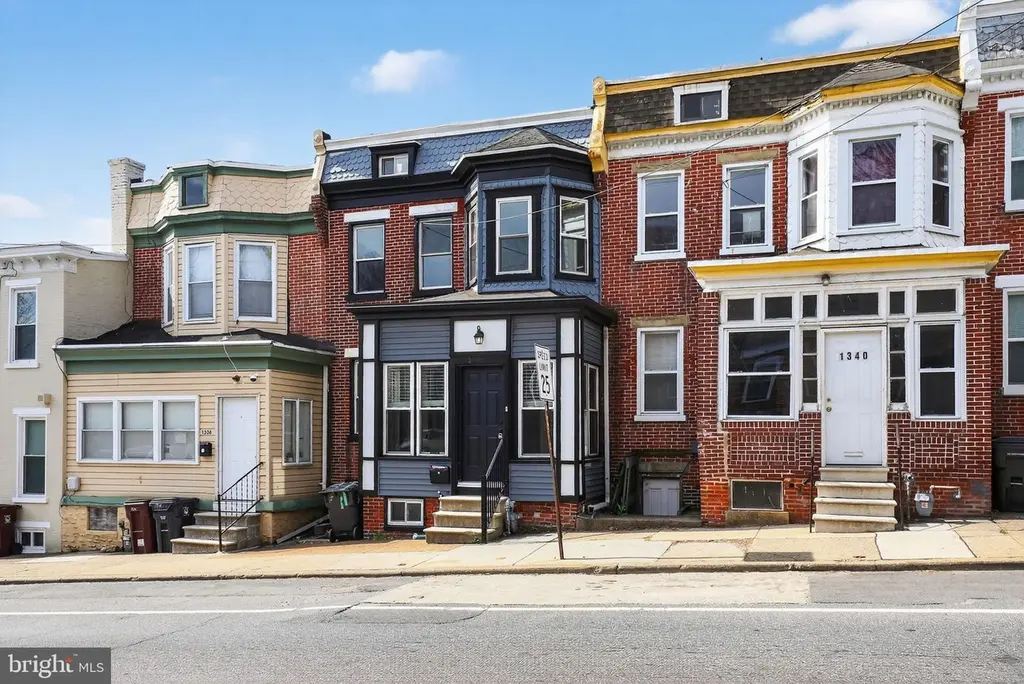
1338 Lancaster Ave · Wilmington, DE
Flood risk 1/10 · Minimal
- FEMA flood zone
- X (unshaded)
- Chance of flooding over 30 yrs
- 0.0%
- Est. flood insurance / yr
- $473 – $860
Fire risk 1/10 · Minimal
- Est. fire insurance / yr
- $476 – $884
Heat risk 8/10 · Major
- Hot days now (above 103°F)
- 7 days/yr
- Hot days in 30 yrs
- 16 days/yr
Wind risk 6/10 · Moderate
- Chance of severe wind over 30 yrs
- 27.0%
Air-quality risk 3/10 · Minor
- Unhealthy air days now
- 3 days/yr
- Unhealthy air days in 30 yrs
- 4 days/yr
Risk factors via First Street. Map © Google.
Why this score? — see what drove the C+ grade
The composite is a weighted blend of 9 inputs, each scored 0–100. Each bar is that input's sub-score; the figure is the points it added to the 100-point composite (weight × sub-score).
- Cash flow +21.8/30.0
- ARV discount +15.0/15.0
- DSCR +7.0/10.0
- 1% rule +4.6/10.0
- Rent growth +4.1/5.0
- Livability +3.2/5.0
- Schools +2.5/10.0
- Condition / age +2.5/5.0
- Appreciation +0.0/10.0
$199,900
🖨 Deal sheet 📄 Offer letter ✓ Due diligence
Listing remarks
Welcome to this beautifully renovated three-bedroom attached home in Wilmington, where thoughtful updates and classic character are blended seamlessly. A welcoming enclosed front porch sets the tone, inviting you into a spacious foyer that immediately reveals the home’s unique charm. The main level offers a bright and airy living room with abundant natural light and a decorative faux fireplace, flowing effortlessly into a well scaled dining space, ideal for everyday living and entertaining. The adjacent kitchen is well-appointed with granite countertops, stainless steel appliances, glass-front cabinetry, and dedicated wine storage, combining both style and functionality. Upstairs, yo
Key facts
- Granite countertops
- Enclosed front porch
- Built 1909
Tags
Property features AI
Finance
- Other: Assessed above-grade finished area: 1,700 (source: Assessor); Ownership interest: Fee Simple
Exterior
- Parking: On-street parking
- Utilities: Public water; Public sewer; Electric service with circuit breakers; Natural gas for heating and hot water
- Home design: Interior townhouse/rowhouse; Flat roof; Fee simple ownership; Excellent condition
- Construction: Brick construction; Brick/mortar foundation; Above grade and below grade structures; Built year per assessor
- Exterior features: 20 x 60 lot dimensions; Urban location; Municipal trash service; Bus stop within 1 mile; commuter rail 1–5 miles
Interior
- Kitchen: Built-in range; Built-in microwave; Dishwasher
- Bedrooms: 3 bedrooms on the first upper level
- Bathrooms: 1 full bathroom (on 1st upper level); 1 half bathroom (main level)
- Heating & cooling: Forced air heating (natural gas); Central air conditioning
- Interior features: Built-in microwave; Built-in range; Dishwasher; Basement (unfinished)
- Laundry & utility: Laundry in basement
Neighborhood map
What this means for you Summary
Snapshot
- This is a 3-bed/1.0-bath townhouse listed at $200k.
Deal economics
- At list price, monthly cash flow is $311 ($4k/yr) — positive.
- The deal already cash-flows at list — no discount required.
- To meet the 1% rule (rent ≥ 1% of price), the offer needs to be $193k (3.7% below list).
- Recommended offer: $193k (3.7% below list) — sets the bar for 1% rule.
- Cap rate 8.2% vs local median 5.6% in Wilmington — top-decile yield for the area; either an underpriced asset or a hidden risk that comps aren't pricing in. Stress-test before assuming the spread holds.
Location & tenants
- Location reads 64/100 on livability (#52 in DE) — a middle-class / working-renter tenant base. Strengths: cost of living A+, housing A; Watch: employment D+, schools D, commute D.
- Christina School District (suburban): math 22% / reading 33% proficiency, ranked #18 of 26 in DE (top 69%) — low school quality limits family demand, transient renter base, plan for 1-2y turnover.
- Market conditions: Rents rising fast (+6.3%/yr); 167 active listings in the ZIP; 40 comparable units currently listed for rent nearby; rentals at typical pace (median 19d on market — plan ~3-4 weeks tenant-placement turnaround); 1,367 units permitted in New Castle County in 2024 (201 in 5+ unit buildings).
- This rent runs 38% of the median local income ($60k/yr) — at the standard rent-burdened threshold; future hikes will face affordability resistance.
Forward outlook
- Local home prices are declining (-3.0%/yr); year-one equity from $1k of loan paydown is wiped out by about $6k of value loss. Plan a longer hold.
- New Castle County population projected at +9% by 2050 — modest demand growth; plan on rents tracking national, not racing it.
- At projected returns (-3.0% appreciation + 6.3% rent growth), your $56k cash investment doubles in ~10 years — after that, you're playing with house money.
Negotiation context
- It's been on market 25 days — a 2% lower offer ($197k) is reasonable based on typical stale-listing flexibility.
Risks & watch-outs
- Watch-outs: built in 1909 — expect roof / HVAC / electrical / plumbing capex.
- Climate carrying-cost: major wind risk, 27% chance of damaging wind over 30y; extreme-heat days projected 7→16/yr by 2055 (HVAC capex compounding) — expect insurance premiums to compound above CPI over the hold.
Questions for the listing agent
- Built in 1909 — when were the roof, HVAC, electrical panel, plumbing, and water heater last replaced?
- Is there a deadline driving the sale (1031 exchange, divorce, estate, relocation)? That informs how much negotiation room exists.
- Schools are D-rated, which usually means shorter tenancies and higher turnover. Who's the typical renter profile here, and what's been the actual vacancy rate?
- Crime grade is F in this area — have there been break-ins, vandalism, or insurance claims at this property in the last 3 years? What carrier currently insures it and at what premium?
- What's the average days-on-market for RENTAL listings here right now (not sales)? A rising rental-DOM trend means longer vacancies and softer asking-rent achievability than the comps imply.
- What's the recent tenant-quality profile in this submarket — average credit score on applications, eviction rate, late-payment / NSF rate, and stable-employment percentage? A property-management company in the area should have these aggregated.
- How much new for-sale + rental construction is in the pipeline within 1–3 miles? Heavy new supply typically softens prices + rents 12–24 months out; constrained supply supports both.
Investment metrics
- 1% rule
- 0.96% ✗
- Cap rate
- 8.16%
- Cash-on-cash
- 6.66%
- DSCR
- 1.30
- GRM
- 8.6
CMA / ARV
- ARV (on-the-fly)
- $292,400
- Comps found
- 12
Show comp detail 12 sales within ~0.75 mi
| Address | Dist | Beds/Ba | Sqft | Sold | Price | $/sf | Match |
|---|---|---|---|---|---|---|---|
| 1011 W 5th St | 0.34mi | 4/2.0 (+1) | 1,725 (+2%) | 0mo | $240,000 | $139 | 72 |
| 315 S Jackson St | 0.29mi | 3/1.5 | 1,475 (-13%) | 1mo | $180,000 | $122 | 62 |
| 118 5th Ave | 0.62mi | 3/2.5 | 1,744 (+3%) | 0mo | $300,000 | $172 | 60 |
| 12 8th Ave | 0.67mi | 2/1.5 (-1) | 1,700 (0%) | 1mo | $205,000 | $121 | 60 |
| 1204 W 8th St | 0.43mi | 3/1.5 | 1,525 (-10%) | 0mo | $355,000 | $233 | 60 |
| 1302 W 6th St | 0.31mi | 4/2.5 (+1) | 1,525 (-10%) | 1mo | $265,000 | $174 | 57 |
| 837 N Madison St | 0.66mi | 4/1.5 (+1) | 1,775 (+4%) | 0mo | $315,000 | $177 | 54 |
| 606 N Franklin St | 0.34mi | 4/2.0 (+1) | 1,500 (-12%) | 2mo | $140,000 | $93 | 54 |
| 728 S Lincoln St | 0.55mi | 3/1.5 | 1,900 (+12%) | 1mo | $325,000 | $171 | 52 |
| 402 W 6th St | 0.68mi | 3/2.5 | 1,800 (+6%) | 1mo | $249,000 | $138 | 51 |
| 2 Eighth Ave | 0.66mi | 2/1.5 (-1) | 1,520 (-11%) | 2mo | $290,000 | $191 | 43 |
| 1022 Trenton Pl | 0.75mi | 3/1.5 | 1,475 (-13%) | 2mo | $295,000 | $200 | 40 |
Match score weights: distance 35% · size 25% · config 20% · recency 20%. Top-matched comps best support the ARV.
Projected returns pro-forma
-3.0% appreciation · 6.35% rent growth · sell at horizon
- IRR
- -2.7%
- Equity multiple
- 0.89×
- Total profit
- $-5,972
- Equity at exit
- $29,806
- IRR
- 10.0%
- Equity multiple
- 1.88×
- Total profit
- $49,468
- Equity at exit
- $17,284
Cash invested: $55,972 (down + closing). Projections, not guarantees.
Landlord ↔ Tenant lean methodology
- Overall (STATE)
- 70 Landlord-Friendly
- State Delaware
- 70 Landlord-Friendly · D+7
- County
- — inherits STATE
- City
- — inherits STATE
ZIP-level market 19805
- Rents YoY
- 6.3%
- Active inventory
- 167
- Price-to-rent
- 8.6×
Monthly cashflow live
- Estimated rent
- $1,926 high interval (Pro) →
- Mortgage (P&I)
- −$1,048
- Tax from tax record
- −$79 /mo · $951/yr
- Insurance
- −$83
- HOA
- −$0
- Vacancy / Maint / Mgmt
- −$404
- Net cashflow
- $311
Break-even live
UW: 25.0% down · 7.5% · 30yr · 1.5% tax · 5.0% vac · 8.0% maint · 8.0% mgmt
Financing live
Cash to close
- Down payment
- $49,975
- Closing costs
- $5,997
- Reserves months
- —
- Total cash needed
- —
Loan-product check · same deal, 3 products live
Conventional
25% down · 7.5% · 30yr
- Down + closing
- —
- Monthly P&I
- —
- Monthly cashflow
- —
- DSCR
- —
- Eligible?
- —
Personal DTI + credit; lowest rate.
DSCR
20% down · 8.5% · 30yr
- Down + closing
- —
- Monthly P&I
- —
- Monthly cashflow
- —
- DSCR
- —
- Eligible?
- —
No personal income docs; deal must DSCR.
Hard money
10% down · 12.0% · 12mo
- Down + closing
- —
- Monthly P&I
- —
- Monthly cashflow
- —
- DSCR
- —
- Eligible?
- —
Short-term bridge; refi at stabilization.
Rent comps 40 comps
| Address | Beds | Baths | Sqft | Rent | $/sqft | DOM | Units | Dist |
|---|---|---|---|---|---|---|---|---|
| 1301 Lancaster Ave Wilmington, DE | 4.0 | 2.0 | 1200 | $1,800 | $1.50 | 11d | 1 | 0.07mi |
| 232 N Franklin St Wilmington, DE | 3.0 | 2.0 | 1150 | $1,795 | $1.56 | 43d | 1 | 0.14mi |
| 307 N Rodney St Wilmington, DE | 3.0 | 1.5 | 1425 | $2,000 | $1.40 | 43d | 1 | 0.17mi |
| 115 N Clayton St Unit 115 Wilmington, DE | 3.0 | 1.5 | 1200 | $1,725 | $1.44 | 11d | 1 | 0.17mi |
| 1110 Read St Wilmington, DE | 2.0 | 1.0 | 1100 | $1,250 | $1.14 | 20d | 1 | 0.19mi |
| 1029 Lancaster Ave Wilmington, DE | 4.0 | 1.5 | 1375 | $1,900 | $1.38 | 24d | 1 | 0.23mi |
| 414 S Franklin St Wilmington, DE | 3.0 | 2.0 | 1195 | $1,895 | $1.59 | 43d | 1 | 0.25mi |
| 205 Porter St Wilmington, DE | 2.0 | 1.5 | 1200 | $1,700 | $1.42 | 15d | 1 | 0.27mi |
| 521 N Franklin St Wilmington, DE | 3.0 | 2.0 | 1500 | $1,850 | $1.23 | 3d | 1 | 0.28mi |
| 1110 Maple St Wilmington, DE | 3.0 | 1.0 | 1525 | $1,600 | $1.05 | 43d | 1 | 0.31mi |
| 1525 Beech St Wilmington, DE | 3.0 | 2.5 | 1850 | $2,400 | $1.30 | 5d | 1 | 0.35mi |
| 1802 Maple St Wilmington, DE | 3.0 | 1.5 | 1250 | $2,500 | $2.00 | 24d | 1 | 0.42mi |
| 1815 Maple St Wilmington, DE | 3.0 | 1.5 | 1100 | $1,995 | $1.81 | 18d | 1 | 0.42mi |
| 618 N Scott St Wilmington, DE | 3.0 | 1.5 | 1400 | $1,850 | $1.32 | 43d | 1 | 0.45mi |
| 1000 W 8th St Unit 3 Wilmington, DE | 2.0 | 1.0 | 1050 | $1,695 | $1.61 | 24d | 1 | 0.48mi |
| 1607 Howland St Wilmington, DE | 3.0 | 1.0 | 1075 | $1,900 | $1.77 | 3d | 1 | 0.50mi |
| 21 Stroud St Unit 1 Wilmington, DE | 3.0 | 1.5 | 1875 | $1,900 | $1.01 | 43d | 1 | 0.52mi |
| 25 Stroud St Wilmington, DE | 3.0 | 1.0 | 1200 | $1,795 | $1.50 | 3d | 1 | 0.53mi |
| 1624 W 9th St Wilmington, DE | 3.0 | 2.5 | 1780 | $2,500 | $1.40 | 18d | 1 | 0.54mi |
| 827 N Jackson St Unit 2 Wilmington, DE | 2.0 | 1.0 | 2250 | $1,545 | $0.69 | 12d | 1 | 0.56mi |
| 1319 W 10th St Wilmington, DE | 2.0 | 3.0 | 2200 | $2,500 | $1.14 | 18d | 1 | 0.59mi |
| 507 W 4th St Wilmington, DE | 3.0 | 1.5 | 1075 | $1,800 | $1.67 | 12d | 1 | 0.60mi |
| 7 6th Ave Wilmington, DE | 3.0 | 2.0 | 1325 | $1,800 | $1.36 | 43d | 1 | 0.60mi |
| 1016 Clayton Rd Wilmington, DE | 3.0 | 1.0 | 1150 | $1,850 | $1.61 | 5d | 1 | 0.61mi |
| 331 Justison St Wilmington, DE | 1.0–2.0 | 1.0–2.0 | 859 | $2,205 | $2.57 | 1d | 9 | 0.62mi |
| 530 Harlan Blvd #519 Wilmington, DE | 2.0 | 2.0 | 1192 | $2,250 | $1.89 | 24d | 1 | 0.68mi |
| 1508 Maryland Ave Wilmington, DE | 3.0 | 1.5 | 1450 | $1,975 | $1.36 | 15d | 1 | 0.69mi |
| 1601 E Latimer Pl Wilmington, DE | 4.0 | 1.0 | 1450 | $2,195 | $1.51 | 18d | 1 | 0.69mi |
| 231 5th Ave Wilmington, DE | 2.0 | 1.0 | 1050 | $1,350 | $1.29 | 43d | 1 | 0.70mi |
| 1122 Coyne Pl Wilmington, DE | 3.0 | 1.0 | 1350 | $1,950 | $1.44 | 43d | 1 | 0.71mi |
| 1010 Trenton Pl Wilmington, DE | 3.0 | 1.5 | 1475 | $2,350 | $1.59 | 16d | 1 | 0.72mi |
| 613 W 10th St Wilmington, DE | 2.0 | 1.0 | 1100 | $1,745 | $1.59 | 43d | 1 | 0.76mi |
| 1210 Delaware Ave Unit 3 Wilmington, DE | 2.0 | 1.0 | 1200 | $2,395 | $2.00 | 43d | 1 | 0.82mi |
| 1207 Delaware Ave Wilmington, DE | 2.0 | 1.0 | 1200 | $1,700 | $1.42 | 11d | 1 | 0.85mi |
| 839 N Tatnall St Unit 101 Wilmington, DE | 2.0 | 2.0 | 1211 | $1,750 | $1.45 | 5d | 1 | 0.85mi |
| 1936 Lakeview Rd Wilmington, DE | 3.0 | 1.0 | 1350 | $1,850 | $1.37 | 15d | 1 | 0.86mi |
| 1301 N Harrison St Wilmington, DE | 1.0–2.0 | 1.0 | 1050 | $1,850 | $1.76 | 5d | 1 | 0.87mi |
| 801 N Orange St Wilmington, DE | 3.0 | 1.0–3.0 | 1118 | $3,991 | $3.57 | 2d | 117 | 0.88mi |
| 1504 Delaware Ave Wilmington, DE | 2.0 | 1.0 | 1100 | $1,590 | $1.45 | 16d | 1 | 0.90mi |
| 1504 Delaware Ave Wilmington, DE | 2.0 | 1.0 | 1100 | $1,749 | $1.59 | 22d | 1 | 0.90mi |
Listing history 2 events
-
2026-05-01status Pending
-
2026-04-06$199,900 Active
ⓘ Source: listings_history table (triggers on properties + properties_extension) + one-shot
backfill from property_details.listing_events for pre-trigger history.
Tax reassessment forecast DE · Partial reset (capped growth)
- Current annual tax
- $951 · $79/mo
- Projected year-2 tax
- $1,055 · $88/mo
- Expected delta
- +$104/yr (+$9/mo · 11.0%)
ⓘ Screening estimate from a state-policy table — verify with the county assessor before closing.
Climate risk First Street
- Flood 1/10 Low FEMA zone X (unshaded) · 0% chance over 30 yrs
- Wildfire 1/10 Low
- Heat 8/10 Severe 7 d/yr ≥103°F today · 16 d/yr by 30 yrs out
- Wind 6/10 Major 27% chance of damaging wind over 30 yrs
- Air quality 3/10 Moderate 3 unhealthy d/yr today · 4 by 30 yrs out
Nearby sold comps map
Loading sold comps map…
Walkable amenities ~0.75 mi
Loading nearby amenities…
Taxation est. · year 1
- Rental income
- $23,112
- − Mortgage interest
- −$11,198
- − Property taxes
- −$951
- − Insurance
- −$1,000
- − Repairs & maintenance
- −$1,849
- − Management
- −$1,849
- − Depreciation
- −$5,815
- Taxable income
- $450
- Est. tax owed @ 24.0%
- −$108
- After-tax cash flow
- $3,620/yr
For passive investors: Depreciation is non-cash, so a rental often shows a tax loss while cash-flowing — sheltering income. Rental losses are passive: they offset passive income freely, and up to $25,000/yr can offset ordinary (W-2) income if you actively participate and your MAGI is under $100k (phasing out to $0 by $150k); unused losses carry forward. On sale, claimed depreciation is recaptured at up to 25%, and gains may owe capital-gains tax (a 1031 exchange can defer both). Figures are a year-1 estimate at your 24.0% rate — not tax advice; consult a CPA.
Schools (NCES district)
- District
- Christina School District
- NCES district ID
- 1000200
- Math proficiency
- 22% ▼ -12.00%
- Reading proficiency
- 33% ▼ -5.00%
- Median HH income
- $58,838
- Composite
- 24.93/100
- National rank
- #7567
- State rank
- #18 of 26 in DE
Livability — Wilmington
- Score
- 64/100
- State rank
- #52
- US rank
- #14251
Category grades
Schools grade is shown separately in the Schools card above.
Census & demographics
- Census place
- Wilmington, DE
- County
- New Castle County · 483,412 people
- City population
- 173,480
- Metro
- Philadelphia-Camden-Wilmington, PA-NJ-DE-MD
- Population (ZIP)
- 41,402
- Household income
- $60,221
- Rent vs Own
- Severe rent burden
- 1730.0
Population outlook (New Castle County) Hauer SSP2
- Today (2025)
- 594,686 people
- By 2030
- 609,164 · +2.4%
- By 2040
- 632,154 · +6.3%
- By 2050
- 649,068 · +9.1%
- By 2075
- 687,771 · +15.7%
- By 2100
- 694,961 · +16.9%
Race, ethnicity, and origin ACS 2023
- Neighborhood character
- Diverse neighborhood (Simpson 0.70)
- Race & ethnicity
- White 37% Black 32% Hispanic / Latino 25% Two or more races 10%
- Hispanic origin (detail)
- Mexican 10% Puerto Rican 10% Dominican 2%
- Common ancestry
- Romanian 4% Slovak 1% Italian 1%
- Foreign-born
- 9% · Canada
- Languages at home
- 79% English-only · Spanish 18% French/Haitian/Cajun 1% Arabic 1%
Political lean MEDSL · New Castle
- 2024 margin
- Solid D (+32.6) · D 65.5% · R 32.9% · Other 1.6%
- 2008→2024 swing
- -8.1pp toward R · 2008: 40.6pp · 2024: 32.6pp
- All cycles
- 2024: D+32.6 2020: D+37.1 2016: D+29.6 2012: D+34.1 2008: D+40.6
Not yet ingested
- Civics
- —
Market trends
- HPI YoY
- ▼ -291.16%
- Current HPI
- 259.1455
- Rent YoY
- ▲ 6.35%
- Metro
- Philadelphia-Camden-Wilmington, PA-NJ-DE-MD
- State GDP YoY
- —
- F500 in state
- 0
Price history
2 events — show timeline
- 2026-05-01 Pending — BRIGHT MLS
- 2026-04-06 Listed $199,900 BRIGHT MLS
Property tax history
-9.0%/yrLatest (2024): $951 · +2.6% YoY. Source: county tax records.
Cash-flow waterfall
monthlySold comps — $/sqft
last 12 mo · ≤1 miLoading sold comps…