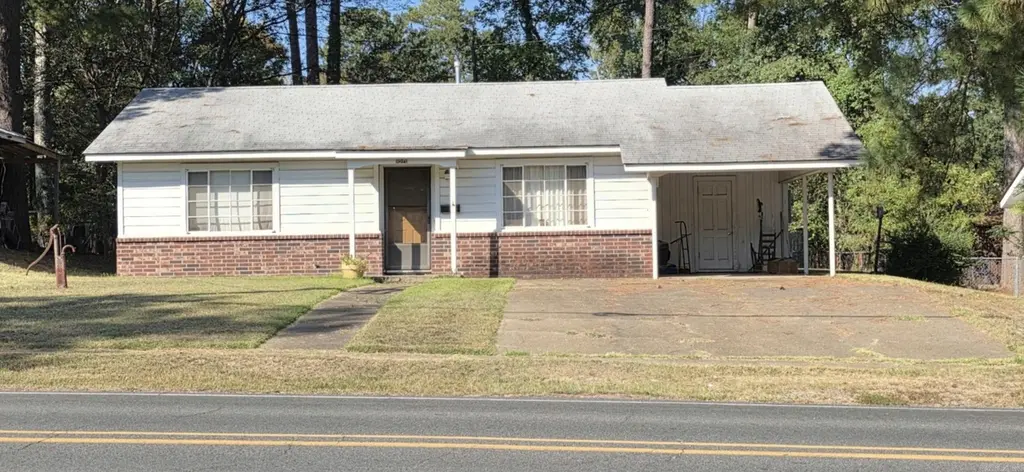
1516 Walnut St · Arkadelphia, AR
Flood risk 1/10 · Minimal
- FEMA flood zone
- X (unshaded)
- Chance of flooding over 30 yrs
- 0.0%
- Est. flood insurance / yr
- $507 – $1,088
Fire risk 4/10 · Minor
- Est. fire insurance / yr
- $1,499 – $2,785
Heat risk 6/10 · Moderate
- Hot days now (above 111°F)
- 7 days/yr
- Hot days in 30 yrs
- 20 days/yr
Wind risk 4/10 · Minor
- Chance of severe wind over 30 yrs
- 16.0%
Air-quality risk 1/10 · Minimal
- Unhealthy air days now
- 0 days/yr
- Unhealthy air days in 30 yrs
- 0 days/yr
Risk factors via First Street. Map © Google.
Why this score? — see what drove the D grade
The composite is a weighted blend of 9 inputs, each scored 0–100. Each bar is that input's sub-score; the figure is the points it added to the 100-point composite (weight × sub-score).
- Cash flow +15.6/30.0
- ARV discount +7.1/15.0
- DSCR +4.8/10.0
- 1% rule +4.3/10.0
- Livability +3.6/5.0
- Rent growth +2.5/5.0
- Condition / age +2.5/5.0
- Schools +2.3/10.0
- Appreciation +0.0/10.0
$127,900
🖨 Deal sheet (PDF) 📄 Offer letter ✓ Due diligence
Listing remarks MLS
Cute and Cozy 3 BR, 2 BA home with bonus room off the back. Spacious level back yard with partial fencing. 1 car, carport. Handy to downtown, schools, and shopping! Call today!
Key facts
- Bonus room
- Detached
- Level back yard
Tags
Neighborhood map
What this means for you Summary
Snapshot
- This is a 3-bed/2.0-bath single-family listed at $128k.
Deal economics
- At list price, monthly cash flow is $54 ($650/yr) — positive.
- The deal already cash-flows at list — no discount required.
- To meet the 1% rule (rent ≥ 1% of price), the offer needs to be $119k (7.2% below list).
- Recommended offer: $113k (12.0% below list) — sets the bar for market timing.
- Cap rate 6.8% vs local median 3.3% in Arkadelphia — top-decile yield for the area; either an underpriced asset or a hidden risk that comps aren't pricing in. Stress-test before assuming the spread holds.
Location & tenants
- Location reads 72/100 on livability (#32 in AR) — a middle-class / working-renter tenant base. Strengths: cost of living A+, health & safety A+, housing A-; Watch: amenities D, commute F, employment F.
- Arkadelphia School District (town): math 28% / reading 28% proficiency, ranked #167 of 238 in AR (top 70%) — low school quality limits family demand, transient renter base, plan for 1-2y turnover.
- Zoned schools: Louisa Perritt Primary (502 students, 65% FRL); Goza Middle School (math 30% / reading 30%, grade F, #139 of 201 statewide, top 71%, 418 students, 57% FRL); Arkadelphia High School (math 14% / reading 28%, grade F, #228 of 292 statewide, top 79%, 586 students, 46% FRL).
- Market conditions: 129 active listings in the ZIP; 12 units permitted in Clark County in 2024 (0 in 5+ unit buildings).
Forward outlook
- Local home prices are declining (-3.0%/yr); year-one equity from $884 of loan paydown is wiped out by about $4k of value loss. Plan a longer hold.
Negotiation context
- It's been on market 251 days — a 12% lower offer ($113k) is reasonable based on typical stale-listing flexibility.
- 2 sale attempts with the ask held roughly flat each time — persistent listings suggest the price (not the market) is what's stuck; bring a comps-based counter.
Risks & watch-outs
- Watch-outs: built in 1955 — expect roof / HVAC / electrical / plumbing capex.
- Climate carrying-cost: extreme-heat days projected 7→20/yr by 2055 (HVAC capex compounding) — expect insurance premiums to compound above CPI over the hold.
Questions for the listing agent
- It's been on market 251 days. Have you received any prior offers? Is the seller open to a 12% concession, seller financing, or rate buy-down credit?
- Built in 1955 — when were the roof, HVAC, electrical panel, plumbing, and water heater last replaced?
- Why hasn't it sold? Are there any deal-killer items the seller is aware of (foundation, flood, title, zoning, code violations)?
- Is there a deadline driving the sale (1031 exchange, divorce, estate, relocation)? That informs how much negotiation room exists.
- Schools are D-rated, which usually means shorter tenancies and higher turnover. Who's the typical renter profile here, and what's been the actual vacancy rate?
- The area grade is low — what's the realistic commute time and amenity access for the typical tenant pool here? Any planned neighborhood developments (good or bad) we should know about?
- What's the average days-on-market for RENTAL listings here right now (not sales)? A rising rental-DOM trend means longer vacancies and softer asking-rent achievability than the comps imply.
- What's the recent tenant-quality profile in this submarket — average credit score on applications, eviction rate, late-payment / NSF rate, and stable-employment percentage? A property-management company in the area should have these aggregated.
- How much new for-sale + rental construction is in the pipeline within 1–3 miles? Heavy new supply typically softens prices + rents 12–24 months out; constrained supply supports both.
Investment metrics
- 1% rule
- 0.93% ✗
- Cap rate
- 6.80%
- Cash-on-cash
- 1.82%
- DSCR
- 1.08
- GRM
- 9.0
CMA / ARV
- ARV (median comp)
- $126,774
- List price
- $127,900
- Delta
- 0.89%
- Verdict
- FAIR
- Comps
- 20 within 1.0 mi
Show comp detail 12 sales within ~0.75 mi
| Address | Dist | Beds/Ba | Sqft | Sold | Price | $/sf | Match |
|---|---|---|---|---|---|---|---|
| 1514 Walnut | 0.01mi | 3/2.0 | 1,276 (-11%) | 2mo | $137,800 | $108 | 79 |
| 702 S 13th St | 0.26mi | 3/2.0 | 1,511 (+6%) | 2mo | $189,900 | $126 | 77 |
| 1526 Pine Manor Dr | 0.19mi | 3/2.0 | 1,543 (+8%) | 10mo | $169,900 | $110 | 70 |
| 920 S 21st St | 0.52mi | 3/2.0 | 1,468 (+3%) | 3mo | $95,000 | $65 | 69 |
| 1808 Sylvia St | 0.45mi | 3/1.5 | 1,448 (+1%) | 10mo | $140,000 | $97 | 66 |
| 1047 S 13th St | 0.30mi | 3/2.0 | 1,321 (-8%) | 10mo | $150,000 | $114 | 65 |
| 916 S 12th St | 0.31mi | 2/2.0 (-1) | 1,327 (-7%) | 11mo | $145,000 | $109 | 60 |
| 1803 Sylvia St | 0.39mi | 3/1.5 | 1,268 (-11%) | 3mo | $38,000 | $30 | 58 |
| 1114 Oconnell St | 0.33mi | 2/2.0 (-1) | 1,304 (-9%) | 10mo | $124,500 | $95 | 57 |
| 1327 Hunter St | 0.59mi | 3/2.0 | 1,524 (+6%) | 7mo | $168,000 | $110 | 56 |
| 1904 Center St | 0.51mi | 3/1.0 | 1,288 (-10%) | 3mo | $160,000 | $124 | 53 |
| 2303 Walnut St | 0.62mi | 3/1.5 | 1,250 (-13%) | 2mo | $140,000 | $112 | 46 |
Match score weights: distance 35% · size 25% · config 20% · recency 20%. Top-matched comps best support the ARV.
Projected returns pro-forma
-3.0% appreciation · 3.0% rent growth · sell at horizon
- IRR
- -13.4%
- Equity multiple
- 0.52×
- Total profit
- $-17,255
- Equity at exit
- $19,070
- IRR
- -4.5%
- Equity multiple
- 0.71×
- Total profit
- $-10,507
- Equity at exit
- $11,058
Cash invested: $35,812 (down + closing). Projections, not guarantees.
Landlord ↔ Tenant lean methodology
- Overall (STATE)
- 92 Strongly Landlord-Friendly
- State Arkansas
- 92 Strongly Landlord-Friendly · R+14
- County
- — inherits STATE
- City
- — inherits STATE
ZIP-level market 71923
- Home prices YoY
- -21.8%
- Active inventory
- 129
- Price-to-rent
- 9.0×
Monthly cashflow live
- Estimated rent
- $1,187 medium interval (Pro) →
- Mortgage (P&I)
- −$671
- Tax est. 1.5%
- −$160 /mo · $1,918/yr
- Insurance
- −$53
- HOA
- −$0
- Vacancy / Maint / Mgmt
- −$249
- Net cashflow
- $54
Break-even live
Sensitivity live
| Price | -10% $143 | -5% $98 | +0% $54 | +5% $10 | +10% $-34 |
|---|---|---|---|---|---|
| Rent | -10% $-40 | -5% $7 | +0% $54 | +5% $101 | +10% $148 |
| Rate | -1.0pp $119 | -0.5pp $87 | base $54 | +0.5pp $21 | +1.0pp $-13 |
UW: 25.0% down · 7.5% · 30yr · 1.5% tax · 5.0% vac · 8.0% maint · 8.0% mgmt
Financing live
Cash to close
- Down payment
- $31,975
- Closing costs
- $3,837
- Reserves months
- —
- Total cash needed
- —
Loan-product check · same deal, 3 products live
Conventional
25% down · 7.5% · 30yr
- Down + closing
- —
- Monthly P&I
- —
- Monthly cashflow
- —
- DSCR
- —
- Eligible?
- —
Personal DTI + credit; lowest rate.
DSCR
20% down · 8.5% · 30yr
- Down + closing
- —
- Monthly P&I
- —
- Monthly cashflow
- —
- DSCR
- —
- Eligible?
- —
No personal income docs; deal must DSCR.
Hard money
10% down · 12.0% · 12mo
- Down + closing
- —
- Monthly P&I
- —
- Monthly cashflow
- —
- DSCR
- —
- Eligible?
- —
Short-term bridge; refi at stabilization.
Listing history 21 events
-
2026-06-22days on market $127,900 Active 251 DOM
-
2026-06-21days on market $127,900 Active 250 DOM
-
2026-06-19days on market $127,900 Active 248 DOM
-
2026-06-18days on market $127,900 Active 247 DOM
-
2026-06-17days on market $127,900 Active 246 DOM
-
2026-06-16days on market $127,900 Active 245 DOM
-
2026-06-15days on market $127,900 Active 244 DOM
-
2026-06-14days on market $127,900 Active 242 DOM
-
2026-06-12days on market $127,900 Active 241 DOM
-
2026-06-09days on market $127,900 Active 238 DOM
-
2026-06-08days on market $127,900 Active 237 DOM
-
2026-06-07days on market $127,900 Active 236 DOM
-
2026-06-07days on market $127,900 Active 235 DOM
-
2026-06-04days on market $127,900 Active 232 DOM
-
2026-06-02days on market $127,900 Active 231 DOM
-
2026-06-01days on market $127,900 Active 230 DOM
-
2026-05-31days on market $127,900 Active 229 DOM
-
2026-05-31days on market $127,900 Active 228 DOM
-
2026-03-23$127,900 Active 176-char remark
Show marketing remark (176 chars)
Cute and Cozy 3 BR, 2 BA home with bonus room off the back. Spacious level back yard with partial fencing. 1 car, carport. Handy to downtown, schools, and shopping! Call today!
-
2026-02-11price $127,900 216-char remark
Show marketing remark (216 chars)
Cute and Cozy 3 BR, 2 BA home with bonus room off the back. Spacious level back yard with partial fencing. Handy to downtown, schools, and shopping! Call today! There will be an upcoming estate sale! Watch for signs!
-
2025-10-13$129,900 New Listing 216-char remark
Show marketing remark (216 chars)
Cute and Cozy 3 BR, 2 BA home with bonus room off the back. Spacious level back yard with partial fencing. Handy to downtown, schools, and shopping! Call today! There will be an upcoming estate sale! Watch for signs!
ⓘ Source: listings_history table (triggers on properties + properties_extension) + one-shot
backfill from property_details.listing_events for pre-trigger history.
Climate risk First Street
- Flood 1/10 Low FEMA zone X (unshaded) · 0% chance over 30 yrs
- Wildfire 4/10 Moderate
- Heat 6/10 Major 7 d/yr ≥111°F today · 20 d/yr by 30 yrs out
- Wind 4/10 Moderate 16% chance of damaging wind over 30 yrs
- Air quality 1/10 Low 0 unhealthy d/yr today · 0 by 30 yrs out
Nearby sold comps map
Loading sold comps map…
Walkable amenities ~0.75 mi
Loading nearby amenities…
Taxation est. · year 1
- Rental income
- $14,250
- − Mortgage interest
- −$7,164
- − Property taxes
- −$1,918
- − Insurance
- −$640
- − Repairs & maintenance
- −$1,140
- − Management
- −$1,140
- − Depreciation
- −$3,721
- Taxable loss
- −$1,474
- Est. tax savings @ 24.0%
- +$354
- After-tax cash flow
- $1,004/yr
For passive investors: Depreciation is non-cash, so a rental often shows a tax loss while cash-flowing — sheltering income. Rental losses are passive: they offset passive income freely, and up to $25,000/yr can offset ordinary (W-2) income if you actively participate and your MAGI is under $100k (phasing out to $0 by $150k); unused losses carry forward. On sale, claimed depreciation is recaptured at up to 25%, and gains may owe capital-gains tax (a 1031 exchange can defer both). Figures are a year-1 estimate at your 24.0% rate — not tax advice; consult a CPA.
Schools (NCES district)
- District
- Arkadelphia School District
- NCES district ID
- 0502430
- Math proficiency
- 28% ▼ -13.00%
- Reading proficiency
- 28% ▼ -12.00%
- Median HH income
- $35,116
- Composite
- 23.13/100
- National rank
- #7954
- State rank
- #167 of 238 in AR
Livability — Arkadelphia
- Score
- 72/100
- State rank
- #32
- US rank
- #6224
Category grades
Schools grade is shown separately in the Schools card above.
Census & demographics
- Census place
- Arkadelphia, AR
- City population
- 1,292
- Population (ZIP)
- 14,374
Population outlook (Clark County) Hauer SSP2
- Today (2025)
- 22,335 people
- By 2030
- 22,306 · -0.1%
- By 2040
- 21,839 · -2.2%
- By 2050
- 21,961 · -1.7%
- By 2075
- 24,186 · +8.3%
- By 2100
- 25,897 · +15.9%
Race, ethnicity, and origin ACS 2023
- Neighborhood character
- Predominantly White (68%)
- Race & ethnicity
- White 68% Black 25% Hispanic / Latino 4% Two or more races 3%
- Common ancestry
- Slovak 2% Lithuanian 1% Iranian 1%
- Foreign-born
- 1% · Canada
- Languages at home
- 97% English-only · Spanish 2% German/W. Germanic 1%
Political lean MEDSL · Clark
- 2024 margin
- Strong R (+20.5) · D 38.6% · R 59.1% · Other 2.2%
- 2008→2024 swing
- -16.7pp toward R · 2008: -3.8pp · 2024: -20.5pp
- All cycles
- 2024: R+20.5 2020: R+14.0 2016: R+9.5 2012: R+6.4 2008: R+3.8
Not yet ingested
- Civics
- —
Market trends
- HPI YoY
- ▼ -58.38%
- Current HPI
- 209.8396
- Rent YoY
- —
- Metro
- —
- State GDP YoY
- ▲ 3.80%
- F500 in state
- 10
Industry mix (Fortune 500 HQ in AR)
| Industry | F500 HQs | Revenue |
|---|---|---|
| Retail | 1 | $681B |
|
||
| Food / Agriculture | 1 | $53B |
|
||
| Retail / Energy | 1 | $22B |
|
||
| Transportation / Logistics | 1 | $12B |
|
||
| Energy | 1 | $4B |
|
||
Price history
-1.5% since first listed3 events — show timeline
- 2026-03-23 Listed $127,900 HSBOR
- 2026-02-11 Price Changed $127,900 CARMLS
- 2025-10-13 Listed $129,900 CARMLS
Property tax history
-19.4%/yrLatest (2023): $15 · -76.5% YoY. Source: county tax records.
Cash-flow waterfall
monthlySold comps — $/sqft
last 12 mo · ≤1 miLoading sold comps…