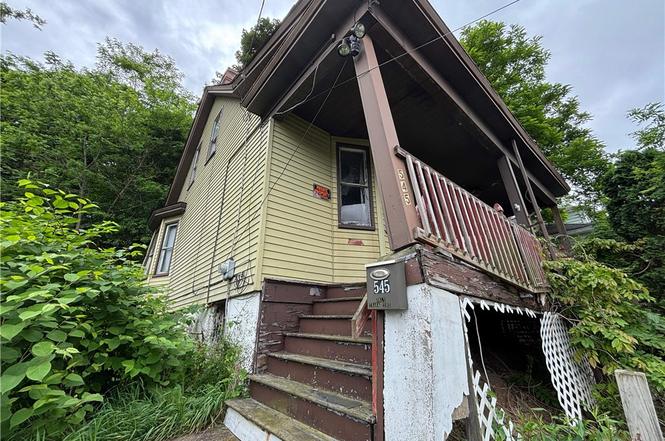
545 Boquet St · Carnegie, PA
Flood risk 1/10 · Minimal
- FEMA flood zone
- X (unshaded)
- Chance of flooding over 30 yrs
- 0.0%
- Est. flood insurance / yr
- $473 – $860
Fire risk 1/10 · Minimal
- Est. fire insurance / yr
- $511 – $949
Heat risk 4/10 · Minor
- Hot days now (above 97°F)
- 7 days/yr
- Hot days in 30 yrs
- 17 days/yr
Wind risk 2/10 · Minimal
- Chance of severe wind over 30 yrs
- —
Air-quality risk 2/10 · Minimal
- Unhealthy air days now
- 0 days/yr
- Unhealthy air days in 30 yrs
- 3 days/yr
Risk factors via First Street. Map © Google.
Why this score? — see what drove the D+ grade
The composite is a weighted blend of 9 inputs, each scored 0–100. Each bar is that input's sub-score; the figure is the points it added to the 100-point composite (weight × sub-score).
- Cash flow +15.0/30.0
- ARV discount +7.5/15.0
- 1% rule +5.0/10.0
- DSCR +5.0/10.0
- Livability +4.3/5.0
- Rent growth +3.9/5.0
- Schools +3.4/10.0
- Condition / age +2.5/5.0
- Appreciation +0.0/10.0
$12,500
🖨 Deal sheet 📄 Offer letter ✓ Due diligence
Listing remarks MLS
WHY Rent when you can own Handy man special Lots of Potential!! 2 bedroom full bath living room dinning room kitchen hardwood floors Great view of Carnegie from front porch .
Key facts
- Covered front porch
- Easy access to i-376
- Original woodwork
Tags
Property features AI
Finance
- Financial info: Assessed value $52,600; Annual tax amount $2,285
Exterior
- Utilities: Public water; Public sewer
- Home design: 2-story building
- Construction: Built on a 0.0672-acre lot
- Exterior features: Property listed as resale
Interior
- Bathrooms: 1 full bathroom
- Interior features: Unfinished basement
Neighborhood map
What this means for you Summary
Snapshot
- This is a 2-bed/1.0-bath single-family listed at $12k.
Deal economics
- At list price, monthly cash flow is $1k ($12k/yr) — positive.
- The deal already cash-flows at list — no discount required.
- Meets the 1% rule at list price ($1k rent vs $12k).
- Cap rate 103.8% vs local median 5.1% in Carnegie — top-decile yield for the area; either an underpriced asset or a hidden risk that comps aren't pricing in. Stress-test before assuming the spread holds.
Location & tenants
- Location reads 86/100 on livability (#55 in PA, #344 nationally) — a professional / high-income tenant draw. Strengths: crime A+, commute A+, cost of living A+; Watch: amenities D.
- Carlynton SD (suburban): math 29% / reading 52% proficiency, ranked #352 of 539 in PA (top 65%) — families likely to look elsewhere, expect single-tenant / working-renter base with shorter leases.
- Market conditions: Rents rising fast (+5.5%/yr); 67 active listings in the ZIP; 15 comparable units currently listed for rent nearby; rentals leasing fast (median 11d on market — plan ~1-2 weeks tenant-placement turnaround); solid renter incomes; 2,996 units permitted in Allegheny County in 2024 (1,588 in 5+ unit buildings).
Forward outlook
- Local home prices are declining (-3.0%/yr); year-one equity from $86 of loan paydown is wiped out by about $375 of value loss. Plan a longer hold.
- At projected returns (-3.0% appreciation + 5.5% rent growth), your $4k cash investment doubles in ~1 year — after that, you're playing with house money.
Negotiation context
- Only 3 days on market — expect competitive offers; lowballing is unlikely to land.
- 2 sale attempts since 12y ago with the ask held roughly flat each time — persistent listings suggest the price (not the market) is what's stuck; bring a comps-based counter.
Risks & watch-outs
- Watch-outs: built in 1890 — expect roof / HVAC / electrical / plumbing capex.
Questions for the listing agent
- Built in 1890 — when were the roof, HVAC, electrical panel, plumbing, and water heater last replaced?
- Is there a deadline driving the sale (1031 exchange, divorce, estate, relocation)? That informs how much negotiation room exists.
- The area grade is low — what's the realistic commute time and amenity access for the typical tenant pool here? Any planned neighborhood developments (good or bad) we should know about?
- What's the average days-on-market for RENTAL listings here right now (not sales)? A rising rental-DOM trend means longer vacancies and softer asking-rent achievability than the comps imply.
- What's the recent tenant-quality profile in this submarket — average credit score on applications, eviction rate, late-payment / NSF rate, and stable-employment percentage? A property-management company in the area should have these aggregated.
- How much new for-sale + rental construction is in the pipeline within 1–3 miles? Heavy new supply typically softens prices + rents 12–24 months out; constrained supply supports both.
Investment metrics
- 1% rule
- 11.16% ✓
- Cap rate
- 103.82%
- Cash-on-cash
- 348.31%
- DSCR
- 16.50
- GRM
- 0.7
CMA / ARV
- ARV (on-the-fly)
- $163,480
- Comps found
- 12
Show comp detail 12 sales within ~0.75 mi
| Address | Dist | Beds/Ba | Sqft | Sold | Price | $/sf | Match |
|---|---|---|---|---|---|---|---|
| 559 Boquet St | 0.04mi | 3/2.0 (+1) | 1,288 (+6%) | 7mo | $185,568 | $144 | 74 |
| 134 Boroview Ave | 0.56mi | 2/1.0 | 1,206 (-1%) | 4mo | $40,000 | $33 | 69 |
| 13 Annabelle St | 0.36mi | 2/1.0 | 1,282 (+5%) | 7mo | $103,300 | $81 | 69 |
| 843 Library Ave | 0.43mi | 3/2.0 (+1) | 1,257 (+3%) | 3mo | $233,000 | $185 | 63 |
| 307 1st Ave | 0.47mi | 3/1.5 (+1) | 1,335 (+9%) | 3mo | $182,500 | $137 | 53 |
| 509 Alter St | 0.70mi | 3/1.5 (+1) | 1,287 (+6%) | 2mo | $105,000 | $82 | 50 |
| 520 6th Ave | 0.71mi | 2/1.0 | 1,084 (-11%) | 4mo | $145,000 | $134 | 45 |
| 505 Noblestown Rd | 0.69mi | 3/1.5 (+1) | 1,296 (+6%) | 6mo | $93,900 | $72 | 45 |
| 239 Marshall Ave | 0.49mi | 3/2.0 (+1) | 1,050 (-14%) | 3mo | $246,000 | $234 | 43 |
| 430 Newkirk St | 0.62mi | 2/2.5 | 1,362 (+12%) | 4mo | $160,000 | $117 | 42 |
| 995 Forsythe Rd | 0.73mi | 3/2.0 (+1) | 1,350 (+11%) | 4mo | $169,000 | $125 | 36 |
| 139 Grienbrier Dr | 0.69mi | 3/2.0 (+1) | 1,388 (+14%) | 5mo | $287,000 | $207 | 32 |
Match score weights: distance 35% · size 25% · config 20% · recency 20%. Top-matched comps best support the ARV.
Projected returns pro-forma
-3.0% appreciation · 5.45% rent growth · sell at horizon
- IRR
- —
- Equity multiple
- 19.92×
- Total profit
- $66,224
- Equity at exit
- $1,864
- IRR
- —
- Equity multiple
- 45.65×
- Total profit
- $156,273
- Equity at exit
- $1,081
Cash invested: $3,500 (down + closing). Projections, not guarantees.
Landlord ↔ Tenant lean methodology
- Overall (STATE)
- 62 Landlord-Friendly
- State Pennsylvania
- 62 Landlord-Friendly · EVEN
- County
- — inherits STATE
- City
- — inherits STATE
ZIP-level market 15106
- Home prices YoY
- -31.9%
- Rents YoY
- 5.5%
- Active inventory
- 67
- Price-to-rent
- 0.7×
Monthly cashflow live
- Estimated rent
- $1,395 high interval (Pro) →
- Mortgage (P&I)
- −$66
- Tax est. 1.5%
- −$16 /mo · $188/yr
- Insurance
- −$5
- HOA
- −$0
- Vacancy / Maint / Mgmt
- −$293
- Net cashflow
- $1,016
Break-even live
UW: 25.0% down · 7.5% · 30yr · 1.5% tax · 5.0% vac · 8.0% maint · 8.0% mgmt
Financing live
Cash to close
- Down payment
- $3,125
- Closing costs
- $375
- Reserves months
- —
- Total cash needed
- —
Loan-product check · same deal, 3 products live
Conventional
25% down · 7.5% · 30yr
- Down + closing
- —
- Monthly P&I
- —
- Monthly cashflow
- —
- DSCR
- —
- Eligible?
- —
Personal DTI + credit; lowest rate.
DSCR
20% down · 8.5% · 30yr
- Down + closing
- —
- Monthly P&I
- —
- Monthly cashflow
- —
- DSCR
- —
- Eligible?
- —
No personal income docs; deal must DSCR.
Hard money
10% down · 12.0% · 12mo
- Down + closing
- —
- Monthly P&I
- —
- Monthly cashflow
- —
- DSCR
- —
- Eligible?
- —
Short-term bridge; refi at stabilization.
Rent comps 15 comps
| Address | Beds | Baths | Sqft | Rent | $/sqft | DOM | Units | Dist |
|---|---|---|---|---|---|---|---|---|
| 834 Washington Ave Carnegie, PA | 1.0–2.0 | 1.0–2.0 | 1026 | $1,638 | $1.60 | 2d | 11 | 0.39mi |
| 851 Kennedy St Carnegie, PA | 3.0 | 1.0 | 1100 | $1,800 | $1.64 | 23d | 1 | 0.48mi |
| 312 Midland Ave Carnegie, PA | 3.0 | 1.0 | 1332 | $1,400 | $1.05 | 43d | 1 | 0.59mi |
| 303 Lexington Ct Carnegie, PA | 2.0 | 1.0 | 1144 | $1,200 | $1.05 | 10d | 1 | 0.59mi |
| 457 Carothers Ave Unit 6 Carnegie, PA | 1.0 | 1.0 | 700 | $850 | $1.21 | 7d | 1 | 0.60mi |
| 230 Magazine St Unit 2 Carnegie, PA | 2.0 | 1.0 | 1200 | $1,295 | $1.08 | 43d | 1 | 0.70mi |
| 622 Logan St Unit 2 Carnegie, PA | 2.0 | 1.0 | 700 | $1,055 | $1.51 | 23d | 1 | 0.75mi |
| 1640 Ellsworth Ave Unit 2 Heidelberg, PA | 2.0 | 1.0 | 750 | $1,125 | $1.50 | 17d | 1 | 1.10mi |
| 135 Greenbriar Dr Pittsburgh, PA | 3.0 | 1.0 | 950 | $1,550 | $1.63 | 4d | 1 | 1.14mi |
| 523 Grant Ave Fl 2 Carnegie, PA | 1.0 | 1.0 | 1000 | $1,100 | $1.10 | 43d | 1 | 1.17mi |
| 700 Mansfield Ave Pittsburgh, PA | 2.0 | 1.0–2.0 | 633 | $1,465 | $2.31 | 7d | 2 | 1.18mi |
| 300 Chatham Park Dr Pittsburgh, PA | 3.0 | 1.0–2.5 | 890 | $1,705 | $1.92 | 2d | 49 | 1.34mi |
| 301 Chatham Park Dr Pittsburgh, PA | 1.0–2.0 | 1.0–1.5 | 772 | $1,789 | $2.32 | 1d | 15 | 1.34mi |
| 6 Woodlawn St Apt 2 Crafton, PA | 1.0 | 1.0 | 725 | $895 | $1.23 | 43d | 1 | 1.46mi |
| 1900 Tee Ct Presto, PA | 1.0–3.0 | 1.0–2.0 | 981 | $1,756 | $1.79 | 1d | 9 | 1.49mi |
Listing history 4 events
-
2026-06-18days on market $12,500 Active 3 DOM
-
2026-06-17days on market $12,500 Active 2 DOM
-
2026-06-15remarks 643-char remark
-
2026-06-15$12,500 Active 1 DOM
ⓘ Source: listings_history table (triggers on properties + properties_extension) + one-shot
backfill from property_details.listing_events for pre-trigger history.
Climate risk First Street
- Flood 1/10 Low FEMA zone X (unshaded) · 0% chance over 30 yrs
- Wildfire 1/10 Low
- Heat 4/10 Moderate 7 d/yr ≥97°F today · 17 d/yr by 30 yrs out
- Wind 2/10 Low
- Air quality 2/10 Low 0 unhealthy d/yr today · 3 by 30 yrs out
Nearby sold comps map
Loading sold comps map…
Walkable amenities ~0.75 mi
Loading nearby amenities…
Taxation est. · year 1
- Rental income
- $16,744
- − Mortgage interest
- −$700
- − Property taxes
- −$188
- − Insurance
- −$62
- − Repairs & maintenance
- −$1,340
- − Management
- −$1,340
- − Depreciation
- −$364
- Taxable income
- $12,751
- Est. tax owed @ 24.0%
- −$3,060
- After-tax cash flow
- $9,131/yr
For passive investors: Depreciation is non-cash, so a rental often shows a tax loss while cash-flowing — sheltering income. Rental losses are passive: they offset passive income freely, and up to $25,000/yr can offset ordinary (W-2) income if you actively participate and your MAGI is under $100k (phasing out to $0 by $150k); unused losses carry forward. On sale, claimed depreciation is recaptured at up to 25%, and gains may owe capital-gains tax (a 1031 exchange can defer both). Figures are a year-1 estimate at your 24.0% rate — not tax advice; consult a CPA.
Schools (NCES district)
- District
- Carlynton SD
- NCES district ID
- 4205040
- Math proficiency
- 29% ▼ -15.00%
- Reading proficiency
- 52% ▼ -11.00%
- Median HH income
- $46,249
- Composite
- 34.46/100
- National rank
- #5192
- State rank
- #352 of 539 in PA
Livability — Carnegie
- Score
- 86/100
- State rank
- #55
- US rank
- #344
Category grades
Schools grade is shown separately in the Schools card above.
Census & demographics
- Census place
- Carnegie, PA
- County
- Allegheny County · 1,022,028 people
- City population
- 19,244
- Metro
- Pittsburgh, PA
- Population (ZIP)
- 19,244
- Household income
- $77,247
- Rent vs Own
- Severe rent burden
- 410.0
Population outlook (Allegheny County) Hauer SSP2
- Today (2025)
- 1,250,282 people
- By 2030
- 1,256,482 · +0.5%
- By 2040
- 1,256,318 · +0.5%
- By 2050
- 1,244,169 · -0.5%
- By 2075
- 1,197,693 · -4.2%
- By 2100
- 1,093,187 · -12.6%
Race, ethnicity, and origin ACS 2023
- Neighborhood character
- Predominantly White (82%)
- Race & ethnicity
- White 82% Black 8% Two or more races 6% Asian 2% Hispanic / Latino 2%
- Common ancestry
- Romanian 11% Lithuanian 2% Subsaharan African 2%
- Foreign-born
- 5%
- Languages at home
- 94% English-only · Other Indo-European 2% Arabic 1% Russian/Polish/Slavic 1%
Political lean MEDSL · Allegheny
- 2024 margin
- Strong D (+20.3) · D 59.7% · R 39.4%
- 2008→2024 swing
- +4.8pp toward D · 2008: 15.5pp · 2024: 20.3pp
- All cycles
- 2024: D+20.3 2020: D+20.4 2016: D+16.4 2012: D+14.4 2008: D+15.5
Not yet ingested
- Civics
- —
Market trends
- HPI YoY
- ▼ -119.52%
- Current HPI
- 255.0295
- Rent YoY
- ▲ 5.45%
- Metro
- Pittsburgh, PA
- State GDP YoY
- ▲ 1.68%
- F500 in state
- 34
Industry mix (Fortune 500 HQ in PA)
| Industry | F500 HQs | Revenue |
|---|---|---|
| Healthcare | 2 | $309B |
|
||
| Insurance | 2 | $27B |
|
||
| Telecommunications / Media | 1 | $124B |
|
||
| Industrial Distribution | 1 | $22B |
|
||
| Financial Services | 1 | $20B |
|
||
| Chemicals / Materials | 1 | $18B |
|
||
Price history
-16.7% since first listed6 events — show timeline
- 2026-06-15 Listed $12,500 West Penn MLS
- 2015-02-09 Sold (Public Records) $19,000 Public Records
- 2015-02-06 Sold (MLS) $19,000 West Penn MLS
- 2014-08-19 Listed $19,000 West Penn MLS
- 2010-10-13 Sold (Public Records) $11,000 Public Records
- 1992-05-28 Sold (Public Records) $15,000 Public Records
Property tax history
+3.1%/yrLatest (2026): $2,285 · +1.2% YoY. Source: county tax records.
Cash-flow waterfall
monthlySold comps — $/sqft
last 12 mo · ≤1 miLoading sold comps…