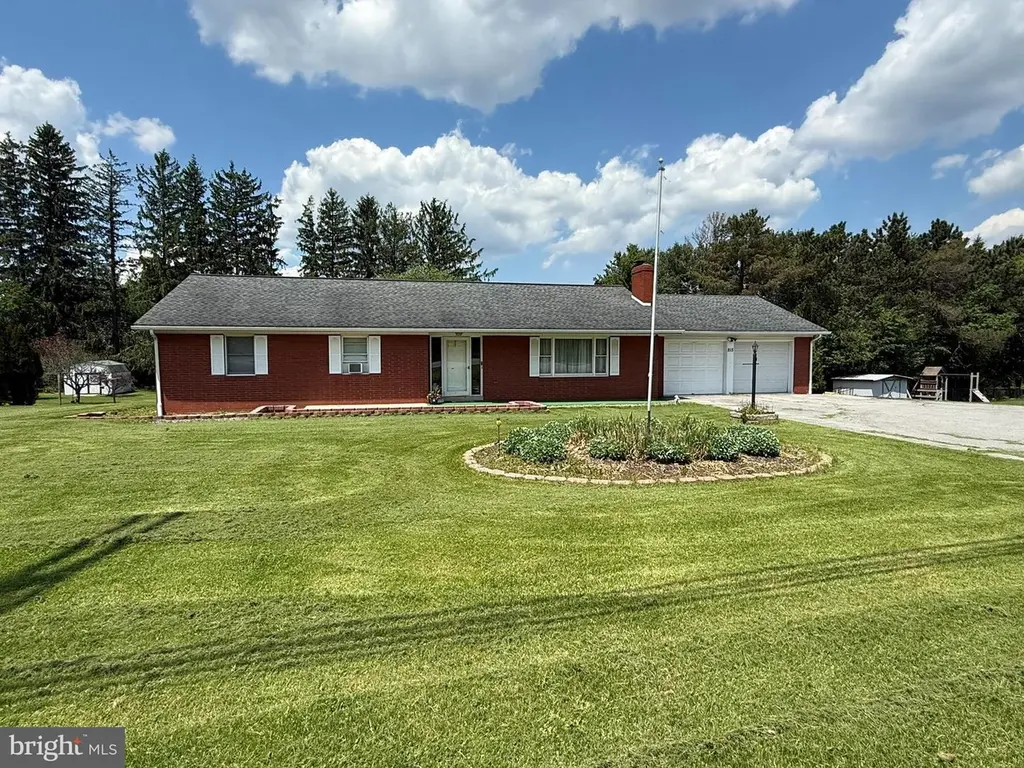
815 Tyrone Pike · Philipsburg, PA
Flood risk 1/10 · Minimal
- FEMA flood zone
- X (unshaded)
- Chance of flooding over 30 yrs
- 0.0%
- Est. flood insurance / yr
- $473 – $860
Fire risk 4/10 · Minor
- Est. fire insurance / yr
- $511 – $949
Heat risk 2/10 · Minimal
- Hot days now (above 89°F)
- 7 days/yr
- Hot days in 30 yrs
- 17 days/yr
Wind risk 2/10 · Minimal
- Chance of severe wind over 30 yrs
- —
Air-quality risk 2/10 · Minimal
- Unhealthy air days now
- 1 days/yr
- Unhealthy air days in 30 yrs
- 2 days/yr
Risk factors via First Street. Map © Google.
Why this score? — see what drove the D grade
The composite is a weighted blend of 9 inputs, each scored 0–100. Each bar is that input's sub-score; the figure is the points it added to the 100-point composite (weight × sub-score).
- Appreciation +10.0/10.0
- Cash flow +8.1/30.0
- ARV discount +7.5/15.0
- Schools +3.9/10.0
- Livability +3.5/5.0
- Rent growth +2.5/5.0
- Condition / age +2.5/5.0
- 1% rule +2.2/10.0
- DSCR +2.1/10.0
$220,000
🖨 Deal sheet (PDF) 📄 Offer letter ✓ Due diligence
Listing remarks MLS
For comparable purposes only. This was for sale by owner.
Key facts
- Private half bath
- Dual closets
- Finished basement
Tags
Property features AI
Exterior
- Parking: Attached front-entry garage with inside access; Two garage parking spaces; Paved driveway
- Utilities: Public water; On-site septic; Electric hot water; Electric heating
- Home design: Detached structure; Shingle roof; Not in a federal flood zone
- Construction: Brick construction; Block foundation; Building not winterized
- Exterior features: Outbuilding(s); Sidewalks; Shed; Garage(s)
Interior
- Kitchen: Pantry; Coal stove
- Bedrooms: Three bedrooms on the main level; Additional bedroom (lower level)
- Bathrooms: Two full bathrooms; One half bathroom; One full bathroom on a lower level
- Heating & cooling: Baseboard electric heating; Window cooling units
- Interior features: Breakfast area; Cedar closet(s); Dining area; Floor plan is traditional; Formal separate dining room; Pantry; Stove - coal; Entry-level bedroom; Has fireplace (wood-burning)
- Laundry & utility: Laundry in the basement
Neighborhood map
What this means for you Summary
Snapshot
- This is a 3-bed/1.5-bath other listed at $220k.
Deal economics
- At list price, monthly cash flow is $-217 ($-3k/yr) — negative.
- To cash-flow at today's rent, offer at most $182k (17.4% below list).
- To meet the 1% rule (rent ≥ 1% of price), the offer needs to be $158k (28.1% below list).
- Recommended offer: $158k (28.1% below list) — sets the bar for 1% rule.
Location & tenants
- Location reads 69/100 on livability (#851 in PA) — a middle-class / working-renter tenant base. Strengths: crime A+, cost of living A+, housing A+; Watch: amenities F, commute F, employment D-.
- Philipsburg-Osceola Area SD (town): math 42% / reading 52% proficiency, ranked #258 of 539 in PA (top 48%) — families likely to look elsewhere, expect single-tenant / working-renter base with shorter leases.
- Zoned schools: Osceola Mills El Sch (math 52% / reading 57%, grade C, #504 of 1,518 statewide, top 37%, 295 students, 59% FRL); Philipsburg-Osceola Area Ms (math 27% / reading 43%, grade F, #322 of 512 statewide, top 64%, 379 students, 57% FRL); Philipsburg-Osceola Area Hs (math 67%, 520 students, 38% FRL).
- Market conditions: 40 active listings in the ZIP; 399 units permitted in Centre County in 2024 (44 in 5+ unit buildings).
Forward outlook
- In year one you build about $24k of equity ($2k loan paydown + $22k appreciation (10.0% local appreciation)).
- Centre County population projected at +16% by 2050 — long-run rental-demand tailwind backs the buy-and-hold thesis.
- By year 2, paydown + projected appreciation supports a ~$38k cash-out refi (75% LTV) — recoverable capital for the next deal without selling this one.
Negotiation context
- It's been on market 15 days — a 2% lower offer ($217k) is reasonable based on typical stale-listing flexibility.
- 2 sale attempts since 9y ago with the ask held roughly flat each time — persistent listings suggest the price (not the market) is what's stuck; bring a comps-based counter.
- Current owner paid $155k; 42% above their basis — modest negotiation headroom, anchor on the comps not their cost.
Questions for the listing agent
- What do current leases actually rent for vs. the listed asking? Can we see a recent rent roll and the last 12 months of T-12 income?
- Built in 1970 — when were the roof, HVAC, electrical panel, plumbing, and water heater last replaced?
- Is there a deadline driving the sale (1031 exchange, divorce, estate, relocation)? That informs how much negotiation room exists.
- Schools are B-rated — typically a magnet for longer-tenancy family renters. What's the average tenant stay here, and is there a school-zone premium baked into asking?
- The area grade is low — what's the realistic commute time and amenity access for the typical tenant pool here? Any planned neighborhood developments (good or bad) we should know about?
- What's the average days-on-market for RENTAL listings here right now (not sales)? A rising rental-DOM trend means longer vacancies and softer asking-rent achievability than the comps imply.
- What's the recent tenant-quality profile in this submarket — average credit score on applications, eviction rate, late-payment / NSF rate, and stable-employment percentage? A property-management company in the area should have these aggregated.
- How much new for-sale + rental construction is in the pipeline within 1–3 miles? Heavy new supply typically softens prices + rents 12–24 months out; constrained supply supports both.
Investment metrics
- 1% rule
- 0.72% ✗
- Cap rate
- 5.11%
- Cash-on-cash
- -4.22%
- DSCR
- 0.81
- GRM
- 11.6
CMA / ARV
No comps found within radius.
Projected returns pro-forma
10.0% appreciation · 3.0% rent growth · sell at horizon
- IRR
- 21.3%
- Equity multiple
- 2.72×
- Total profit
- $106,011
- Equity at exit
- $198,193
- IRR
- 19.2%
- Equity multiple
- 6.24×
- Total profit
- $323,017
- Equity at exit
- $427,412
Cash invested: $61,600 (down + closing). Projections, not guarantees.
Landlord ↔ Tenant lean methodology
- Overall (STATE)
- 62 Landlord-Friendly
- State Pennsylvania
- 62 Landlord-Friendly · EVEN
- County
- — inherits STATE
- City
- — inherits STATE
ZIP-level market 16866
- Home prices YoY
- 12.0%
- Active inventory
- 40
- Price-to-rent
- 11.6×
Monthly cashflow live
- Estimated rent
- $1,582 medium interval (Pro) →
- Mortgage (P&I)
- −$1,154
- Tax from tax record
- −$221 /mo · $2,657/yr
- Insurance
- −$92
- HOA
- −$0
- Vacancy / Maint / Mgmt
- −$332
- Net cashflow
- $-217
Break-even live
Sensitivity live
| Price | -10% $-92 | -5% $-154 | +0% $-217 | +5% $-279 | +10% $-341 |
|---|---|---|---|---|---|
| Rent | -10% $-342 | -5% $-279 | +0% $-217 | +5% $-154 | +10% $-92 |
| Rate | -1.0pp $-106 | -0.5pp $-161 | base $-217 | +0.5pp $-274 | +1.0pp $-332 |
UW: 25.0% down · 7.5% · 30yr · 1.5% tax · 5.0% vac · 8.0% maint · 8.0% mgmt
Financing live
Cash to close
- Down payment
- $55,000
- Closing costs
- $6,600
- Reserves months
- —
- Total cash needed
- —
Loan-product check · same deal, 3 products live
Conventional
25% down · 7.5% · 30yr
- Down + closing
- —
- Monthly P&I
- —
- Monthly cashflow
- —
- DSCR
- —
- Eligible?
- —
Personal DTI + credit; lowest rate.
DSCR
20% down · 8.5% · 30yr
- Down + closing
- —
- Monthly P&I
- —
- Monthly cashflow
- —
- DSCR
- —
- Eligible?
- —
No personal income docs; deal must DSCR.
Hard money
10% down · 12.0% · 12mo
- Down + closing
- —
- Monthly P&I
- —
- Monthly cashflow
- —
- DSCR
- —
- Eligible?
- —
Short-term bridge; refi at stabilization.
Listing history 9 events
-
2026-06-04statusdays on market $220,000 Pending 15 DOM
-
2026-06-02days on market $220,000 Active 14 DOM
-
2026-06-01days on market $220,000 Active 13 DOM
-
2026-05-31days on market $220,000 Active 12 DOM
-
2026-05-19$220,000 Active
-
2017-04-18soldstatus $155,400
-
2017-04-14soldstatus $155,400 57-char remark
Show marketing remark (57 chars)
For comparable purposes only. This was for sale by owner.
-
2017-01-01$169,000 57-char remark
Show marketing remark (57 chars)
For comparable purposes only. This was for sale by owner.
-
2015-07-02soldstatus $90,000
ⓘ Source: listings_history table (triggers on properties + properties_extension) + one-shot
backfill from property_details.listing_events for pre-trigger history.
Tax reassessment forecast PA · Partial reset (capped growth)
- Current annual tax
- $2,657 · $221/mo
- Projected year-2 tax
- $3,067 · $256/mo
- Expected delta
- +$409/yr (+$34/mo · 15.4%)
ⓘ Screening estimate from a state-policy table — verify with the county assessor before closing.
Climate risk First Street
- Flood 1/10 Low FEMA zone X (unshaded) · 0% chance over 30 yrs
- Wildfire 4/10 Moderate
- Heat 2/10 Low 7 d/yr ≥89°F today · 17 d/yr by 30 yrs out
- Wind 2/10 Low
- Air quality 2/10 Low 1 unhealthy d/yr today · 2 by 30 yrs out
Nearby sold comps map
Loading sold comps map…
Walkable amenities ~0.75 mi
Loading nearby amenities…
Taxation est. · year 1
- Rental income
- $18,990
- − Mortgage interest
- −$12,323
- − Property taxes
- −$2,657
- − Insurance
- −$1,100
- − Repairs & maintenance
- −$1,519
- − Management
- −$1,519
- − Depreciation
- −$6,400
- Taxable loss
- −$6,529
- Est. tax savings @ 24.0%
- +$1,567
- After-tax cash flow
- $-1,033/yr
For passive investors: Depreciation is non-cash, so a rental often shows a tax loss while cash-flowing — sheltering income. Rental losses are passive: they offset passive income freely, and up to $25,000/yr can offset ordinary (W-2) income if you actively participate and your MAGI is under $100k (phasing out to $0 by $150k); unused losses carry forward. On sale, claimed depreciation is recaptured at up to 25%, and gains may owe capital-gains tax (a 1031 exchange can defer both). Figures are a year-1 estimate at your 24.0% rate — not tax advice; consult a CPA.
Schools (NCES district)
- District
- Philipsburg-Osceola Area SD
- NCES district ID
- 4219020
- Math proficiency
- 42% ▼ -9.00%
- Reading proficiency
- 52% ▼ -10.00%
- Median HH income
- $40,645
- Composite
- 39.37/100
- National rank
- #3977
- State rank
- #258 of 539 in PA
Livability — Philipsburg
- Score
- 69/100
- State rank
- #851
- US rank
- #8920
Category grades
Schools grade is shown separately in the Schools card above.
Census & demographics
- Population (ZIP)
- 8,924
Population outlook (Centre County) Hauer SSP2
- Today (2025)
- 177,113 people
- By 2030
- 185,138 · +4.5%
- By 2040
- 196,009 · +10.7%
- By 2050
- 205,070 · +15.8%
- By 2075
- 217,575 · +22.8%
- By 2100
- 230,649 · +30.2%
Race, ethnicity, and origin ACS 2023
- Neighborhood character
- Predominantly White (86%)
- Race & ethnicity
- White 86% Hispanic / Latino 6% Black 6% Two or more races 3%
- Hispanic origin (detail)
- Mexican 2% Dominican 1%
- Common ancestry
- Romanian 7% Slovak 2% Polish 1%
- Foreign-born
- 7% · Canada, Jamaica
- Languages at home
- 92% English-only · Spanish 6%
Political lean MEDSL · Centre
- 2024 margin
- Toss-up / Even · D 50.9% · R 48.1% · Other 1.0%
- 2008→2024 swing
- -9.0pp toward R · 2008: 11.8pp · 2024: 2.8pp
- All cycles
- 2024: D+2.8 2020: D+4.8 2016: D+1.9 2012: R+0.0 2008: D+11.8
Not yet ingested
- Civics
- —
Market trends
- HPI YoY
- ▲ 30.47%
- Current HPI
- 284.148
- Rent YoY
- —
- Metro
- —
- State GDP YoY
- ▲ 1.68%
- F500 in state
- 34
Industry mix (Fortune 500 HQ in PA)
| Industry | F500 HQs | Revenue |
|---|---|---|
| Healthcare | 2 | $309B |
|
||
| Insurance | 2 | $27B |
|
||
| Telecommunications / Media | 1 | $124B |
|
||
| Industrial Distribution | 1 | $22B |
|
||
| Financial Services | 1 | $20B |
|
||
| Chemicals / Materials | 1 | $18B |
|
||
Price history
+144.4% since first listed5 events — show timeline
- 2026-05-19 Listed $220,000 BRIGHT MLS
- 2017-04-18 Sold (Public Records) $155,400 Public Records
- 2017-04-14 Sold (MLS) $155,400 BRIGHT MLS
- 2017-01-01 Listed $169,000 BRIGHT MLS
- 2015-07-02 Sold (Public Records) $90,000 Public Records
Property tax history
+1.5%/yrLatest (2026): $2,657 · +3.7% YoY. Source: county tax records.
Cash-flow waterfall
monthlySold comps — $/sqft
last 12 mo · ≤1 miLoading sold comps…