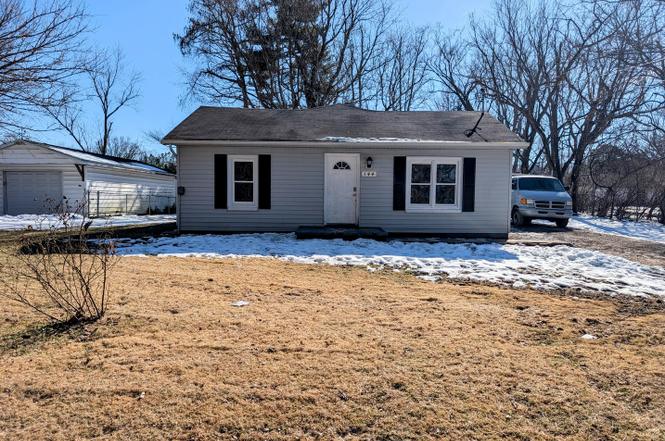
144 Water Tower Rd · Carbondale, IL
Flood risk 1/10 · Minimal
- FEMA flood zone
- X (unshaded)
- Chance of flooding over 30 yrs
- 0.0%
- Est. flood insurance / yr
- $507 – $1,088
Fire risk 1/10 · Minimal
- Est. fire insurance / yr
- $804 – $1,492
Heat risk 4/10 · Minor
- Hot days now (above 107°F)
- 7 days/yr
- Hot days in 30 yrs
- 21 days/yr
Wind risk 2/10 · Minimal
- Chance of severe wind over 30 yrs
- 2.0%
Air-quality risk 2/10 · Minimal
- Unhealthy air days now
- 0 days/yr
- Unhealthy air days in 30 yrs
- 1 days/yr
Risk factors via First Street. Map © Google.
Why this score? — see what drove the D+ grade
The composite is a weighted blend of 9 inputs, each scored 0–100. Each bar is that input's sub-score; the figure is the points it added to the 100-point composite (weight × sub-score).
- Cash flow +14.3/30.0
- ARV discount +7.5/15.0
- Appreciation +7.1/10.0
- 1% rule +4.8/10.0
- DSCR +4.4/10.0
- Livability +3.5/5.0
- Rent growth +2.5/5.0
- Condition / age +2.5/5.0
- Schools +2.4/10.0
$99,000
🖨 Deal sheet (PDF) 📄 Offer letter ✓ Due diligence
Listing remarks
This charming 3-bed, 1-bath home in Makanda is ready to become your own! Nestled on Water Tower Drive, it features a nice front yard and partially fenced backyard. The full bath sits tucked in the hallway off the living room, easily accessible from all bedrooms. The kitchen leads to a laundry room that could also function as a mudroom.
Key facts
- Laundry room
- Front yard
- Mudroom
Tags
Property features AI
Finance
- HOA & community: No master association fee required
Exterior
- Parking: 2 total parking spaces
- Utilities: Septic tank; Cable available
- Home design: Detached single-family home; One-story; Fee simple ownership; Built approximately 61–70 years ago; Property faces unspecified direction
- Construction: Vinyl siding and frame construction with block elements; Block foundation; Built before 1978
- Exterior features: Deck
Interior
- Kitchen: Range; Refrigerator
- Bedrooms: Master bedroom on the main level (13 x 12); Bedroom on the main level (11 x 12); Bedroom on the main level (11 x 7)
- Flooring: Laminate flooring in kitchen; Laminate flooring in living room
- Bathrooms: 1 full bathroom
- Heating & cooling: Natural gas forced air heating; Central air conditioning
- Interior features: 5 total rooms
- Laundry & utility: Washer; Main level laundry (10 x 5)
Neighborhood map
What this means for you Summary
Snapshot
- This is a 1-bed/1.0-bath single-family listed at $99k.
Deal economics
- At list price, monthly cash flow is $18 ($220/yr) — positive.
- The deal already cash-flows at list — no discount required.
- To meet the 1% rule (rent ≥ 1% of price), the offer needs to be $97k (2.1% below list).
- Recommended offer: $87k (12.0% below list) — sets the bar for market timing.
- Cap rate 6.5% vs local median 4.8% in Carbondale — top-decile yield for the area; either an underpriced asset or a hidden risk that comps aren't pricing in. Stress-test before assuming the spread holds.
Location & tenants
- Location reads 70/100 on livability (#375 in IL) — a middle-class / working-renter tenant base. Strengths: amenities A+, commute A+, cost of living A+; Watch: housing C-, crime F, employment F.
- Carbondale Chsd 165 (urban): math 26% / reading 35% proficiency, ranked #279 of 620 in IL (top 45%) — families likely to look elsewhere, expect single-tenant / working-renter base with shorter leases.
- Zoned schools: Unity Point Elem School (math 16% / reading 38%, grade F, #749 of 2,056 statewide, top 40%, 637 students, 0% FRL); Carbondale Comm H S (math 26% / reading 35%, grade F, #175 of 693 statewide, top 26%, 997 students, 0% FRL).
- Market conditions: 33 active listings in the ZIP; 5 units permitted in Jackson County in 2024 (0 in 5+ unit buildings).
Forward outlook
- In year one you build about $5k of equity ($684 loan paydown + $4k appreciation (4.3% local appreciation)).
- At projected returns (4.3% appreciation + 3.0% rent growth), your $28k cash investment doubles in ~5 years — after that, you're playing with house money.
- By year 7, paydown + projected appreciation supports a ~$31k cash-out refi (75% LTV) — recoverable capital for the next deal without selling this one.
Negotiation context
- It's been on market 121 days — a 12% lower offer ($87k) is reasonable based on typical stale-listing flexibility.
- 2 sale attempts since 24y ago; this cycle's ask has dropped $16k (14%) from the opening price — seller is motivated, your offer sets the floor, not the list.
- Current owner paid $55k; list at $99k implies a 80% gain — meaningful room to come down on a strong offer.
Risks & watch-outs
- Watch-outs: built in 1958 — expect roof / HVAC / electrical / plumbing capex.
Questions for the listing agent
- It's been on market 121 days. Have you received any prior offers? Is the seller open to a 12% concession, seller financing, or rate buy-down credit?
- Built in 1958 — when were the roof, HVAC, electrical panel, plumbing, and water heater last replaced?
- Why hasn't it sold? Are there any deal-killer items the seller is aware of (foundation, flood, title, zoning, code violations)?
- Is there a deadline driving the sale (1031 exchange, divorce, estate, relocation)? That informs how much negotiation room exists.
- Schools are D-rated, which usually means shorter tenancies and higher turnover. Who's the typical renter profile here, and what's been the actual vacancy rate?
- Crime grade is F in this area — have there been break-ins, vandalism, or insurance claims at this property in the last 3 years? What carrier currently insures it and at what premium?
- The area grade is low — what's the realistic commute time and amenity access for the typical tenant pool here? Any planned neighborhood developments (good or bad) we should know about?
- What's the average days-on-market for RENTAL listings here right now (not sales)? A rising rental-DOM trend means longer vacancies and softer asking-rent achievability than the comps imply.
- What's the recent tenant-quality profile in this submarket — average credit score on applications, eviction rate, late-payment / NSF rate, and stable-employment percentage? A property-management company in the area should have these aggregated.
- How much new for-sale + rental construction is in the pipeline within 1–3 miles? Heavy new supply typically softens prices + rents 12–24 months out; constrained supply supports both.
Investment metrics
- 1% rule
- 0.98% ✗
- Cap rate
- 6.51%
- Cash-on-cash
- 0.79%
- DSCR
- 1.04
- GRM
- 8.5
CMA / ARV
No comps found within radius.
Projected returns pro-forma
4.27% appreciation · 3.0% rent growth · sell at horizon
- IRR
- 11.7%
- Equity multiple
- 1.72×
- Total profit
- $19,964
- Equity at exit
- $51,770
- IRR
- 13.2%
- Equity multiple
- 3.22×
- Total profit
- $61,562
- Equity at exit
- $85,955
Cash invested: $27,720 (down + closing). Projections, not guarantees.
Landlord ↔ Tenant lean methodology
- Overall (STATE)
- 43 Moderately Tenant-Leaning
- State Illinois
- 43 Moderately Tenant-Leaning · D+7
- County
- — inherits STATE
- City
- — inherits STATE
ZIP-level market 62958
- Home prices YoY
- 3.4%
- Active inventory
- 33
- Price-to-rent
- 8.5×
Monthly cashflow live
- Estimated rent
- $969 medium interval (Pro) →
- Mortgage (P&I)
- −$519
- Tax from tax record
- −$187 /mo · $2,246/yr
- Insurance
- −$41
- HOA
- −$0
- Vacancy / Maint / Mgmt
- −$204
- Net cashflow
- $18
Break-even live
Sensitivity live
| Price | -10% $74 | -5% $46 | +0% $18 | +5% $-10 | +10% $-38 |
|---|---|---|---|---|---|
| Rent | -10% $-58 | -5% $-20 | +0% $18 | +5% $57 | +10% $95 |
| Rate | -1.0pp $68 | -0.5pp $43 | base $18 | +0.5pp $-7 | +1.0pp $-33 |
UW: 25.0% down · 7.5% · 30yr · 1.5% tax · 5.0% vac · 8.0% maint · 8.0% mgmt
Financing live
Cash to close
- Down payment
- $24,750
- Closing costs
- $2,970
- Reserves months
- —
- Total cash needed
- —
Loan-product check · same deal, 3 products live
Conventional
25% down · 7.5% · 30yr
- Down + closing
- —
- Monthly P&I
- —
- Monthly cashflow
- —
- DSCR
- —
- Eligible?
- —
Personal DTI + credit; lowest rate.
DSCR
20% down · 8.5% · 30yr
- Down + closing
- —
- Monthly P&I
- —
- Monthly cashflow
- —
- DSCR
- —
- Eligible?
- —
No personal income docs; deal must DSCR.
Hard money
10% down · 12.0% · 12mo
- Down + closing
- —
- Monthly P&I
- —
- Monthly cashflow
- —
- DSCR
- —
- Eligible?
- —
Short-term bridge; refi at stabilization.
Listing history 28 events
-
2026-06-19days on market $99,000 Active 121 DOM
-
2026-06-18days on market $99,000 Active 120 DOM
-
2026-06-17days on market $99,000 Active 119 DOM
-
2026-06-16days on market $99,000 Active 118 DOM
-
2026-06-15days on market $99,000 Active 117 DOM
-
2026-06-14days on market $99,000 Active 115 DOM
-
2026-06-13days on market $99,000 Active 114 DOM
-
2026-06-10days on market $99,000 Active 112 DOM
-
2026-06-09days on market $99,000 Active 111 DOM
-
2026-06-08days on market $99,000 Active 110 DOM
-
2026-06-07days on market $99,000 Active 109 DOM
-
2026-06-02days on market $99,000 Active 104 DOM
-
2026-06-01days on market $99,000 Active 103 DOM
-
2026-05-31days on market $99,000 Active 102 DOM
-
2026-05-30days on market $99,000 Active 101 DOM
-
2026-05-04price $99,000
-
2026-02-17$114,900 Active
-
2021-08-06historical
-
2021-08-06historical
-
2021-08-06historical
-
2021-08-06historical
-
2011-01-13historical
-
2008-10-15historical
-
2008-05-11historical
-
2006-09-08soldstatus $54,900
-
2006-08-02historical
-
2003-04-10soldstatus $51,500
-
2002-12-02$53,900
ⓘ Source: listings_history table (triggers on properties + properties_extension) + one-shot
backfill from property_details.listing_events for pre-trigger history.
Tax reassessment forecast IL · Partial reset (capped growth)
- Current annual tax
- $2,246 · $187/mo
- Projected year-2 tax
- $2,246 · $187/mo
- Expected delta
- +$1/yr ($0/mo · 0.0%)
ⓘ Screening estimate from a state-policy table — verify with the county assessor before closing.
Climate risk First Street
- Flood 1/10 Low FEMA zone X (unshaded) · 0% chance over 30 yrs
- Wildfire 1/10 Low
- Heat 4/10 Moderate 7 d/yr ≥107°F today · 21 d/yr by 30 yrs out
- Wind 2/10 Low 2% chance of damaging wind over 30 yrs
- Air quality 2/10 Low 0 unhealthy d/yr today · 1 by 30 yrs out
Nearby sold comps map
Loading sold comps map…
Walkable amenities ~0.75 mi
Loading nearby amenities…
Taxation est. · year 1
- Rental income
- $11,633
- − Mortgage interest
- −$5,546
- − Property taxes
- −$2,246
- − Insurance
- −$495
- − Repairs & maintenance
- −$931
- − Management
- −$931
- − Depreciation
- −$2,880
- Taxable loss
- −$1,394
- Est. tax savings @ 24.0%
- +$335
- After-tax cash flow
- $554/yr
For passive investors: Depreciation is non-cash, so a rental often shows a tax loss while cash-flowing — sheltering income. Rental losses are passive: they offset passive income freely, and up to $25,000/yr can offset ordinary (W-2) income if you actively participate and your MAGI is under $100k (phasing out to $0 by $150k); unused losses carry forward. On sale, claimed depreciation is recaptured at up to 25%, and gains may owe capital-gains tax (a 1031 exchange can defer both). Figures are a year-1 estimate at your 24.0% rate — not tax advice; consult a CPA.
Schools (NCES district)
- District
- Carbondale Chsd 165
- NCES district ID
- 1708370
- Math proficiency
- 26% ▼ -10.00%
- Reading proficiency
- 35% ▼ -2.00%
- Median HH income
- $22,075
- Composite
- 23.92/100
- National rank
- #7787
- State rank
- #279 of 620 in IL
Livability — Carbondale
- Score
- 70/100
- State rank
- #375
- US rank
- #7806
Category grades
Schools grade is shown separately in the Schools card above.
Census & demographics
- City population
- 22,946
- Population (ZIP)
- 2,069
Population outlook (Jackson County) Hauer SSP2
- Today (2025)
- 59,093 people
- By 2030
- 59,628 · +0.9%
- By 2040
- 59,495 · +0.7%
- By 2050
- 58,811 · -0.5%
- By 2075
- 57,683 · -2.4%
- By 2100
- 55,337 · -6.4%
Race, ethnicity, and origin ACS 2023
- Neighborhood character
- Predominantly White (91%)
- Race & ethnicity
- White 91% Asian 3% Black 3% Two or more races 2% Hispanic / Latino 1%
- Common ancestry
- Serbian 6% Romanian 3% Scotch-Irish 2%
- Foreign-born
- 4% · China
- Languages at home
- 96% English-only · Russian/Polish/Slavic 1% Other Indo-European 1% Chinese 1%
Political lean MEDSL · Jackson
- 2024 margin
- Toss-up / Even · D 51.0% · R 47.5% · Other 1.4%
- 2008→2024 swing
- -18.3pp toward R · 2008: 21.8pp · 2024: 3.5pp
- All cycles
- 2024: D+3.5 2020: D+1.3 2016: D+3.0 2012: D+10.3 2008: D+21.8
Not yet ingested
- Civics
- —
Market trends
- HPI YoY
- ▲ 4.27%
- Current HPI
- 128.5264
- Rent YoY
- —
- Metro
- —
- State GDP YoY
- ▲ 1.59%
- F500 in state
- 60
Industry mix (Fortune 500 HQ in IL)
| Industry | F500 HQs | Revenue |
|---|---|---|
| Insurance | 4 | $201B |
|
||
| Consumer Goods | 4 | $87B |
|
||
| Industrial Machinery | 3 | $64B |
|
||
| Healthcare | 2 | $55B |
|
||
| Retail / Pharmacy | 1 | $148B |
|
||
| Agriculture / Food | 1 | $86B |
|
||
Price history
+83.7% since first listed13 events — show timeline
- 2026-05-04 Price Changed $99,000 MRED as Distributed by MLS Grid
- 2026-02-17 Listed $114,900 MRED as Distributed by MLS Grid
- 2021-08-06 Listing Removed — RMLSA as Distributed by MLS Grid
- 2021-08-06 Listing Removed — RMLSA as Distributed by MLS Grid
- 2021-08-06 Listing Removed — RMLSA as Distributed by MLS Grid
- 2021-08-06 Listing Removed — RMLSA as Distributed by MLS Grid
- 2011-01-13 Listing Removed — MRED as Distributed by MLS Grid
- 2008-10-15 Listing Removed — MRED as Distributed by MLS Grid
- 2008-05-11 Listing Removed — MRED as Distributed by MLS Grid
- 2006-09-08 Sold (Public Records) $54,900 Public Records
- 2006-08-02 Listing Removed — MRED as Distributed by MLS Grid
- 2003-04-10 Sold (MLS) $51,500 RMLSA as Distributed by MLS Grid
- 2002-12-02 Listed $53,900 RMLSA as Distributed by MLS Grid
Property tax history
+3.2%/yrLatest (2024): $2,246 · +7.1% YoY. Source: county tax records.
Cash-flow waterfall
monthlySold comps — $/sqft
last 12 mo · ≤1 miLoading sold comps…