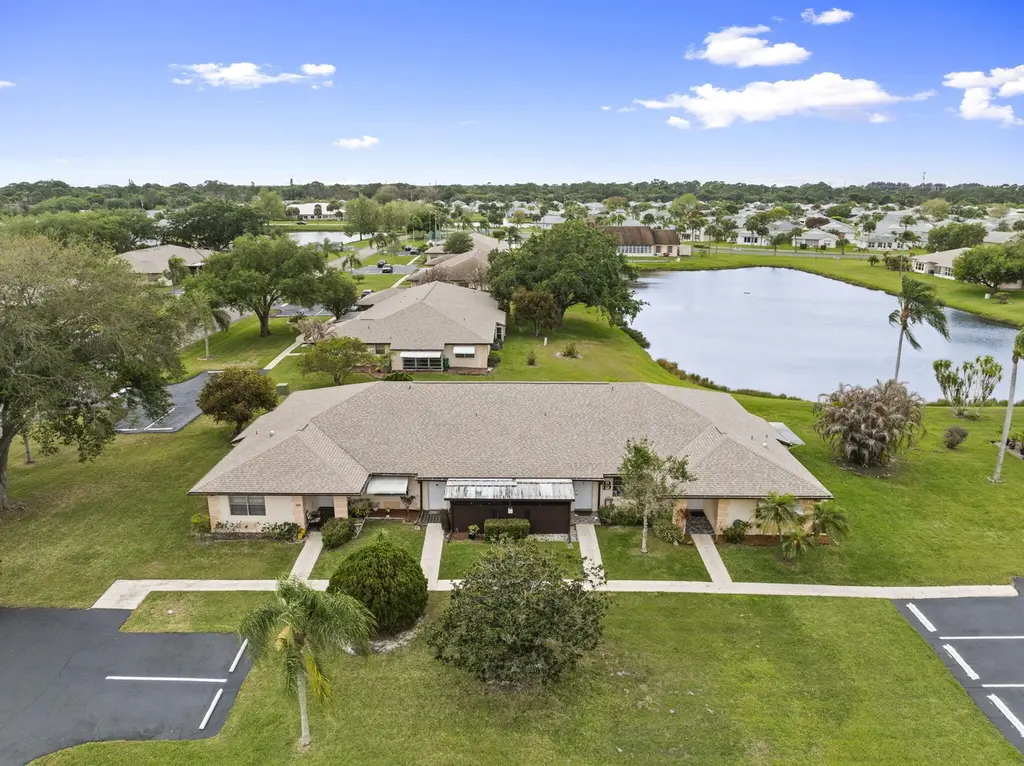
519 Ponderosa Dr #43 · Indian River Estates, FL
Flood risk 4/10 · Minor
- FEMA flood zone
- X (unshaded)
- Chance of flooding over 30 yrs
- 0.24%
- Est. flood insurance / yr
- $507 – $1,088
Fire risk 2/10 · Minimal
- Est. fire insurance / yr
- $947 – $1,759
Heat risk 10/10 · Severe
- Hot days now (above 106°F)
- 7 days/yr
- Hot days in 30 yrs
- 25 days/yr
Wind risk 10/10 · Severe
- Chance of severe wind over 30 yrs
- 99.0%
Air-quality risk 2/10 · Minimal
- Unhealthy air days now
- 1 days/yr
- Unhealthy air days in 30 yrs
- 1 days/yr
Risk factors via First Street. Map © Google.
Why this score? — see what drove the C- grade
The composite is a weighted blend of 9 inputs, each scored 0–100. Each bar is that input's sub-score; the figure is the points it added to the 100-point composite (weight × sub-score).
- Cash flow +15.8/30.0
- 1% rule +7.6/10.0
- ARV discount +7.5/15.0
- DSCR +4.9/10.0
- Rent growth +4.4/5.0
- Condition / age +3.8/5.0
- Schools +3.7/10.0
- Livability +3.2/5.0
- Appreciation +0.0/10.0
$168,900
🖨 Deal sheet 📄 Offer letter ✓ Due diligence
Listing remarks
Aggressively priced end-unit waterfront condo offering serene lake views & endless potential. Tiled front entry welcomes you with landscaping ready to be customized to your desire. Featuring partially updated kitchens & bathrooms, this home includes an oversized Florida room filled with lots of natural light, perfect for relaxing while listening to the soothing sounds of the lake's fountain. Washer & dryer conveniently located in unit. AC 2016, HWH 2023. A fantastic opportunity to enjoy waterfront living at an exceptional value. Gated & guarded community with low county only taxes. HOA fees includes cable, internet, water & sewer. The Grove features a heated p
Key facts
- $435 HOA
- Parking
- Community pool
Property features AI
Finance
- Financial info: Pets allowed with number and size limits; Community contains 144 units
- HOA & community: Association: The Grove; Monthly association fee; Association amenities include clubhouse, heated pool, pool, tennis courts, pickleball and shuffleboard courts, bocce ball, billiard room, community room, recreation facilities, management/manager on site, gated security, street lights, parking, internet included; Association fee covers cable TV, insurance, internet, grounds and structure maintenance, security, sewer, trash, water, common real estate tax, reserve funds, roof repairs, recreation facility and pool service
Exterior
- Parking: Assigned parking; Guest parking; 4 open parking spaces (1 total assigned/allocated space listed)
- Security: Gated community with guard; Security guard onsite; Smoke detector(s)
- Utilities: Public water; Public sewer; Cable available; Electricity available; Sewer connected; Water connected
- Home design: Condominium; One story; Resale condition; Faces north
- Construction: Built with block/concrete/CB S and stucco; Shingle roof; Slab foundation
- Exterior features: Private maintained road; Waterfront
Interior
- Kitchen: Disposal; Dishwasher; Electric range; Microwave; Refrigerator
- Bedrooms: 2 bedrooms on the main level
- Flooring: Carpet; Tile
- Bathrooms: 2 full bathrooms
- Heating & cooling: Central electric heating; Central air conditioning; Ceiling fan(s)
- Interior features: Entrance foyer; Walk-in closet(s); Split bedroom layout; Furnished
- Laundry & utility: Laundry closet inside the unit
Neighborhood map
What this means for you Summary
Snapshot
- This is a 2-bed/2.0-bath condo listed at $169k. Condition is rated good.
Deal economics
- At list price, monthly cash flow is $76 ($910/yr) — positive.
- The deal already cash-flows at list — no discount required.
- Meets the 1% rule at list price ($2k rent vs $169k).
- Recommended offer: $159k (6.0% below list) — sets the bar for market timing.
- Cap rate 6.8% vs local median 5.3% in Indian River Estates — meaningfully above typical; check what's discounted (condition, days-on-market, listing class) to confirm the premium yield is real.
Location & tenants
- Location reads 65/100 on livability (#653 in FL) — a middle-class / working-renter tenant base. Strengths: cost of living A+, housing A+, crime B+; Watch: employment D+, schools F, amenities F.
- St. Lucie (urban): math 40% / reading 48% proficiency, ranked #51 of 73 in FL (top 70%) — families likely to look elsewhere, expect single-tenant / working-renter base with shorter leases.
- Market conditions: Rents rising fast (+7.4%/yr); 336 active listings in the ZIP; 9 comparable units currently listed for rent nearby; rentals at typical pace (median 23d on market — plan ~3-4 weeks tenant-placement turnaround); 4,868 units permitted in St. Lucie County in 2024 (268 in 5+ unit buildings).
- At $2,124/mo this rent would consume 47% of the median local household income ($54k/yr) (locally 1086% of renters already pay >50% of income on rent) — very limited rent-growth headroom before tenants either downsize or default.
Forward outlook
- Local home prices are declining (-3.0%/yr); year-one equity from $1k of loan paydown is wiped out by about $5k of value loss. Plan a longer hold.
- St. Lucie County population projected at +20% by 2050 — long-run rental-demand tailwind backs the buy-and-hold thesis.
- At projected returns (-3.0% appreciation + 7.4% rent growth), your $47k cash investment doubles in ~10 years — after that, you're playing with house money.
Negotiation context
- It's been on market 72 days — a 6% lower offer ($159k) is reasonable based on typical stale-listing flexibility.
Risks & watch-outs
- Watch-outs: HOA is 20% of rent.
- Climate carrying-cost: severe wind risk, 99% chance of damaging wind over 30y; extreme-heat days projected 7→25/yr by 2055 (HVAC capex compounding) — expect insurance premiums to compound above CPI over the hold.
Questions for the listing agent
- It's been on market 72 days. Have you received any prior offers? Is the seller open to a 6% concession, seller financing, or rate buy-down credit?
- What does the HOA fee cover, when was the last increase, and are there any pending special assessments or reserve-fund shortfalls?
- Any open or pending special assessments — roof, HVAC, plumbing, elevator, façade? What's the per-unit balance and payoff schedule, and is the seller paying it off at close or rolling it to the buyer?
- Why hasn't it sold? Are there any deal-killer items the seller is aware of (foundation, flood, title, zoning, code violations)?
- Is there a deadline driving the sale (1031 exchange, divorce, estate, relocation)? That informs how much negotiation room exists.
- Schools are F-rated, which usually means shorter tenancies and higher turnover. Who's the typical renter profile here, and what's been the actual vacancy rate?
- What's the average days-on-market for RENTAL listings here right now (not sales)? A rising rental-DOM trend means longer vacancies and softer asking-rent achievability than the comps imply.
- What's the recent tenant-quality profile in this submarket — average credit score on applications, eviction rate, late-payment / NSF rate, and stable-employment percentage? A property-management company in the area should have these aggregated.
- How much new apartment / multifamily construction is in the pipeline within 1–3 miles? Heavy new supply (>2% of stock underway) typically softens rents 12–24 months out; light construction supports rent growth.
Investment metrics
- 1% rule
- 1.26% ✓
- Cap rate
- 6.83%
- Cash-on-cash
- 1.92%
- DSCR
- 1.09
- GRM
- 6.6
CMA / ARV
No comps found within radius.
Projected returns pro-forma
-3.0% appreciation · 7.42% rent growth · sell at horizon
- IRR
- -6.7%
- Equity multiple
- 0.74×
- Total profit
- $-12,375
- Equity at exit
- $25,184
- IRR
- 9.0%
- Equity multiple
- 1.87×
- Total profit
- $41,018
- Equity at exit
- $14,603
Cash invested: $47,292 (down + closing). Projections, not guarantees.
Landlord ↔ Tenant lean methodology
- Overall (STATE)
- 87 Strongly Landlord-Friendly
- State Florida
- 87 Strongly Landlord-Friendly · R+3
- County
- — inherits STATE
- City
- — inherits STATE
ZIP-level market 34982
- Home prices YoY
- -33.4%
- Rents YoY
- 7.4%
- Active inventory
- 336
- Price-to-rent
- 6.6×
Monthly cashflow live
- Estimated rent
- $2,124 high interval (Pro) →
- Mortgage (P&I)
- −$886
- Tax est. 1.5%
- −$211 /mo · $2,534/yr
- Insurance
- −$70
- HOA
- −$435
- Vacancy / Maint / Mgmt
- −$446
- Net cashflow
- $76
Break-even live
UW: 25.0% down · 7.5% · 30yr · 1.5% tax · 5.0% vac · 8.0% maint · 8.0% mgmt
Financing live
Cash to close
- Down payment
- $42,225
- Closing costs
- $5,067
- Reserves months
- —
- Total cash needed
- —
Loan-product check · same deal, 3 products live
Conventional
25% down · 7.5% · 30yr
- Down + closing
- —
- Monthly P&I
- —
- Monthly cashflow
- —
- DSCR
- —
- Eligible?
- —
Personal DTI + credit; lowest rate.
DSCR
20% down · 8.5% · 30yr
- Down + closing
- —
- Monthly P&I
- —
- Monthly cashflow
- —
- DSCR
- —
- Eligible?
- —
No personal income docs; deal must DSCR.
Hard money
10% down · 12.0% · 12mo
- Down + closing
- —
- Monthly P&I
- —
- Monthly cashflow
- —
- DSCR
- —
- Eligible?
- —
Short-term bridge; refi at stabilization.
Rent comps 9 comps
| Address | Beds | Baths | Sqft | Rent | $/sqft | DOM | Units | Dist |
|---|---|---|---|---|---|---|---|---|
| 492 Salisbury Cir Fort Pierce, FL | 3.0 | 2.5 | 1486 | $2,395 | $1.61 | 23d | 1 | 0.65mi |
| 203 Melton Dr Unit B Fort Pierce, FL | 2.0 | 1.0 | 1200 | $1,800 | $1.50 | 23d | 1 | 0.66mi |
| 526 Salisbury Cir Fort Pierce, FL | 3.0 | 2.5 | 1486 | $2,399 | $1.61 | 13d | 1 | 0.66mi |
| 341 Ashley St Fort Pierce, FL | 3.0 | 2.0 | 1128 | $2,460 | $2.18 | 23d | 1 | 0.81mi |
| 355 Johnston St Fort Pierce, FL | 3.0 | 1.5 | 1118 | $2,500 | $2.24 | 23d | 1 | 0.86mi |
| 352 Johnston St Fort Pierce, FL | 3.0 | 2.0 | 936 | $2,100 | $2.24 | 23d | 1 | 0.89mi |
| 5300 Seagrape Dr Fort Pierce, FL | 3.0 | 2.0 | 1300 | $2,450 | $1.88 | 23d | 1 | 0.90mi |
| 330 Borraclough St Fort Pierce, FL | 3.0 | 2.0 | 1404 | $2,175 | $1.55 | 13d | 1 | 0.94mi |
| 5315 Hickory Dr Fort Pierce, FL | 3.0 | 2.0 | 1400 | $2,045 | $1.46 | 23d | 1 | 1.02mi |
HOA detail condo
- Monthly dues
- $435 · $5,220/yr
- Likely covers
- watersewerinternetcablelandscapingsecurity
- Assessments
- None detected in remarks — confirm with the listing agent.
Listing history 19 events
-
2026-06-18days on market $168,900 Active 72 DOM
-
2026-06-17days on market $168,900 Active 71 DOM
-
2026-06-16days on market $168,900 Active 70 DOM
-
2026-06-15days on market $168,900 Active 69 DOM
-
2026-06-14days on market $168,900 Active 67 DOM
-
2026-06-13days on market $168,900 Active 66 DOM
-
2026-06-10days on market $168,900 Active 64 DOM
-
2026-06-09days on market $168,900 Active 63 DOM
-
2026-06-08days on market $168,900 Active 62 DOM
-
2026-06-07days on market $168,900 Active 61 DOM
-
2026-06-05days on market $168,900 Active 58 DOM
-
2026-06-03days on market $168,900 Active 57 DOM
-
2026-06-02days on market $168,900 Active 56 DOM
-
2026-06-01days on market $168,900 Active 55 DOM
-
2026-05-31days on market $168,900 Active 54 DOM
-
2026-05-30remarks 679-char remark
-
2026-05-30pricedays on market $168,900 Active 53 DOM
-
2026-05-02price $174,900
-
2026-04-07$189,700 Active
ⓘ Source: listings_history table (triggers on properties + properties_extension) + one-shot
backfill from property_details.listing_events for pre-trigger history.
Climate risk First Street
- Flood 4/10 Moderate FEMA zone X (unshaded) · 24% chance over 30 yrs
- Wildfire 2/10 Low
- Heat 10/10 Extreme 7 d/yr ≥106°F today · 25 d/yr by 30 yrs out
- Wind 10/10 Extreme 99% chance of damaging wind over 30 yrs
- Air quality 2/10 Low 1 unhealthy d/yr today · 1 by 30 yrs out
Nearby sold comps map
Loading sold comps map…
Walkable amenities ~0.75 mi
Loading nearby amenities…
Taxation est. · year 1
- Rental income
- $25,489
- − Mortgage interest
- −$9,461
- − Property taxes
- −$2,534
- − Insurance
- −$844
- − Repairs & maintenance
- −$2,039
- − Management
- −$2,039
- − HOA
- −$5,220
- − Depreciation
- −$4,913
- Taxable loss
- −$1,562
- Est. tax savings @ 24.0%
- +$375
- After-tax cash flow
- $1,284/yr
For passive investors: Depreciation is non-cash, so a rental often shows a tax loss while cash-flowing — sheltering income. Rental losses are passive: they offset passive income freely, and up to $25,000/yr can offset ordinary (W-2) income if you actively participate and your MAGI is under $100k (phasing out to $0 by $150k); unused losses carry forward. On sale, claimed depreciation is recaptured at up to 25%, and gains may owe capital-gains tax (a 1031 exchange can defer both). Figures are a year-1 estimate at your 24.0% rate — not tax advice; consult a CPA.
Condition & rehab AI · 12 photos
This waterfront condo is in good condition with a good condition score of 75. It has a good exterior, kitchen, and bathrooms. The property has a good foundation and structure, and the HVAC and mechanical systems are up to date. The property has a good roof and windows. The property has a good landscaping and curb appeal. The property has a good foundation and structure, and the HVAC and mechanical systems are up to date. The property has a good roof and windows. The property has a good landscaping and curb appeal.
Value-add opportunities
- Both paint exterior — enhances curb appeal and resale value
- Both update flooring in living room — improves aesthetics and rental appeal
- Both install new carpet — enhances comfort and resale value
Renovation cost estimate screening
Value-add ROI direction
- Both paint exterior — enhances curb appeal and resale value ↑
- Both update flooring in living room — improves aesthetics and rental appeal ↑
- Both install new carpet — enhances comfort and resale value ↑
ⓘ Cost ranges are severity-bucket heuristics (US national rule-of-thumb). Get contractor quotes + a written scope before underwriting a rehab budget.
Schools (NCES district)
- District
- St. Lucie
- NCES district ID
- 1201770
- Math proficiency
- 40% ▼ -11.00%
- Reading proficiency
- 48% ▼ -4.00%
- Median HH income
- $44,737
- Composite
- 37.28/100
- National rank
- #4449
- State rank
- #51 of 73 in FL
Livability — Indian River Estates
- Score
- 65/100
- State rank
- #653
- US rank
- #12946
Category grades
Schools grade is shown separately in the Schools card above.
Census & demographics
- Census place
- Indian River Estates, FL
- County
- Saint Lucie County · 337,150 people
- City population
- 27,447
- Metro
- Port St. Lucie, FL
- Population (ZIP)
- 31,143
- Household income
- $54,082
- Rent vs Own
- Severe rent burden
- 1086.0
Population outlook (St. Lucie County) Hauer SSP2
- Today (2025)
- 338,016 people
- By 2030
- 355,687 · +5.2%
- By 2040
- 385,521 · +14.1%
- By 2050
- 406,106 · +20.1%
- By 2075
- 441,054 · +30.5%
- By 2100
- 436,885 · +29.2%
Race, ethnicity, and origin ACS 2023
- Neighborhood character
- Majority White (62%)
- Race & ethnicity
- White 62% Hispanic / Latino 22% Two or more races 12% Black 12%
- Hispanic origin (detail)
- Mexican 10% Puerto Rican 3% Cuban 3%
- Common ancestry
- Italian 7% Hispanic 2% Lithuanian 1%
- Foreign-born
- 12% · Canada
- Languages at home
- 80% English-only · Spanish 16% French/Haitian/Cajun 3%
Political lean MEDSL · St. Lucie
- 2024 margin
- Lean R (+9.1) · D 45.1% · R 54.2%
- 2008→2024 swing
- -21.2pp toward R · 2008: 12.1pp · 2024: -9.1pp
- All cycles
- 2024: R+9.1 2020: R+1.6 2016: R+2.5 2012: D+7.9 2008: D+12.1
Not yet ingested
- Civics
- —
Market trends
- HPI YoY
- ▼ -199.47%
- Current HPI
- 397.2649
- Rent YoY
- ▲ 7.42%
- Metro
- Port St. Lucie, FL
- State GDP YoY
- ▲ 3.28%
- F500 in state
- 36
Industry mix (Fortune 500 HQ in FL)
| Industry | F500 HQs | Revenue |
|---|---|---|
| Industrial Technology | 2 | $29B |
|
||
| Insurance | 2 | $17B |
|
||
| Retail | 1 | $60B |
|
||
| Technology Distribution | 1 | $58B |
|
||
| Homebuilding | 1 | $35B |
|
||
| Technology Manufacturing | 1 | $35B |
|
||
Price history
-7.8% since first listed2 events — show timeline
- 2026-05-02 Price Changed $174,900 Beaches MLS
- 2026-04-07 Listed $189,700 Beaches MLS
Cash-flow waterfall
monthlySold comps — $/sqft
last 12 mo · ≤1 miLoading sold comps…