 🌊 Lakefront
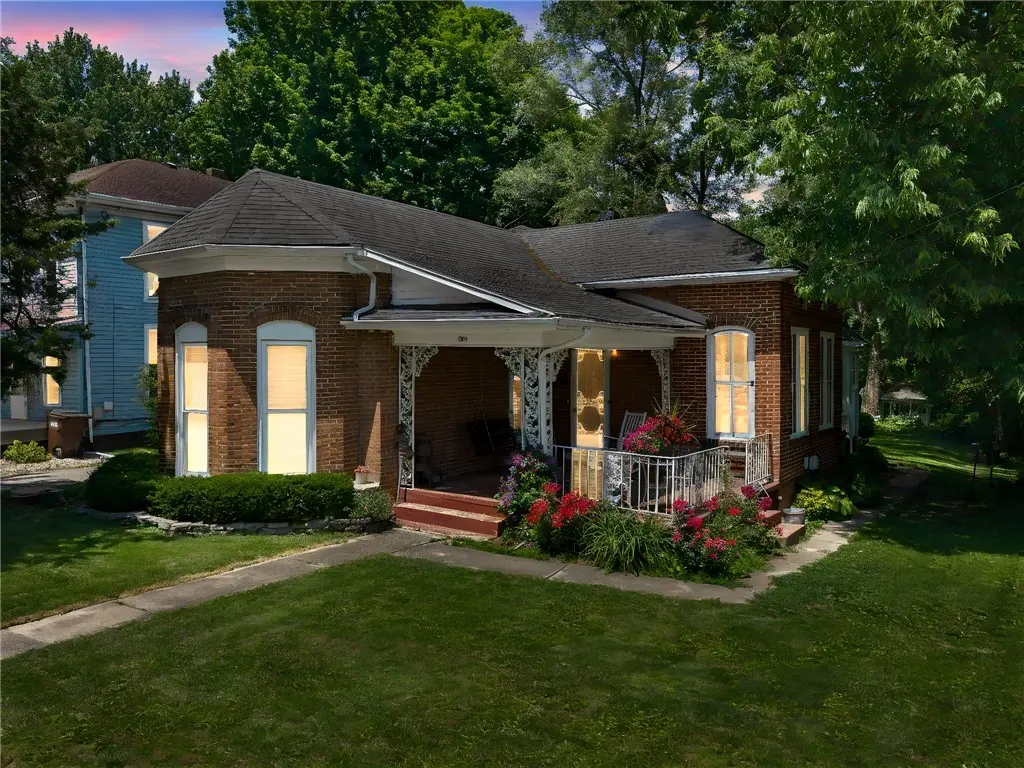
300 W Water St · Greenville, OH
Flood risk 1/10 · Minimal
- FEMA flood zone
- X (unshaded)
- Chance of flooding over 30 yrs
- 0.0%
- Est. flood insurance / yr
- $473 – $860
Fire risk 1/10 · Minimal
- Est. fire insurance / yr
- $713 – $1,323
Heat risk 3/10 · Minor
- Hot days now (above 100°F)
- 7 days/yr
- Hot days in 30 yrs
- 18 days/yr
Wind risk 2/10 · Minimal
- Chance of severe wind over 30 yrs
- —
Air-quality risk 3/10 · Minor
- Unhealthy air days now
- 2 days/yr
- Unhealthy air days in 30 yrs
- 3 days/yr
Risk factors via First Street. Map © Google.
Why this score? — see what drove the D+ grade
The composite is a weighted blend of 9 inputs, each scored 0–100. Each bar is that input's sub-score; the figure is the points it added to the 100-point composite (weight × sub-score).
- Cash flow +14.7/30.0
- ARV discount +13.9/15.0
- DSCR +4.5/10.0
- Schools +4.1/10.0
- Livability +3.5/5.0
- 1% rule +3.0/10.0
- Rent growth +2.5/5.0
- Condition / age +2.5/5.0
- Appreciation +0.0/10.0
$165,000
🖨 Deal sheet (PDF) 📄 Offer letter ✓ Due diligence
Listing remarks
Step back in time and experience the charm, character, and history of this remarkable 120 year old home situated on an oversized lot along Greenville Creek. Rich with original craftsmanship & architectural details, this unique property features stunning original woodwork, beautiful wood flooring, high baseboards, original wood doors, & impressive circular entryway that creates a memorable first impression. Soaring 12-15 foot ceilings add to the home's spacious feel, while Southern oak window shutters provide timeless elegance. The main level offers flexibility with a front bedroom featuring a private attached half bath with built-in cubbies & negotiable electric fireplace.
Key facts
- Original wood doors
- High baseboards
- 0.71 acre lot
Tags
Property features AI
Finance
- Financial info: Offered for sale
Exterior
- Parking: No garage
- Utilities: Central air conditioning; Forced air heating
- Home design: Single-story home; Brick construction; Waterfront property; Residential zoning
- Construction: Brick construction; Partial basement
- Exterior features: Deck; Patio; Porch; Partial fencing; Shed(s); Yard / storage
Interior
- Kitchen: Dishwasher; Microwave; Range; Pantry
- Bedrooms: Bedroom on main level (9 x 9); Bedroom on main level (13 x 11)
- Bathrooms: 2 full bathrooms (both on main level)
- Heating & cooling: Forced air heating; Central air conditioning
- Interior features: Laminate counters; Pantry; Decorative fireplace
- Laundry & utility: Main level laundry room (14 x 10)
Neighborhood map
What this means for you Summary
Snapshot
- This is a 3-bed/2.0-bath single-family listed at $165k.
Deal economics
- At list price, monthly cash flow is $41 ($496/yr) — positive.
- The deal already cash-flows at list — no discount required.
- To meet the 1% rule (rent ≥ 1% of price), the offer needs to be $132k (20.2% below list).
- Recommended offer: $132k (20.2% below list) — sets the bar for 1% rule.
- Cap rate 6.6% vs local median 3.9% in Greenville — top-decile yield for the area; either an underpriced asset or a hidden risk that comps aren't pricing in. Stress-test before assuming the spread holds.
Location & tenants
- Location reads 69/100 on livability (#514 in OH) — a middle-class / working-renter tenant base. Strengths: cost of living A+, housing A+; Watch: health & safety C-, amenities F, commute F.
- Greenville City (town): math 49% / reading 50% proficiency, ranked #456 of 656 in OH (top 70%) — families likely to look elsewhere, expect single-tenant / working-renter base with shorter leases.
- Zoned schools: Greenville Elementary School (math 60% / reading 52%, grade C+, #766 of 1,584 statewide, top 49%, 823 students, 48% FRL); Greenville Middle School (math 48% / reading 46%, grade D+, #451 of 654 statewide, top 70%, 717 students, 44% FRL); Greenville Senior High School (math 37% / reading 56%, grade D-, #460 of 781 statewide, top 59%, 808 students, 31% FRL) — zoned schools at 41% FRL track the district average.
- Market conditions: 76 active listings in the ZIP; 43 units permitted in Darke County in 2024 (0 in 5+ unit buildings).
Forward outlook
- Local home prices are declining (-3.0%/yr); year-one equity from $1k of loan paydown is wiped out by about $5k of value loss. Plan a longer hold.
- Darke County population projected at -20% by 2050 — secular population decline; favor cash flow + early exit over multi-decade hold.
Negotiation context
- Only 3 days on market — expect competitive offers; lowballing is unlikely to land.
- Current owner paid $82k; list at $165k implies a 101% gain — meaningful room to come down on a strong offer.
Risks & watch-outs
- Watch-outs: built in 1900 — expect roof / HVAC / electrical / plumbing capex.
Questions for the listing agent
- Built in 1900 — when were the roof, HVAC, electrical panel, plumbing, and water heater last replaced?
- Is there a deadline driving the sale (1031 exchange, divorce, estate, relocation)? That informs how much negotiation room exists.
- The area grade is low — what's the realistic commute time and amenity access for the typical tenant pool here? Any planned neighborhood developments (good or bad) we should know about?
- This sits on a lake — are riparian / water-frontage rights deeded with the parcel? Any dock permits, shoreline easements, or HOA water-use restrictions?
- What's the documented flood / surge / shoreline-erosion history here (FEMA AND non-FEMA — e.g., storm surge, creek backup, septic-field saturation)?
- Any water-quality or seasonal algae-bloom issues that affect tenant satisfaction or short-term-rental demand?
- What's the average days-on-market for RENTAL listings here right now (not sales)? A rising rental-DOM trend means longer vacancies and softer asking-rent achievability than the comps imply.
- What's the recent tenant-quality profile in this submarket — average credit score on applications, eviction rate, late-payment / NSF rate, and stable-employment percentage? A property-management company in the area should have these aggregated.
- How much new for-sale + rental construction is in the pipeline within 1–3 miles? Heavy new supply typically softens prices + rents 12–24 months out; constrained supply supports both.
Investment metrics
- 1% rule
- 0.80% ✗
- Cap rate
- 6.59%
- Cash-on-cash
- 1.07%
- DSCR
- 1.05
- GRM
- 10.4
CMA / ARV
- ARV (on-the-fly)
- $192,390
- Comps found
- 12
Show comp detail 12 sales within ~0.75 mi
| Address | Dist | Beds/Ba | Sqft | Sold | Price | $/sf | Match |
|---|---|---|---|---|---|---|---|
| 210 Central Ave | 0.35mi | 3/2.0 | 1,672 (-3%) | 2mo | $140,000 | $84 | 78 |
| 312 E Water St | 0.40mi | 3/1.5 | 1,768 (+3%) | 8mo | $127,000 | $72 | 68 |
| 319 Locust St | 0.48mi | 3/1.5 | 1,680 (-2%) | 7mo | $140,000 | $83 | 66 |
| 537 E 3rd St | 0.65mi | 3/1.0 | 1,694 (-1%) | 1mo | $70,000 | $41 | 63 |
| 624 E 3rd St | 0.70mi | 3/1.5 | 1,664 (-3%) | 4mo | $77,000 | $46 | 57 |
| 211 Cypress St | 0.43mi | 4/2.0 (+1) | 1,590 (-7%) | 9mo | $86,250 | $54 | 55 |
| 318 E Water St | 0.41mi | 3/1.5 | 1,461 (-15%) | 4mo | $195,000 | $133 | 50 |
| 635 N Broadway St | 0.69mi | 4/2.0 (+1) | 1,838 (+7%) | 1mo | $215,000 | $117 | 50 |
| 601 N Broadway St | 0.61mi | 4/2.0 (+1) | 1,824 (+6%) | 9mo | $202,000 | $111 | 49 |
| 220 Anderson Ave | 0.74mi | 4/1.0 (+1) | 1,676 (-2%) | 5mo | $120,000 | $72 | 48 |
| 534 Union St | 0.62mi | 3/1.0 | 1,539 (-10%) | 8mo | $177,500 | $115 | 43 |
| 220 Sweitzer St | 0.40mi | 4/1.0 (+1) | 1,466 (-15%) | 9mo | $116,000 | $79 | 40 |
Match score weights: distance 35% · size 25% · config 20% · recency 20%. Top-matched comps best support the ARV.
Projected returns pro-forma
-3.0% appreciation · 3.0% rent growth · sell at horizon
- IRR
- -14.6%
- Equity multiple
- 0.48×
- Total profit
- $-24,170
- Equity at exit
- $24,602
- IRR
- -6.0%
- Equity multiple
- 0.61×
- Total profit
- $-17,928
- Equity at exit
- $14,266
Cash invested: $46,200 (down + closing). Projections, not guarantees.
Landlord ↔ Tenant lean methodology
- Overall (STATE)
- 73 Landlord-Friendly
- State Ohio
- 73 Landlord-Friendly · R+6
- County
- — inherits STATE
- City
- — inherits STATE
ZIP-level market 45331
- Active inventory
- 76
- Price-to-rent
- 10.4×
Monthly cashflow live
- Estimated rent
- $1,316 medium interval (Pro) →
- Mortgage (P&I)
- −$865
- Tax from tax record
- −$64 /mo · $771/yr
- Insurance
- −$69
- HOA
- −$0
- Vacancy / Maint / Mgmt
- −$276
- Net cashflow
- $41
Break-even live
Sensitivity live
| Price | -10% $135 | -5% $88 | +0% $41 | +5% $-5 | +10% $-52 |
|---|---|---|---|---|---|
| Rent | -10% $-63 | -5% $-11 | +0% $41 | +5% $93 | +10% $145 |
| Rate | -1.0pp $124 | -0.5pp $83 | base $41 | +0.5pp $-1 | +1.0pp $-45 |
UW: 25.0% down · 7.5% · 30yr · 1.5% tax · 5.0% vac · 8.0% maint · 8.0% mgmt
Financing live
Cash to close
- Down payment
- $41,250
- Closing costs
- $4,950
- Reserves months
- —
- Total cash needed
- —
Loan-product check · same deal, 3 products live
Conventional
25% down · 7.5% · 30yr
- Down + closing
- —
- Monthly P&I
- —
- Monthly cashflow
- —
- DSCR
- —
- Eligible?
- —
Personal DTI + credit; lowest rate.
DSCR
20% down · 8.5% · 30yr
- Down + closing
- —
- Monthly P&I
- —
- Monthly cashflow
- —
- DSCR
- —
- Eligible?
- —
No personal income docs; deal must DSCR.
Hard money
10% down · 12.0% · 12mo
- Down + closing
- —
- Monthly P&I
- —
- Monthly cashflow
- —
- DSCR
- —
- Eligible?
- —
Short-term bridge; refi at stabilization.
Listing history 5 events
-
2026-06-09status $165,000 Pending 3 DOM
-
2026-06-08days on market $165,000 Active 3 DOM
-
2026-06-08days on market $165,000 Active 2 DOM
-
2026-06-07remarks 687-char remark
-
2026-06-07$165,000 Active 1 DOM
ⓘ Source: listings_history table (triggers on properties + properties_extension) + one-shot
backfill from property_details.listing_events for pre-trigger history.
Tax reassessment forecast OH · Partial reset (capped growth)
- Current annual tax
- $771 · $64/mo
- Projected year-2 tax
- $1,672 · $139/mo
- Expected delta
- +$902/yr (+$75/mo · 117.0%)
ⓘ Screening estimate from a state-policy table — verify with the county assessor before closing.
Climate risk First Street
- Flood 1/10 Low FEMA zone X (unshaded) · 0% chance over 30 yrs
- Wildfire 1/10 Low
- Heat 3/10 Moderate 7 d/yr ≥100°F today · 18 d/yr by 30 yrs out
- Wind 2/10 Low
- Air quality 3/10 Moderate 2 unhealthy d/yr today · 3 by 30 yrs out
Nearby sold comps map
Loading sold comps map…
Walkable amenities ~0.75 mi
Loading nearby amenities…
Taxation est. · year 1
- Rental income
- $15,792
- − Mortgage interest
- −$9,243
- − Property taxes
- −$771
- − Insurance
- −$825
- − Repairs & maintenance
- −$1,263
- − Management
- −$1,263
- − Depreciation
- −$4,800
- Taxable loss
- −$2,373
- Est. tax savings @ 24.0%
- +$570
- After-tax cash flow
- $1,066/yr
For passive investors: Depreciation is non-cash, so a rental often shows a tax loss while cash-flowing — sheltering income. Rental losses are passive: they offset passive income freely, and up to $25,000/yr can offset ordinary (W-2) income if you actively participate and your MAGI is under $100k (phasing out to $0 by $150k); unused losses carry forward. On sale, claimed depreciation is recaptured at up to 25%, and gains may owe capital-gains tax (a 1031 exchange can defer both). Figures are a year-1 estimate at your 24.0% rate — not tax advice; consult a CPA.
Schools (NCES district)
- District
- Greenville City
- NCES district ID
- 3904409
- Math proficiency
- 49% ▼ -15.00%
- Reading proficiency
- 50% ▼ -7.00%
- Median HH income
- $39,578
- Composite
- 41.38/100
- National rank
- #3488
- State rank
- #456 of 656 in OH
Livability — Greenville
- Score
- 69/100
- State rank
- #514
- US rank
- #8744
Category grades
Schools grade is shown separately in the Schools card above.
Census & demographics
- Census place
- Greenville, OH
- County
- Darke · 50,606 people
- Population (ZIP)
- 22,298
- Household income
- $53,797
- Rent vs Own
- Severe rent burden
- 13.3
Population outlook (Darke County) Hauer SSP2
- Today (2025)
- 49,377 people
- By 2030
- 47,494 · -3.8%
- By 2040
- 43,553 · -11.8%
- By 2050
- 39,320 · -20.4%
- By 2075
- 30,091 · -39.1%
- By 2100
- 21,110 · -57.2%
Race, ethnicity, and origin ACS 2023
- Neighborhood character
- Predominantly White (95%)
- Race & ethnicity
- White 95% Two or more races 3% Hispanic / Latino 2%
- Common ancestry
- Lithuanian 2% Italian 1% Iranian 1%
- Foreign-born
- 1% · Canada
- Languages at home
- 98% English-only · Spanish 1%
Political lean MEDSL · Darke
- 2024 margin
- Solid R (+65.4) · D 17.0% · R 82.3%
- 2008→2024 swing
- -29.2pp toward R · 2008: -36.1pp · 2024: -65.4pp
- All cycles
- 2024: R+65.4 2020: R+63.6 2016: R+61.2 2012: R+44.9 2008: R+36.1
Not yet ingested
- Civics
- —
Market trends
- HPI YoY
- ▼ -110.47%
- Current HPI
- 201.8715
- Rent YoY
- —
- Metro
- —
- State GDP YoY
- ▲ 1.98%
- F500 in state
- 48
Industry mix (Fortune 500 HQ in OH)
| Industry | F500 HQs | Revenue |
|---|---|---|
| Insurance | 3 | $145B |
|
||
| Industrial Machinery | 3 | $49B |
|
||
| Financial Services | 3 | $24B |
|
||
| Consumer Goods | 2 | $93B |
|
||
| Aerospace / Defense | 2 | $47B |
|
||
| Utilities | 2 | $33B |
|
||
Price history
+560.0% since first listed4 events — show timeline
- 2026-06-05 Listed $165,000 Dayton MLS
- 2003-06-13 Sold (Public Records) $82,000 Public Records
- 1994-05-11 Sold (Public Records) $67,000 Public Records
- 1988-05-31 Sold (Public Records) $25,000 Public Records
Property tax history
-2.3%/yrLatest (2025): $771 · +7.7% YoY. Source: county tax records.
Cash-flow waterfall
monthlySold comps — $/sqft
last 12 mo · ≤1 miLoading sold comps…