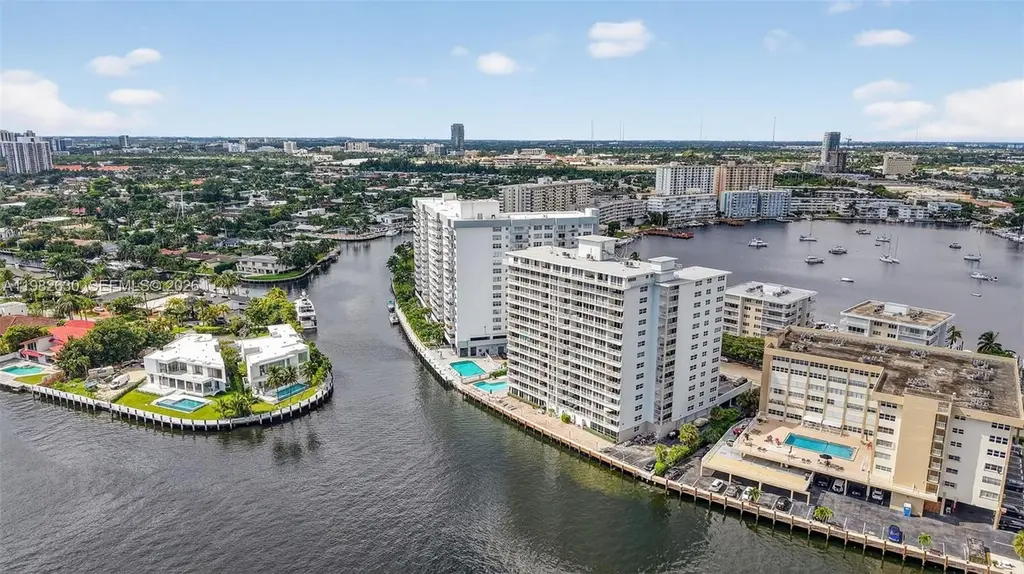
121 Golden Isles Dr #205 · Hallandale Beach, FL
Flood risk No data
- FEMA flood zone
- —
- Chance of flooding over 30 yrs
- —
- Est. flood insurance / yr
- —
Fire risk No data
- Est. fire insurance / yr
- —
Heat risk No data
- Hot days now (above threshold)
- —
- Hot days in 30 yrs
- —
Wind risk No data
- Chance of severe wind over 30 yrs
- —
Air-quality risk No data
- Unhealthy air days now
- —
- Unhealthy air days in 30 yrs
- —
Risk factors via First Street. Map © Google.
Why this score? — see what drove the D grade
The composite is a weighted blend of 9 inputs, each scored 0–100. Each bar is that input's sub-score; the figure is the points it added to the 100-point composite (weight × sub-score).
- Cash flow +11.2/30.0
- ARV discount +7.5/15.0
- 1% rule +5.9/10.0
- Schools +4.1/10.0
- Livability +4.0/5.0
- DSCR +3.3/10.0
- Rent growth +2.6/5.0
- Condition / age +2.5/5.0
- Appreciation +0.0/10.0
$374,900
🖨 Deal sheet (PDF) 📄 Offer letter ✓ Due diligence
Listing remarks
New Price - Elevated Value - Premier Waterfront Living on the Intracoastal! Experience the ultimate South Florida lifestyle from this fully renovated, move-in-ready condo with unobstructed Intracoastal views in the heart of Hallandale Beach. This beautifully remodeled and thoughtfully updated home is offered turnkey. Flooded with natural light, it features an open-concept layout, an updated kitchen, granite countertops, and tastefully renovated bathrooms with contemporary finishes. Every detail has been upgraded, delivering a clean, sophisticated living experience. Step onto your private balcony and take in panoramic water views, glowing sunsets, and passing yachts — a daily reminder
Key facts
- Waterfront views
- Fitness center
- Private balcony
Tags
Property features AI
Finance
- Other: Heated pool
- Financial info: Pets not allowed
- HOA & community: Monthly association fee; Association fee includes management, amenities, cable TV, insurance, laundry, recreation facilities, reserve fund, roof, sewer and water; Association amenities: billiard room, community kitchen, fitness center, laundry, barbecue, picnic area, pool, storage, elevators
Exterior
- Parking: One assigned parking space
- Security: Key card entry
- Utilities: Has cooling (central air); Has heating (central)
- Home design: Condo/Apartment in a 15-story building; Waterfront building with Intracoastal access; Updated/remodeled; Second-floor entry
- Construction: Block construction; Resale property
- Exterior features: Balcony; Open balcony/patio; Security/high impact doors; Privacy wall; Exterior lighting
Interior
- Kitchen: Dishwasher; Electric range; Disposal; Icemaker; Microwave; Refrigerator
- Bedrooms: Bedroom on main level
- Flooring: Tile
- Bathrooms: 2 full bathrooms
- Heating & cooling: Central heating; Central air
- Interior features: Breakfast bar; Built-in features; Entrance foyer; First floor entry; Living/dining room; Walk-in closet(s); Closet cabinetry
- Laundry & utility: Common area laundry
Neighborhood map
What this means for you Summary
Snapshot
- This is a 2-bed/2.0-bath condo listed at $375k.
Deal economics
- At list price, monthly cash flow is $-145 ($-2k/yr) — negative.
- To cash-flow at today's rent, offer at most $349k (6.8% below list).
- Meets the 1% rule at list price ($4k rent vs $375k).
- Recommended offer: $341k (9.0% below list) — sets the bar for market timing.
Location & tenants
- Location reads 81/100 on livability (#86 in FL, #1,400 nationally) — a professional / high-income tenant draw. Strengths: commute A+, health & safety A+, crime B+; Watch: employment D-.
- Broward (suburban): math 42% / reading 53% proficiency, ranked #46 of 73 in FL (top 63%) — families likely to look elsewhere, expect single-tenant / working-renter base with shorter leases.
- Zoned schools: Gulfstream Academy of Hallandale Beach (math 32% / reading 40%, grade F, #1,670 of 2,144 statewide, top 78%, 1,317 students, 73% FRL); Nova Middle School (math 44% / reading 53%, grade C-, #274 of 571 statewide, top 50%, 1,284 students, 68% FRL); Nova High School (math 22% / reading 56%, grade F, #312 of 667 statewide, top 48%, 2,227 students, 59% FRL) — zoned schools average 67% FRL vs 51% district-wide (16 pts higher); higher-poverty schools than district average — tighter screening recommended.
- Market conditions: Rents flat; 1380 active listings in the ZIP; 40 comparable units currently listed for rent nearby; rentals at typical pace (median 19d on market — plan ~3-4 weeks tenant-placement turnaround); 2,111 units permitted in Broward County in 2024 (1,265 in 5+ unit buildings).
- At $4,091/mo this rent would consume 94% of the median local household income ($52k/yr) (locally 3293% of renters already pay >50% of income on rent) — very limited rent-growth headroom before tenants either downsize or default.
Forward outlook
- Local home prices are declining (-3.0%/yr); year-one equity from $3k of loan paydown is wiped out by about $11k of value loss. Plan a longer hold.
- Broward County population projected at +34% by 2050 — long-run rental-demand tailwind backs the buy-and-hold thesis.
Negotiation context
- It's been on market 92 days — a 9% lower offer ($341k) is reasonable based on typical stale-listing flexibility.
- 4 sale attempts since 2y ago; this cycle's ask has dropped $24k (6%) from the opening price — seller is motivated, your offer sets the floor, not the list.
- Current owner paid $260k; 44% above their basis — modest negotiation headroom, anchor on the comps not their cost.
Risks & watch-outs
- Watch-outs: HOA is 21% of rent.
Questions for the listing agent
- What do current leases actually rent for vs. the listed asking? Can we see a recent rent roll and the last 12 months of T-12 income?
- It's been on market 92 days. Have you received any prior offers? Is the seller open to a 9% concession, seller financing, or rate buy-down credit?
- Built in 1970 — when were the roof, HVAC, electrical panel, plumbing, and water heater last replaced?
- What does the HOA fee cover, when was the last increase, and are there any pending special assessments or reserve-fund shortfalls?
- Any open or pending special assessments — roof, HVAC, plumbing, elevator, façade? What's the per-unit balance and payoff schedule, and is the seller paying it off at close or rolling it to the buyer?
- Why hasn't it sold? Are there any deal-killer items the seller is aware of (foundation, flood, title, zoning, code violations)?
- Is there a deadline driving the sale (1031 exchange, divorce, estate, relocation)? That informs how much negotiation room exists.
- The area grade is low — what's the realistic commute time and amenity access for the typical tenant pool here? Any planned neighborhood developments (good or bad) we should know about?
- What's the average days-on-market for RENTAL listings here right now (not sales)? A rising rental-DOM trend means longer vacancies and softer asking-rent achievability than the comps imply.
- What's the recent tenant-quality profile in this submarket — average credit score on applications, eviction rate, late-payment / NSF rate, and stable-employment percentage? A property-management company in the area should have these aggregated.
- How much new apartment / multifamily construction is in the pipeline within 1–3 miles? Heavy new supply (>2% of stock underway) typically softens rents 12–24 months out; light construction supports rent growth.
Investment metrics
- 1% rule
- 1.09% ✓
- Cap rate
- 5.83%
- Cash-on-cash
- -1.66%
- DSCR
- 0.93
- GRM
- 7.6
CMA / ARV
No comps found within radius.
Projected returns pro-forma
-3.0% appreciation · 0.43% rent growth · sell at horizon
- IRR
- -22.7%
- Equity multiple
- 0.24×
- Total profit
- $-79,763
- Equity at exit
- $55,899
- IRR
- -29.1%
- Equity multiple
- -0.14×
- Total profit
- $-119,347
- Equity at exit
- $32,415
Cash invested: $104,972 (down + closing). Projections, not guarantees.
Landlord ↔ Tenant lean methodology
- Overall (STATE)
- 87 Strongly Landlord-Friendly
- State Florida
- 87 Strongly Landlord-Friendly · R+3
- County
- — inherits STATE
- City
- — inherits STATE
ZIP-level market 33009
- Rents YoY
- 0.4%
- Active inventory
- 1380
- Price-to-rent
- 7.6×
Monthly cashflow live
- Estimated rent
- $4,091 high interval (Pro) →
- Mortgage (P&I)
- −$1,966
- Tax from tax record
- −$400 /mo · $4,802/yr
- Insurance
- −$156
- HOA
- −$855
- Vacancy / Maint / Mgmt
- −$859
- Net cashflow
- $-145
Break-even live
Sensitivity live
| Price | -10% $67 | -5% $-39 | +0% $-145 | +5% $-251 | +10% $-357 |
|---|---|---|---|---|---|
| Rent | -10% $-468 | -5% $-307 | +0% $-145 | +5% $16 | +10% $178 |
| Rate | -1.0pp $44 | -0.5pp $-50 | base $-145 | +0.5pp $-242 | +1.0pp $-341 |
UW: 25.0% down · 7.5% · 30yr · 1.5% tax · 5.0% vac · 8.0% maint · 8.0% mgmt
Financing live
Cash to close
- Down payment
- $93,725
- Closing costs
- $11,247
- Reserves months
- —
- Total cash needed
- —
Loan-product check · same deal, 3 products live
Conventional
25% down · 7.5% · 30yr
- Down + closing
- —
- Monthly P&I
- —
- Monthly cashflow
- —
- DSCR
- —
- Eligible?
- —
Personal DTI + credit; lowest rate.
DSCR
20% down · 8.5% · 30yr
- Down + closing
- —
- Monthly P&I
- —
- Monthly cashflow
- —
- DSCR
- —
- Eligible?
- —
No personal income docs; deal must DSCR.
Hard money
10% down · 12.0% · 12mo
- Down + closing
- —
- Monthly P&I
- —
- Monthly cashflow
- —
- DSCR
- —
- Eligible?
- —
Short-term bridge; refi at stabilization.
Rent comps 40 comps
| Address | Beds | Baths | Sqft | Rent | $/sqft | DOM | Units | Dist |
|---|---|---|---|---|---|---|---|---|
| 121 Golden Isles Dr #1 Hallandale Beach, FL | 2.0 | 2.0 | 1379 | $4,000 | $2.90 | 26d | 1 | 0.03mi |
| 201 Golden Isles Dr #302 Hallandale Beach, FL | 2.0 | 2.0 | 1150 | $3,975 | $3.46 | 26d | 1 | 0.12mi |
| 1945 S Ocean Dr Hallandale Beach, FL | 2.0–3.0 | 2.0–2.5 | 1522 | $3,650 | $2.40 | 20d | 3 | 0.16mi |
| 1945 S Ocean Dr Hallandale Beach, FL | 2.0–3.0 | 2.0–3.0 | 1542 | $4,500 | $2.92 | 14d | 2 | 0.16mi |
| 1945 S Ocean Dr Hallandale Beach, FL | 2.0–3.0 | 2.0–3.0 | 1542 | $4,500 | $2.92 | 9d | 2 | 0.16mi |
| 1945 S Ocean Dr Hallandale Beach, FL | 2.0–3.0 | 2.0–3.0 | 1542 | $4,000 | $2.59 | 16d | 3 | 0.16mi |
| 1965 S Ocean Dr Unit 14F Hallandale Beach, FL | 2.0 | 2.0 | 1275 | $4,800 | $3.76 | 0d | 1 | 0.19mi |
| 1985 S Ocean Dr Unit 9G Hallandale Beach, FL | 2.0 | 2.0 | 1240 | $3,700 | $2.98 | 26d | 1 | 0.19mi |
| 1985 S Ocean Dr Unit 21P Hallandale Beach, FL | 2.0 | 2.0 | 1380 | $3,800 | $2.75 | 9d | 1 | 0.19mi |
| 1985 S Ocean Dr Unit 22P Hallandale Beach, FL | 2.0 | 2.0 | 1380 | $4,000 | $2.90 | 26d | 1 | 0.19mi |
| 1880 N Ocean Dr Unit TS705 Hallandale Beach, FL | 2.0 | 2.0 | 1350 | $4,900 | $3.63 | 16d | 1 | 0.24mi |
| 1880 N Ocean Dr Unit TS705 Hallandale Beach, FL | 2.0 | 2.0 | 1350 | $5,000 | $3.70 | 26d | 1 | 0.24mi |
| 1880 N Ocean Dr Unit TS705 Hallandale Beach, FL | 2.0 | 2.0 | 1350 | $5,000 | $3.70 | 18d | 1 | 0.24mi |
| 2017 S Ocean Dr #1107 Hallandale Beach, FL | 2.0 | 2.0 | 1270 | $3,900 | $3.07 | 15d | 1 | 0.24mi |
| 1904 S Ocean Dr #1707 Hallandale Beach, FL | 2.0 | 2.0 | 1350 | $5,000 | $3.70 | 26d | 1 | 0.26mi |
| 2602 E Hallandale Beach Blvd Unit 1227270P Hallandale Beach, FL | 2.0 | 1.0–2.0 | 640 | $4,219 | $6.59 | 0d | 3 | 0.26mi |
| 2602 E Hallandale Beach Blvd Hallandale Beach, FL | 1.0–2.0 | 1.0–2.0 | 1070 | $5,950 | $5.56 | 22d | 4 | 0.27mi |
| 2602 E Hallandale Beach Blvd Hallandale Beach, FL | 1.0–2.0 | 1.0–2.0 | 1092 | $5,950 | $5.45 | 26d | 3 | 0.27mi |
| 2600 E Hallandale Beach Blvd Unit T3208 Hallandale Beach, FL | 2.0 | 2.0 | 1030 | $6,950 | $6.75 | 26d | 1 | 0.27mi |
| 2600 E Hallandale Beach Blvd Unit T3307 Hallandale Beach, FL | 2.0 | 2.0 | 1030 | $4,500 | $4.37 | 26d | 1 | 0.27mi |
| 2600 E Hallandale Beach Blvd Unit T3110 Hallandale Beach, FL | 2.0 | 2.0 | 1028 | $3,650 | $3.55 | 26d | 1 | 0.27mi |
| 2601 E Hallandale Beach Blvd Unit 1227344P Hallandale Beach, FL | 1.0–2.0 | 1.0–2.0 | 844 | $4,219 | $5.00 | 3d | 2 | 0.28mi |
| 1950 S Ocean Dr Unit 12M Hallandale Beach, FL | 1.0 | 1.5 | 870 | $3,800 | $4.37 | 3d | 1 | 0.28mi |
| 1950 S Ocean Dr Unit 3D Hallandale Beach, FL | 1.0 | 1.5 | 870 | $3,950 | $4.54 | 14d | 1 | 0.28mi |
| 1950 S Ocean Dr Unit 3D Hallandale Beach, FL | 1.0 | 1.5 | 870 | $3,950 | $4.54 | 7d | 1 | 0.28mi |
| 1950 S Ocean Dr Unit 12M Hallandale Beach, FL | 1.0 | 1.5 | 870 | $3,800 | $4.37 | 19d | 1 | 0.28mi |
| 2069 S Ocean Dr Unit TH12 Hallandale Beach, FL | 3.0 | 3.0 | 1500 | $4,800 | $3.20 | 12d | 1 | 0.31mi |
| 2069 S Ocean Dr Unit TH12 Hallandale Beach, FL | 3.0 | 3.0 | 1500 | $4,800 | $3.20 | 26d | 1 | 0.31mi |
| 1850 S Ocean Dr #2909 Hallandale Beach, FL | 2.0 | 1.0 | 1086 | $4,050 | $3.73 | 26d | 1 | 0.32mi |
| 1850 S Ocean Dr #3509 Hallandale Beach, FL | 2.0 | 1.0 | 1086 | $4,300 | $3.96 | 26d | 1 | 0.32mi |
| 1850 S Ocean Dr #3509 Hallandale Beach, FL | 2.0 | 1.0 | 1086 | $4,000 | $3.68 | 5d | 1 | 0.32mi |
| 1850 S Ocean Dr #4009 Hallandale Beach, FL | 2.0 | 1.0 | 1086 | $3,900 | $3.59 | 26d | 1 | 0.32mi |
| 2030 S Ocean Dr Hallandale Beach, FL | 2.0 | 2.0 | 1280 | $4,800 | $3.75 | 4d | 7 | 0.34mi |
| 2030 S Ocean Dr Hallandale Beach, FL | 2.0 | 2.0 | 1280 | $4,825 | $3.77 | 26d | 9 | 0.34mi |
| 2030 S Ocean Dr Hallandale Beach, FL | 2.0 | 2.0 | 1280 | $4,775 | $3.73 | 4d | 8 | 0.34mi |
| 2030 S Ocean Dr Hallandale Beach, FL | 2.0 | 2.0 | 1280 | $4,750 | $3.71 | 4d | 9 | 0.34mi |
| 2030 S Ocean Dr Hallandale Beach, FL | 2.0 | 2.0 | 1280 | $4,850 | $3.79 | 6d | 7 | 0.34mi |
| 2721 E Hallandale Beach Blvd Unit 1049818P Hollywood, FL | 1.0–2.0 | 1.0–2.0 | 946 | $5,897 | $6.23 | 5d | 2 | 0.35mi |
| 1830 S Ocean Dr #1610 Hallandale Beach, FL | 2.0 | 2.0 | 1337 | $6,500 | $4.86 | 26d | 1 | 0.35mi |
| 1830 S Ocean Dr #4810 Hallandale Beach, FL | 2.0 | 2.0 | 1337 | $5,500 | $4.11 | 22d | 1 | 0.35mi |
HOA detail condo
- Monthly dues
- $855 · $10,260/yr
- Likely covers
- water
- Assessments
- None detected in remarks — confirm with the listing agent.
Listing history 36 events
-
2026-06-21days on market $374,900 Active 92 DOM
-
2026-06-18days on market $374,900 Active 89 DOM
-
2026-06-17days on market $374,900 Active 88 DOM
-
2026-06-16days on market $374,900 Active 87 DOM
-
2026-06-15days on market $374,900 Active 86 DOM
-
2026-06-13pricedays on market $374,900 Active 84 DOM
-
2026-06-09days on market $375,000 Active 80 DOM
-
2026-06-08days on market $375,000 Active 79 DOM
-
2026-06-07days on market $375,000 Active 78 DOM
-
2026-06-04days on market $375,000 Active 75 DOM
-
2026-06-03days on market $375,000 Active 74 DOM
-
2026-06-02days on market $375,000 Active 73 DOM
-
2026-06-01days on market $375,000 Active 72 DOM
-
2026-05-31days on market $375,000 Active 71 DOM
-
2026-05-08price $375,000
-
2026-03-21$399,000 Active
-
2026-03-21historical
-
2026-03-14price $395,000
-
2026-02-18price $399,000
-
2026-02-04price $410,000
-
2026-01-23price $415,000
-
2026-01-03price $420,000
-
2025-11-06$425,000 Active
-
2024-07-18historical $2,650
-
2024-07-18historical $2,650
-
2024-07-03price $2,650
-
2024-07-03price $2,250
-
2024-05-07price $2,825
-
2024-05-07price $2,400
-
2024-04-30price $2,850
-
2024-04-26price $2,450
-
2024-04-04price $2,875
-
2024-02-12$2,500
-
2024-02-12$2,900
-
2017-10-16soldstatus $260,000
-
1996-03-29soldstatus $82,000
ⓘ Source: listings_history table (triggers on properties + properties_extension) + one-shot
backfill from property_details.listing_events for pre-trigger history.
Tax reassessment forecast FL · Resets to sale price
- Current annual tax
- $4,802 · $400/mo
- Projected year-2 tax
- $4,802 · $400/mo
- Expected delta
- $0/yr ($0/mo · 0.0%)
ⓘ Screening estimate from a state-policy table — verify with the county assessor before closing.
Nearby sold comps map
Loading sold comps map…
Walkable amenities ~0.75 mi
Loading nearby amenities…
Taxation est. · year 1
- Rental income
- $49,097
- − Mortgage interest
- −$21,000
- − Property taxes
- −$4,802
- − Insurance
- −$1,874
- − Repairs & maintenance
- −$3,928
- − Management
- −$3,928
- − HOA
- −$10,260
- − Depreciation
- −$10,906
- Taxable loss
- −$7,601
- Est. tax savings @ 24.0%
- +$1,824
- After-tax cash flow
- $83/yr
For passive investors: Depreciation is non-cash, so a rental often shows a tax loss while cash-flowing — sheltering income. Rental losses are passive: they offset passive income freely, and up to $25,000/yr can offset ordinary (W-2) income if you actively participate and your MAGI is under $100k (phasing out to $0 by $150k); unused losses carry forward. On sale, claimed depreciation is recaptured at up to 25%, and gains may owe capital-gains tax (a 1031 exchange can defer both). Figures are a year-1 estimate at your 24.0% rate — not tax advice; consult a CPA.
Schools (NCES district)
- District
- Broward
- NCES district ID
- 1200180
- Math proficiency
- 42% ▼ -18.00%
- Reading proficiency
- 53% ▼ -5.00%
- Median HH income
- $52,139
- Composite
- 40.88/100
- National rank
- #3621
- State rank
- #46 of 73 in FL
Livability — Hallandale Beach
- Score
- 81/100
- State rank
- #86
- US rank
- #1400
Category grades
Schools grade is shown separately in the Schools card above.
Census & demographics
- Census place
- Hallandale Beach, FL
- County
- Broward County · 1,963,430 people
- City population
- 44,021
- Metro
- Miami-Fort Lauderdale-Pompano Beach, FL
- Population (ZIP)
- 44,502
- Household income
- $52,079
- Rent vs Own
- Severe rent burden
- 3293.0
Population outlook (Broward County) Hauer SSP2
- Today (2025)
- 2,207,033 people
- By 2030
- 2,360,704 · +7.0%
- By 2040
- 2,661,208 · +20.6%
- By 2050
- 2,946,698 · +33.5%
- By 2075
- 3,602,273 · +63.2%
- By 2100
- 3,970,984 · +79.9%
Race, ethnicity, and origin ACS 2023
- Neighborhood character
- Diverse neighborhood (Simpson 0.67)
- Race & ethnicity
- Hispanic / Latino 39% White 39% Two or more races 24% Black 17% Asian 1%
- Hispanic origin (detail)
- Mexican 2% Puerto Rican 3% Cuban 9% Dominican 3% Salvadoran 2%
- Common ancestry
- Scotch-Irish 5% Hispanic 5% Subsaharan African 3%
- Foreign-born
- 51% · Canada, Jamaica, Dominican Republic
- Languages at home
- 38% English-only · Spanish 36% Russian/Polish/Slavic 12% French/Haitian/Cajun 7%
Political lean MEDSL · Broward
- 2024 margin
- D (+17.0) · D 58.0% · R 41.0%
- 2008→2024 swing
- -17.8pp toward R · 2008: 34.7pp · 2024: 17.0pp
- All cycles
- 2024: D+17.0 2020: D+29.8 2016: D+35.0 2012: D+34.9 2008: D+34.7
Not yet ingested
- Civics
- —
Market trends
- HPI YoY
- ▼ -299.13%
- Current HPI
- 329.9081
- Rent YoY
- ▲ 0.43%
- Metro
- Miami-Fort Lauderdale-Pompano Beach, FL
- State GDP YoY
- ▲ 3.28%
- F500 in state
- 36
Industry mix (Fortune 500 HQ in FL)
| Industry | F500 HQs | Revenue |
|---|---|---|
| Industrial Technology | 2 | $29B |
|
||
| Insurance | 2 | $17B |
|
||
| Retail | 1 | $60B |
|
||
| Technology Distribution | 1 | $58B |
|
||
| Homebuilding | 1 | $35B |
|
||
| Technology Manufacturing | 1 | $35B |
|
||
Price history
+357.3% since first listed22 events — show timeline
- 2026-05-08 Price Changed $375,000 MARMLS
- 2026-03-21 Listing Removed — MARMLS
- 2026-03-21 Listed $399,000 MARMLS
- 2026-03-14 Price Changed $395,000 MARMLS
- 2026-02-18 Price Changed $399,000 MARMLS
- 2026-02-04 Price Changed $410,000 MARMLS
- 2026-01-23 Price Changed $415,000 MARMLS
- 2026-01-03 Price Changed $420,000 MARMLS
- 2025-11-06 Listed $425,000 MARMLS
- 2024-07-18 Rental Removed $2,650 MARMLS
- 2024-07-18 Rental Removed $2,650 MARMLS
- 2024-07-03 Price Changed $2,650 MARMLS
- 2024-07-03 Price Changed $2,250 MARMLS
- 2024-05-07 Price Changed $2,825 MARMLS
- 2024-05-07 Price Changed $2,400 MARMLS
- 2024-04-30 Price Changed $2,850 MARMLS
- 2024-04-26 Price Changed $2,450 MARMLS
- 2024-04-04 Price Changed $2,875 MARMLS
- 2024-02-12 Listed for Rent $2,500 MARMLS
- 2024-02-12 Listed for Rent $2,900 MARMLS
- 2017-10-16 Sold (Public Records) $260,000 Public Records
- 1996-03-29 Sold (Public Records) $82,000 Public Records
Property tax history
+13.0%/yrLatest (2025): $4,802 · +2.0% YoY. Source: county tax records.
Cash-flow waterfall
monthlySold comps — $/sqft
last 12 mo · ≤1 miLoading sold comps…