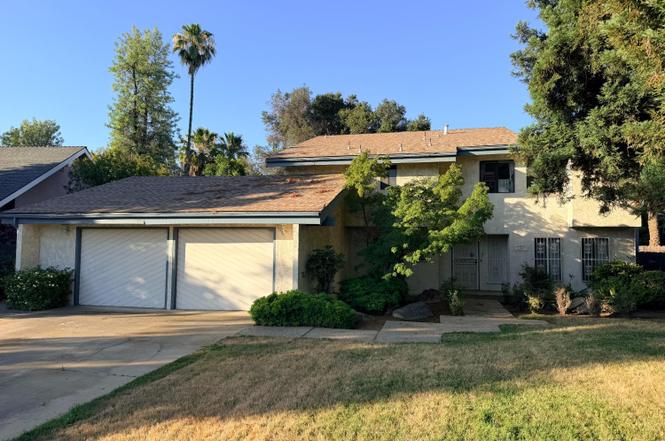
187 W Quincy Ave · Fresno, CA
Flood risk 1/10 · Minimal
- FEMA flood zone
- X (unshaded)
- Chance of flooding over 30 yrs
- 0.0%
- Est. flood insurance / yr
- $507 – $1,088
Fire risk 7/10 · Major
- Est. fire insurance / yr
- $659 – $1,223
Heat risk 8/10 · Major
- Hot days now (above 105°F)
- 7 days/yr
- Hot days in 30 yrs
- 17 days/yr
Wind risk 1/10 · Minimal
- Chance of severe wind over 30 yrs
- —
Air-quality risk 10/10 · Severe
- Unhealthy air days now
- 44 days/yr
- Unhealthy air days in 30 yrs
- 51 days/yr
Risk factors via First Street. Map © Google.
Why this score? — see what drove the B- grade
The composite is a weighted blend of 9 inputs, each scored 0–100. Each bar is that input's sub-score; the figure is the points it added to the 100-point composite (weight × sub-score).
- Cash flow +23.4/30.0
- ARV discount +15.0/15.0
- DSCR +7.5/10.0
- Schools +5.9/10.0
- 1% rule +5.1/10.0
- Rent growth +3.5/5.0
- Livability +3.1/5.0
- Condition / age +2.5/5.0
- Appreciation +0.0/10.0
$524,900
🖨 Deal sheet 📄 Offer letter ✓ Due diligence
Listing remarks MLS
Beautiful Woodward Park Custom 4 Bdrm, 3 Upstairs & 1 Down Would Make Nice Office. Mature Landscaping. Fenced Heated Pool & Spa Plus Large Patio & Lawn Area. Perfect For Large Active Family. Seller Is Very Motivated & Has Priced Under What Similar Homes In This Area Have Recently Sold For. Most Of The Inside Has Recently Been Repainted, Some New Fencing & A 4 Year Roof Certification Has Just Been Done. Please Be Courteous And Call Ahead Show 10:00 A.M. To 7:00 P.M.
Key facts
- Pool
- Mature landscaping
- Backyard patio area
Tags
Property features AI
Exterior
- Parking: 2-car garage
- Utilities: Public sewer; Public utilities; Electric service listed as off
- Home design: Single family residence
- Construction: Stucco exterior; Composition roof; Concrete foundation; Built with no solar panels
- Exterior features: Two-level property; Private in-ground pool with fencing; Front and rear sprinklers; Urban lot setting; Lot dimensions approximately 70 x 124
Interior
- Bathrooms: 2.25 bathrooms
- Heating & cooling: Central heating and air conditioning
- Interior features: Laundry located inside; Masonry fireplace (1)
- Laundry & utility: Inside laundry
Neighborhood map
What this means for you Summary
Snapshot
- This is a 3-bed/3.0-bath single-family listed at $525k.
Deal economics
- At list price, monthly cash flow is $969 ($12k/yr) — positive.
- The deal already cash-flows at list — no discount required.
- Meets the 1% rule at list price ($5k rent vs $525k).
- Cap rate 8.5% vs local median 3.7% in Fresno — top-decile yield for the area; either an underpriced asset or a hidden risk that comps aren't pricing in. Stress-test before assuming the spread holds.
Location & tenants
- Location reads 62/100 on livability (#469 in CA) — a middle-class / working-renter tenant base. Strengths: commute A+, housing A+; Watch: amenities D+, employment D+, crime F.
- Clovis Unified (suburban): math 58% / reading 72% proficiency, ranked #152 of 1,400 in CA (top 11%) — acceptable for families but not a draw, mixed tenant base, ~2y average lease.
- Zoned schools: Pinedale Elementary (488 students, 87% FRL); Kastner Intermediate (1,133 students, 56% FRL); Clovis West High (2,089 students, 44% FRL) — zoned schools average 62% FRL vs 32% district-wide (30 pts higher); higher-poverty schools than district average — tighter screening recommended.
- Market conditions: Rents rising fast (+4.0%/yr); 155 active listings in the ZIP; 3 comparable units currently listed for rent nearby; rentals at typical pace (median 24d on market — plan ~3-4 weeks tenant-placement turnaround); solid renter incomes; 2,426 units permitted in Fresno County in 2024 (296 in 5+ unit buildings).
- At $5,324/mo this rent would consume 61% of the median local household income ($104k/yr) (locally 1235% of renters already pay >50% of income on rent) — very limited rent-growth headroom before tenants either downsize or default.
Forward outlook
- Local home prices are declining (-3.0%/yr); year-one equity from $4k of loan paydown is wiped out by about $16k of value loss. Plan a longer hold.
- Fresno County population projected at +11% by 2050 — modest demand growth; plan on rents tracking national, not racing it.
Negotiation context
- Only 4 days on market — expect competitive offers; lowballing is unlikely to land.
- 2 sale attempts since 26y ago with the ask held roughly flat each time — persistent listings suggest the price (not the market) is what's stuck; bring a comps-based counter.
- Current owner paid $174k; list at $525k implies a 203% gain — meaningful room to come down on a strong offer.
Risks & watch-outs
- Climate carrying-cost: major wildfire risk; extreme-heat days projected 7→17/yr by 2055 (HVAC capex compounding) — expect insurance premiums to compound above CPI over the hold.
Questions for the listing agent
- Is there a deadline driving the sale (1031 exchange, divorce, estate, relocation)? That informs how much negotiation room exists.
- Schools are D-rated, which usually means shorter tenancies and higher turnover. Who's the typical renter profile here, and what's been the actual vacancy rate?
- Crime grade is F in this area — have there been break-ins, vandalism, or insurance claims at this property in the last 3 years? What carrier currently insures it and at what premium?
- What's the average days-on-market for RENTAL listings here right now (not sales)? A rising rental-DOM trend means longer vacancies and softer asking-rent achievability than the comps imply.
- What's the recent tenant-quality profile in this submarket — average credit score on applications, eviction rate, late-payment / NSF rate, and stable-employment percentage? A property-management company in the area should have these aggregated.
- How much new for-sale + rental construction is in the pipeline within 1–3 miles? Heavy new supply typically softens prices + rents 12–24 months out; constrained supply supports both.
Investment metrics
- 1% rule
- 1.01% ✓
- Cap rate
- 8.51%
- Cash-on-cash
- 7.91%
- DSCR
- 1.35
- GRM
- 8.2
CMA / ARV
- ARV (on-the-fly)
- $666,094
- Comps found
- 12
Show comp detail 12 sales within ~0.75 mi
| Address | Dist | Beds/Ba | Sqft | Sold | Price | $/sf | Match |
|---|---|---|---|---|---|---|---|
| 315 W Bluff Ave | 0.30mi | 4/3.0 (+1) | 2,272 (-2%) | 15mo | $670,000 | $295 | 65 |
| 203 W Brier Cir | 0.31mi | 3/3.0 | 2,244 (-4%) | 20mo | $630,000 | $281 | 63 |
| 8420 N Poplar Ave | 0.10mi | 3/2.0 | 2,100 (-10%) | 16mo | $600,000 | $286 | 62 |
| 409 W Audubon | 0.29mi | 3/2.0 | 2,197 (-6%) | 14mo | $685,000 | $312 | 61 |
| 8418 N Del Mar Ave | 0.08mi | 3/1.8 | 2,014 (-14%) | 13mo | $490,000 | $243 | 58 |
| 131 W Muncie Ave | 0.21mi | 4/4.0 (+1) | 2,461 (+6%) | 17mo | $585,000 | $238 | 58 |
| 131 W Muncie Ave | 0.21mi | 4/4.0 (+1) | 2,461 (+6%) | 17mo | $585,000 | $238 | 58 |
| 431 W Audubon Dr | 0.34mi | 3/2.2 | 2,249 (-3%) | 22mo | $675,000 | $300 | 57 |
| 104 E Audubon Dr | 0.69mi | 4/2.0 (+1) | 2,248 (-4%) | 14mo | $669,000 | $298 | 42 |
| 281 W Bluff Ave | 0.52mi | 3/2.5 | 2,558 (+10%) | 20mo | $895,000 | $350 | 40 |
| 8060 N Augusta St | 0.73mi | 3/2.8 | 2,008 (-14%) | 9mo | $460,000 | $229 | 35 |
| 8060 N Augusta St | 0.73mi | 3/2.0 | 2,008 (-14%) | 9mo | $460,000 | $229 | 31 |
Match score weights: distance 35% · size 25% · config 20% · recency 20%. Top-matched comps best support the ARV.
Projected returns pro-forma
-3.0% appreciation · 4.0% rent growth · sell at horizon
- IRR
- -3.2%
- Equity multiple
- 0.88×
- Total profit
- $-18,078
- Equity at exit
- $78,264
- IRR
- 7.4%
- Equity multiple
- 1.58×
- Total profit
- $85,751
- Equity at exit
- $45,384
Cash invested: $146,972 (down + closing). Projections, not guarantees.
Landlord ↔ Tenant lean methodology
- Overall (STATE)
- 18 Strongly Tenant-Friendly
- State California
- 18 Strongly Tenant-Friendly · D+13
- County
- — inherits STATE
- City
- — inherits STATE
ZIP-level market 93711
- Rents YoY
- 4.0%
- Active inventory
- 155
- Price-to-rent
- 8.2×
Monthly cashflow live
- Estimated rent
- $5,324 medium interval (Pro) →
- Mortgage (P&I)
- −$2,753
- Tax from tax record
- −$266 /mo · $3,189/yr
- Insurance
- −$219
- HOA
- −$0
- Vacancy / Maint / Mgmt
- −$1,118
- Net cashflow
- $969
Break-even live
UW: 25.0% down · 7.5% · 30yr · 1.5% tax · 5.0% vac · 8.0% maint · 8.0% mgmt
Financing live
Cash to close
- Down payment
- $131,225
- Closing costs
- $15,747
- Reserves months
- —
- Total cash needed
- —
Loan-product check · same deal, 3 products live
Conventional
25% down · 7.5% · 30yr
- Down + closing
- —
- Monthly P&I
- —
- Monthly cashflow
- —
- DSCR
- —
- Eligible?
- —
Personal DTI + credit; lowest rate.
DSCR
20% down · 8.5% · 30yr
- Down + closing
- —
- Monthly P&I
- —
- Monthly cashflow
- —
- DSCR
- —
- Eligible?
- —
No personal income docs; deal must DSCR.
Hard money
10% down · 12.0% · 12mo
- Down + closing
- —
- Monthly P&I
- —
- Monthly cashflow
- —
- DSCR
- —
- Eligible?
- —
Short-term bridge; refi at stabilization.
Rent comps 3 comps
| Address | Beds | Baths | Sqft | Rent | $/sqft | DOM | Units | Dist |
|---|---|---|---|---|---|---|---|---|
| 8476 N Del Mar Ave Fresno, CA | 4.0 | 2.0 | 1797 | $10,000 | $5.56 | 24d | 1 | 0.15mi |
| 227 W Teague Ave Fresno, CA | 3.0 | 2.0 | 1894 | $2,950 | $1.56 | 44d | 1 | 0.18mi |
| 8109 N 5th St Fresno, CA | 3.0 | 2.0 | 1750 | $2,350 | $1.34 | 3d | 1 | 1.36mi |
Listing history 5 events
-
2026-06-18days on market $524,900 Active 4 DOM
-
2026-06-17days on market $524,900 Active 3 DOM
-
2026-06-16days on market $524,900 Active 2 DOM
-
2026-06-15remarks 699-char remark
-
2026-06-15$524,900 Active 1 DOM
ⓘ Source: listings_history table (triggers on properties + properties_extension) + one-shot
backfill from property_details.listing_events for pre-trigger history.
Tax reassessment forecast CA · Resets to sale price
- Current annual tax
- $3,189 · $266/mo
- Projected year-2 tax
- $3,989 · $332/mo
- Expected delta
- +$801/yr (+$67/mo · 25.1%)
ⓘ Screening estimate from a state-policy table — verify with the county assessor before closing.
Climate risk First Street
- Flood 1/10 Low FEMA zone X (unshaded) · 0% chance over 30 yrs
- Wildfire 7/10 Severe
- Heat 8/10 Severe 7 d/yr ≥105°F today · 17 d/yr by 30 yrs out
- Wind 1/10 Low
- Air quality 10/10 Extreme 44 unhealthy d/yr today · 51 by 30 yrs out
Nearby sold comps map
Loading sold comps map…
Walkable amenities ~0.75 mi
Loading nearby amenities…
Taxation est. · year 1
- Rental income
- $63,892
- − Mortgage interest
- −$29,403
- − Property taxes
- −$3,189
- − Insurance
- −$2,624
- − Repairs & maintenance
- −$5,111
- − Management
- −$5,111
- − Depreciation
- −$15,270
- Taxable income
- $3,184
- Est. tax owed @ 24.0%
- −$764
- After-tax cash flow
- $10,866/yr
For passive investors: Depreciation is non-cash, so a rental often shows a tax loss while cash-flowing — sheltering income. Rental losses are passive: they offset passive income freely, and up to $25,000/yr can offset ordinary (W-2) income if you actively participate and your MAGI is under $100k (phasing out to $0 by $150k); unused losses carry forward. On sale, claimed depreciation is recaptured at up to 25%, and gains may owe capital-gains tax (a 1031 exchange can defer both). Figures are a year-1 estimate at your 24.0% rate — not tax advice; consult a CPA.
Schools (NCES district)
- District
- Clovis Unified
- NCES district ID
- 0609030
- Math proficiency
- 58% ▲ 1.00%
- Reading proficiency
- 72% ▲ 2.00%
- Median HH income
- $71,950
- Composite
- 58.7/100
- National rank
- #2003
- State rank
- #152 of 1400 in CA
Livability — Fresno
- Score
- 62/100
- State rank
- #469
- US rank
- #15907
Category grades
Schools grade is shown separately in the Schools card above.
Census & demographics
- Census place
- Fresno, CA
- County
- Fresno County · 834,801 people
- City population
- 593,114
- Metro
- Fresno, CA
- Population (ZIP)
- 39,245
- Household income
- $104,176
- Rent vs Own
- Severe rent burden
- 1235.0
Population outlook (Fresno County) Hauer SSP2
- Today (2025)
- 1,042,971 people
- By 2030
- 1,072,198 · +2.8%
- By 2040
- 1,122,408 · +7.6%
- By 2050
- 1,157,251 · +11.0%
- By 2075
- 1,182,575 · +13.4%
- By 2100
- 1,105,899 · +6.0%
Race, ethnicity, and origin ACS 2023
- Neighborhood character
- Diverse neighborhood (Simpson 0.64)
- Race & ethnicity
- White 52% Hispanic / Latino 28% Two or more races 16% Asian 9% Black 5%
- Hispanic origin (detail)
- Mexican 25%
- Common ancestry
- Lithuanian 3% Russian 2% Slovak 1%
- Foreign-born
- 12% · Canada, Vietnam
- Languages at home
- 76% English-only · Spanish 11% Other Indo-European 6% Other Asian/Pacific 3%
Political lean MEDSL · Fresno
- 2024 margin
- Toss-up / Even · D 46.5% · R 50.9% · Other 2.6%
- 2008→2024 swing
- -6.5pp toward R · 2008: 2.1pp · 2024: -4.4pp
- All cycles
- 2024: R+4.4 2020: D+7.8 2016: D+3.9 2012: R+2.9 2008: D+2.1
Not yet ingested
- Civics
- —
Market trends
- HPI YoY
- ▼ -353.07%
- Current HPI
- 301.849
- Rent YoY
- ▲ 4.00%
- Metro
- Fresno, CA
- State GDP YoY
- ▲ 3.21%
- F500 in state
- 116
Industry mix (Fortune 500 HQ in CA)
| Industry | F500 HQs | Revenue |
|---|---|---|
| Technology | 27 | $1,492B |
|
||
| Financial Services | 3 | $174B |
|
||
| Retail | 3 | $44B |
|
||
| Insurance | 3 | $26B |
|
||
| Media / Entertainment | 2 | $115B |
|
||
| Pharmaceuticals / Biotech | 2 | $62B |
|
||
Price history
+319.9% since first listed8 events — show timeline
- 2026-06-12 Listed $524,900 FRESNOMLS
- 2000-11-17 Sold (Public Records) $173,500 Public Records
- 2000-10-11 Delisted — FRESNOMLS
- 2000-10-11 Price Changed $178,900 FRESNOMLS
- 2000-08-08 Listed $173,500 FRESNOMLS
- 2000-01-07 Sold (MLS) $173,500 FRESNOMLS
- 1994-08-22 Sold (Public Records) $158,000 Public Records
- 1987-04-01 Sold (Public Records) $125,000 Public Records
Property tax history
+2.2%/yrLatest (2025): $3,189 · +1.9% YoY. Source: county tax records.
Cash-flow waterfall
monthlySold comps — $/sqft
last 12 mo · ≤1 miLoading sold comps…