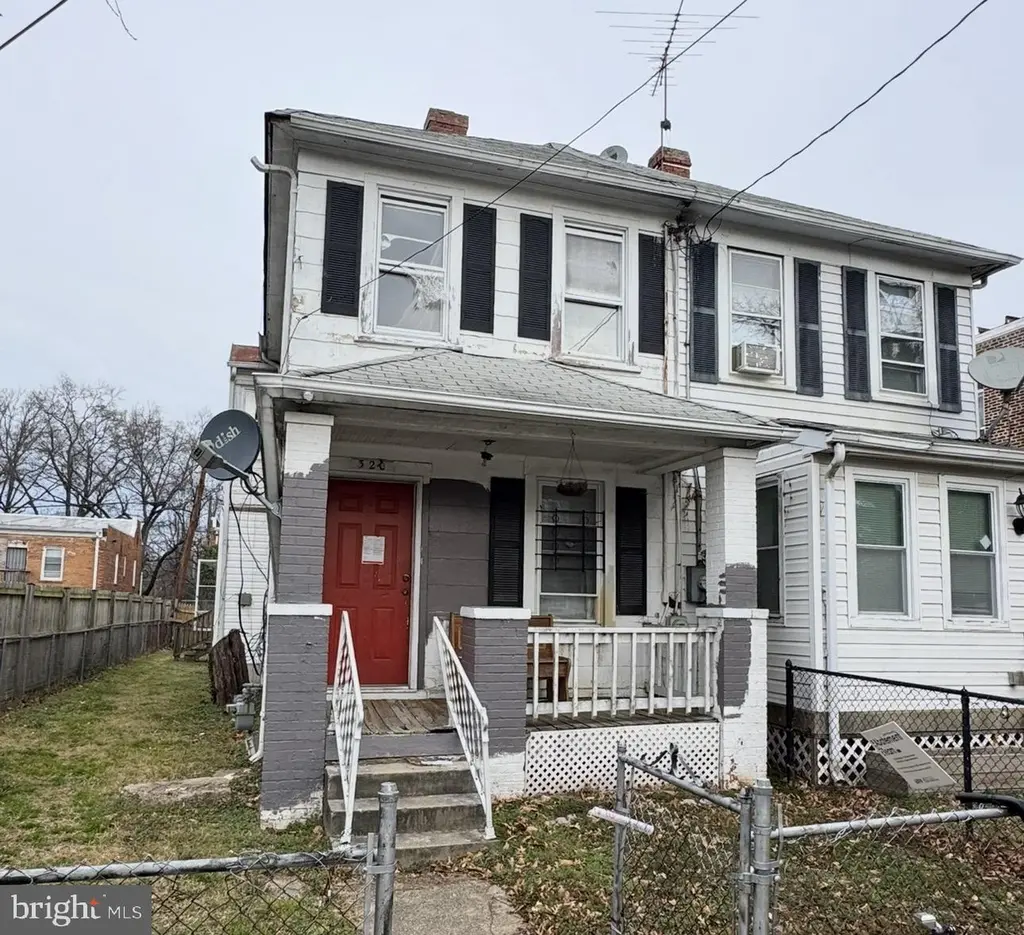
320 Raleigh St SE · Washington, DC
Flood risk 1/10 · Minimal
- FEMA flood zone
- X (unshaded)
- Chance of flooding over 30 yrs
- 0.0%
- Est. flood insurance / yr
- $507 – $1,088
Fire risk 1/10 · Minimal
- Est. fire insurance / yr
- $631 – $1,173
Heat risk 7/10 · Major
- Hot days now (above 104°F)
- 7 days/yr
- Hot days in 30 yrs
- 14 days/yr
Wind risk 4/10 · Minor
- Chance of severe wind over 30 yrs
- 20.0%
Air-quality risk 3/10 · Minor
- Unhealthy air days now
- 2 days/yr
- Unhealthy air days in 30 yrs
- 3 days/yr
Risk factors via First Street. Map © Google.
Why this score? — see what drove the C+ grade
The composite is a weighted blend of 9 inputs, each scored 0–100. Each bar is that input's sub-score; the figure is the points it added to the 100-point composite (weight × sub-score).
- Cash flow +27.2/30.0
- DSCR +9.5/10.0
- ARV discount +7.5/15.0
- 1% rule +7.4/10.0
- Livability +3.7/5.0
- Schools +3.6/10.0
- Rent growth +3.5/5.0
- Condition / age +2.5/5.0
- Appreciation +0.0/10.0
$195,000
🖨 Deal sheet (PDF) 📄 Offer letter ✓ Due diligence
Listing remarks
Please call me to discuss
Key facts
- Built 1925
Neighborhood map
What this means for you Summary
Snapshot
- This is a 3-bed/1.0-bath single-family listed at $195k.
Deal economics
- At list price, monthly cash flow is $561 ($7k/yr) — positive.
- The deal already cash-flows at list — no discount required.
- Meets the 1% rule at list price ($2k rent vs $195k).
- Cap rate 9.7% vs local median 2.5% in Washington — top-decile yield for the area; either an underpriced asset or a hidden risk that comps aren't pricing in. Stress-test before assuming the spread holds.
Location & tenants
- Location reads 73/100 on livability (#1 in DC) — a middle-class / working-renter tenant base. Strengths: amenities A+, commute A+, employment A+; Watch: crime F, cost of living F.
- District Of Columbia Public Schools (urban): math 33% / reading 40% proficiency, ranked #8 of 32 in DC (top 25%) — families likely to look elsewhere, expect single-tenant / working-renter base with shorter leases; 65% free/reduced lunch — lower-income household profile, screen leases tightly.
- Zoned schools: Capitol Hill Montessori School At Logan (424 students, 0% FRL); Hart Ms (386 students, 0% FRL); Ballou Hs (657 students, 0% FRL) — zoned schools average 0% FRL vs 65% district-wide (65 pts lower); this property's tenant base skews higher-income than the district average.
- Market conditions: Rents rising (+4.0%/yr); 148 active listings in the ZIP; 40 comparable units currently listed for rent nearby; rentals at typical pace (median 24d on market — plan ~3-4 weeks tenant-placement turnaround); 1,737 units permitted in District of Columbia in 2024 (1,506 in 5+ unit buildings).
- At $2,416/mo this rent would consume 59% of the median local household income ($49k/yr) (locally 4530% of renters already pay >50% of income on rent) — very limited rent-growth headroom before tenants either downsize or default.
Forward outlook
- Local home prices are declining (-3.0%/yr); year-one equity from $1k of loan paydown is wiped out by about $6k of value loss. Plan a longer hold.
- District of Columbia County population projected at +50% by 2050 — long-run rental-demand tailwind backs the buy-and-hold thesis.
- At projected returns (-3.0% appreciation + 4.0% rent growth), your $55k cash investment doubles in ~9 years — after that, you're playing with house money.
Negotiation context
- Only 1 days on market — expect competitive offers; lowballing is unlikely to land.
- 3 sale attempts since 28y ago; this cycle's ask has dropped $45k (19%) from the opening price — seller is motivated, your offer sets the floor, not the list.
- Current owner paid $90k; list at $195k implies a 117% gain — meaningful room to come down on a strong offer.
Risks & watch-outs
- Watch-outs: built in 1925 — expect roof / HVAC / electrical / plumbing capex.
- Climate carrying-cost: extreme-heat days projected 7→14/yr by 2055 (HVAC capex compounding) — expect insurance premiums to compound above CPI over the hold.
Questions for the listing agent
- Built in 1925 — when were the roof, HVAC, electrical panel, plumbing, and water heater last replaced?
- Is there a deadline driving the sale (1031 exchange, divorce, estate, relocation)? That informs how much negotiation room exists.
- Crime grade is F in this area — have there been break-ins, vandalism, or insurance claims at this property in the last 3 years? What carrier currently insures it and at what premium?
- What's the average days-on-market for RENTAL listings here right now (not sales)? A rising rental-DOM trend means longer vacancies and softer asking-rent achievability than the comps imply.
- What's the recent tenant-quality profile in this submarket — average credit score on applications, eviction rate, late-payment / NSF rate, and stable-employment percentage? A property-management company in the area should have these aggregated.
- How much new for-sale + rental construction is in the pipeline within 1–3 miles? Heavy new supply typically softens prices + rents 12–24 months out; constrained supply supports both.
Investment metrics
- 1% rule
- 1.24% ✓
- Cap rate
- 9.74%
- Cash-on-cash
- 12.32%
- DSCR
- 1.55
- GRM
- 6.7
CMA / ARV
- ARV (on-the-fly)
- $445,578
- Comps found
- 4
Show comp detail 4 sales within ~0.75 mi
| Address | Dist | Beds/Ba | Sqft | Sold | Price | $/sf | Match |
|---|---|---|---|---|---|---|---|
| 3013 5th St SE | 0.14mi | 3/1.0 | 1,550 (+8%) | 4mo | $249,000 | $161 | 77 |
| 1009 Congress St SE | 0.57mi | 4/1.0 (+1) | 1,618 (+12%) | 3mo | $289,000 | $179 | 45 |
| 3020 7th St SE | 0.29mi | 4/3.0 (+1) | 1,598 (+11%) | 14mo | $570,000 | $357 | 44 |
| 910 Savannah St SE | 0.47mi | 4/3.5 (+1) | 1,344 (-7%) | 13mo | $415,000 | $309 | 41 |
Match score weights: distance 35% · size 25% · config 20% · recency 20%. Top-matched comps best support the ARV.
Projected returns pro-forma
-3.0% appreciation · 3.96% rent growth · sell at horizon
- IRR
- 3.1%
- Equity multiple
- 1.12×
- Total profit
- $6,503
- Equity at exit
- $29,075
- IRR
- 13.5%
- Equity multiple
- 2.13×
- Total profit
- $61,649
- Equity at exit
- $16,860
Cash invested: $54,600 (down + closing). Projections, not guarantees.
Landlord ↔ Tenant lean methodology
- Overall (CITY)
- 0 Strongly Tenant-Friendly
- State District of Columbia
- 12 Strongly Tenant-Friendly · D+43
- County
- — inherits STATE
- City Washington
- 0 Strongly Tenant-Friendly · D+43
ZIP-level market 20032
- Home prices YoY
- -15.6%
- Rents YoY
- 4.0%
- Active inventory
- 148
- Price-to-rent
- 6.7×
Monthly cashflow live
- Estimated rent
- $2,416 high interval (Pro) →
- Mortgage (P&I)
- −$1,023
- Tax est. 1.5%
- −$244 /mo · $2,925/yr
- Insurance
- −$81
- HOA
- −$0
- Lot rent
- −$0
- Vacancy / Maint / Mgmt
- −$507
- Net cashflow
- $561
Break-even live
Sensitivity live
| Price | -10% $695 | -5% $628 | +0% $561 | +5% $493 | +10% $426 |
|---|---|---|---|---|---|
| Rent | -10% $370 | -5% $465 | +0% $561 | +5% $656 | +10% $752 |
| Rate | -1.0pp $659 | -0.5pp $610 | base $561 | +0.5pp $510 | +1.0pp $459 |
UW: 25.0% down · 7.5% · 30yr · 1.5% tax · 5.0% vac · 8.0% maint · 8.0% mgmt
Financing live
Cash to close
- Down payment
- $48,750
- Closing costs
- $5,850
- Reserves months
- —
- Total cash needed
- —
Loan-product check · same deal, 3 products live
Conventional
25% down · 7.5% · 30yr
- Down + closing
- —
- Monthly P&I
- —
- Monthly cashflow
- —
- DSCR
- —
- Eligible?
- —
Personal DTI + credit; lowest rate.
DSCR
20% down · 8.5% · 30yr
- Down + closing
- —
- Monthly P&I
- —
- Monthly cashflow
- —
- DSCR
- —
- Eligible?
- —
No personal income docs; deal must DSCR.
Hard money
10% down · 12.0% · 12mo
- Down + closing
- —
- Monthly P&I
- —
- Monthly cashflow
- —
- DSCR
- —
- Eligible?
- —
Short-term bridge; refi at stabilization.
Rent comps 40 comps
| Address | Beds | Baths | Sqft | Rent | $/sqft | DOM | Units | Dist |
|---|---|---|---|---|---|---|---|---|
| 349 Parkland Pl SE Unit B Washington, DC | 4.0 | 2.0 | 1400 | $2,500 | $1.79 | 22d | 1 | 0.09mi |
| 349 Parkland Pl SE Unit A Washington, DC | 4.0 | 2.0 | 1400 | $2,500 | $1.79 | 26d | 1 | 0.09mi |
| 3013 5th St SE Washington, DC | 3.0 | 1.0 | 1550 | $7,150 | $4.61 | 1d | 1 | 0.16mi |
| 425 Oakwood St SE Unit 425 Washington, DC | 3.0 | 2.5 | 1008 | $3,500 | $3.47 | 26d | 1 | 0.22mi |
| 615 Malcolm X Ave SE Unit F Washington, DC | 3.0 | 1.0 | 1100 | $2,508 | $2.28 | 5d | 1 | 0.23mi |
| 446 Mellon St SE #2 Washington, DC | 2.0 | 1.0 | 928 | $2,400 | $2.59 | 17d | 1 | 0.26mi |
| 2942 2nd St SE Washington, DC | 1.0–2.0 | 1.0–2.0 | 762 | $1,539 | $2.02 | 1d | 10 | 0.29mi |
| 3320 6th St SE Washington, DC | 2.0 | 1.0 | 690 | $1,398 | $2.03 | 5d | 25 | 0.32mi |
| 407 Lebaum St SE Unit 4 Washington, DC | 2.0 | 1.0 | 1192 | $2,100 | $1.76 | 26d | 1 | 0.32mi |
| 3210 8th St SE #1 Washington, DC | 2.0 | 2.0 | 1106 | $2,395 | $2.17 | 26d | 1 | 0.33mi |
| 2913 8th St SE #3101 Washington, DC | 2.0 | 2.0 | 1100 | $2,400 | $2.18 | 16d | 1 | 0.34mi |
| 3517 Brothers Pl SE Washington, DC | 2.0 | 1.0 | 900 | $1,595 | $1.77 | 26d | 1 | 0.36mi |
| 802 Malcolm X Ave SE Washington, DC | 4.0 | 1.0 | 1140 | $3,150 | $2.76 | 26d | 1 | 0.37mi |
| 742 Congress St SE Washington, DC | 3.0 | 2.5 | 1744 | $3,000 | $1.72 | 19d | 1 | 0.41mi |
| 150 Upsal St SE Washington, DC | 2.0 | 3.0 | 1695 | $3,200 | $1.89 | 26d | 1 | 0.42mi |
| 945 Sycamore Dr SE Washington, DC | 4.0 | 3.5 | 1612 | $3,800 | $2.36 | 1d | 1 | 0.48mi |
| 1201 Oak Dr SE Washington, DC | 3.0 | 1.0–2.0 | 892 | $1,921 | $2.15 | 0d | 33 | 0.53mi |
| 1216 Savannah Pl SE Washington, DC | 3.0 | 1.0 | 887 | $2,100 | $2.37 | 1d | 1 | 0.62mi |
| 101 Wayne Pl SE Washington, DC | 2.0 | 1.0 | 919 | $1,695 | $1.84 | 24d | 1 | 0.63mi |
| 10 Halley Pl SE Washington, DC | 2.0–3.0 | 1.0 | 906 | $2,400 | $2.65 | 26d | 3 | 0.66mi |
| 3325 13th St SE Apt 12 Washington, DC | 3.0 | 1.0 | 901 | $2,500 | $2.77 | 26d | 1 | 0.67mi |
| 3325 13th St SE Apt 1 Washington, DC | 3.0 | 1.0 | 902 | $2,500 | $2.77 | 4d | 1 | 0.67mi |
| 147 Mississippi Ave SE Washington, DC | 4.0 | 2.0 | 1459 | $2,795 | $1.92 | 24d | 1 | 0.71mi |
| 1121 Varney St SE Washington, DC | 3.0 | 3.5 | 1400 | $3,000 | $2.14 | 26d | 1 | 0.87mi |
| 306 Atlantic St SE Unit 7 Washington, DC | 2.0 | 1.0 | 989 | $1,699 | $1.72 | 20d | 1 | 0.88mi |
| 3930 1st St SE Unit 301 Washington, DC | 3.0 | 1.0 | 900 | $2,200 | $2.44 | 26d | 1 | 0.90mi |
| 4001 S Capitol St SW Washington, DC | 3.0 | 1.0–2.0 | 782 | $2,557 | $3.27 | 16d | 1 | 0.96mi |
| 3281 15th Pl SE Washington, DC | 3.0 | 1.0 | 1012 | $1,750 | $1.73 | 10d | 1 | 0.99mi |
| 3275 15th Pl SE #101 Washington, DC | 3.0 | 1.0 | 984 | $2,250 | $2.29 | 26d | 1 | 0.99mi |
| 4030 Livingston Rd SE Washington, DC | 2.0 | 1.0 | 1000 | $1,648 | $1.65 | 26d | 1 | 0.99mi |
| 4040 Livingston Rd SE Washington, DC | 2.0 | 1.0 | 1000 | $1,256 | $1.26 | 26d | 1 | 1.01mi |
| 2609 Douglass Rd SE #402 Washington, DC | 2.0 | 2.0 | 990 | $2,200 | $2.22 | 26d | 1 | 1.01mi |
| 3243 15th Pl SE Washington, DC | 2.0 | 2.0 | 1248 | $2,400 | $1.92 | 1d | 1 | 1.02mi |
| 864 Bellevue St SE Unit 1 Washington, DC | 2.0 | 1.0 | 1628 | $1,700 | $1.04 | 26d | 1 | 1.03mi |
| 911 Bellevue St SE Washington, DC | 4.0 | 2.0 | 1820 | $3,400 | $1.87 | 26d | 1 | 1.05mi |
| 2629 Douglass Rd SE Washington, DC | 2.0–3.0 | 1.0–1.5 | 888 | $2,245 | $2.53 | 3d | 13 | 1.09mi |
| 2460 James Bank Rd SE Washington, DC | 3.0 | 3.5 | 1687 | $3,190 | $1.89 | 17d | 1 | 1.10mi |
| 4281 S Capitol St SW Washington, DC | 3.0 | 3.5 | 1412 | $2,900 | $2.05 | 26d | 1 | 1.16mi |
| 4285 S Capitol St SW Washington, DC | 3.0 | 3.5 | 1152 | $3,500 | $3.04 | 17d | 1 | 1.16mi |
| 4287 S Capitol St SW Washington, DC | 2.0 | 3.5 | 1412 | $2,575 | $1.82 | 26d | 1 | 1.17mi |
Listing history 12 events
-
2026-04-13price $195,000
-
2026-03-25status Pending
-
2026-03-25$240,000 Active
-
2026-03-25price $240,000
-
2002-08-12soldstatus $90,000
-
2001-08-03soldstatus $90,000
-
2001-05-31historical
-
2000-08-03$83,500
-
1999-12-31soldstatus $34,900
-
1999-06-09historical
-
1998-11-13$34,900
-
1983-07-21soldstatus $47,000
ⓘ Source: listings_history table (triggers on properties + properties_extension) + one-shot
backfill from property_details.listing_events for pre-trigger history.
Climate risk First Street
- Flood 1/10 Low FEMA zone X (unshaded) · 0% chance over 30 yrs
- Wildfire 1/10 Low
- Heat 7/10 Severe 7 d/yr ≥104°F today · 14 d/yr by 30 yrs out
- Wind 4/10 Moderate 20% chance of damaging wind over 30 yrs
- Air quality 3/10 Moderate 2 unhealthy d/yr today · 3 by 30 yrs out
Nearby sold comps map
Loading sold comps map…
Walkable amenities ~0.75 mi
Loading nearby amenities…
Taxation est. · year 1
- Rental income
- $28,986
- − Mortgage interest
- −$10,923
- − Property taxes
- −$2,925
- − Insurance
- −$975
- − Repairs & maintenance
- −$2,319
- − Management
- −$2,319
- − Depreciation
- −$5,673
- Taxable income
- $3,853
- Est. tax owed @ 24.0%
- −$925
- After-tax cash flow
- $5,803/yr
For passive investors: Depreciation is non-cash, so a rental often shows a tax loss while cash-flowing — sheltering income. Rental losses are passive: they offset passive income freely, and up to $25,000/yr can offset ordinary (W-2) income if you actively participate and your MAGI is under $100k (phasing out to $0 by $150k); unused losses carry forward. On sale, claimed depreciation is recaptured at up to 25%, and gains may owe capital-gains tax (a 1031 exchange can defer both). Figures are a year-1 estimate at your 24.0% rate — not tax advice; consult a CPA.
Schools (NCES district)
- District
- District Of Columbia Public Schools
- NCES district ID
- 1100030
- Math proficiency
- 33% ▲ 3.00%
- Reading proficiency
- 40% ▲ 5.00%
- Median HH income
- $67,671
- Composite
- 35.84/100
- National rank
- #9606
- State rank
- #8 of 32 in DC
Livability — Washington
- Score
- 73/100
- State rank
- #1
- US rank
- #5327
Category grades
Schools grade is shown separately in the Schools card above.
Census & demographics
- Census place
- Washington, DC
- County
- District of Columbia · 671,873 people
- City population
- 671,873
- Metro
- Washington-Arlington-Alexandria, DC-VA-MD-WV
- Population (ZIP)
- 40,920
- Household income
- $49,139
- Rent vs Own
- Severe rent burden
- 4530.0
Population outlook (District of Columbia County) Hauer SSP2
- Today (2025)
- 821,926 people
- By 2030
- 899,517 · +9.4%
- By 2040
- 1,061,162 · +29.1%
- By 2050
- 1,231,493 · +49.8%
- By 2075
- 1,603,312 · +95.1%
- By 2100
- 1,847,141 · +124.7%
Race, ethnicity, and origin ACS 2023
- Neighborhood character
- Predominantly Black (80%)
- Race & ethnicity
- Black 80% White 8% Two or more races 7% Hispanic / Latino 5%
- Foreign-born
- 4% · Canada
- Languages at home
- 95% English-only · Spanish 3%
Political lean MEDSL · District of Columbia
- 2024 margin
- Solid D (+86.1) · D 91.2% · R 5.1% · Other 3.8%
- 2008→2024 swing
- +0.1pp no change · 2008: 85.9pp · 2024: 86.1pp
- All cycles
- 2024: D+86.1 2020: D+86.8 2016: D+88.7 2012: D+84.2 2008: D+85.9
Not yet ingested
- Civics
- —
Market trends
- HPI YoY
- ▼ -60.34%
- Current HPI
- 326.4077
- Rent YoY
- ▲ 3.96%
- Metro
- Washington-Arlington-Alexandria, DC-VA-MD-WV
- State GDP YoY
- ▲ 1.33%
- F500 in state
- 6
Industry mix (Fortune 500 HQ in DC)
| Industry | F500 HQs | Revenue |
|---|---|---|
| Financial Services | 1 | $153B |
|
||
| Life Sciences / Industrials | 1 | $25B |
|
||
| Industrial Machinery | 1 | $8B |
|
||
Price history
+314.9% since first listed12 events — show timeline
- 2026-04-13 Price Changed $195,000 BRIGHT MLS
- 2026-03-25 Pending — BRIGHT MLS
- 2026-03-25 Price Changed $240,000 BRIGHT MLS
- 2026-03-25 Listed $240,000 BRIGHT MLS
- 2002-08-12 Sold (Public Records) $90,000 Public Records
- 2001-08-03 Sold (MLS) $90,000 MRIS
- 2001-05-31 Delisted — MRIS
- 2000-08-03 Listed $83,500 MRIS
- 1999-12-31 Sold (MLS) $34,900 MRIS
- 1999-06-09 Delisted — MRIS
- 1998-11-13 Listed $34,900 MRIS
- 1983-07-21 Sold (Public Records) $47,000 Public Records
Property tax history
+26.7%/yrLatest (2025): $14,801 · +3.8% YoY. Source: county tax records.
Cash-flow waterfall
monthlySold comps — $/sqft
last 12 mo · ≤1 miLoading sold comps…