429 Chestnut St · Maury City, TN
Flood risk 1/10 · Minimal
- FEMA flood zone
- X (unshaded)
- Chance of flooding over 30 yrs
- 0.0%
- Est. flood insurance / yr
- $473 – $860
Fire risk 1/10 · Minimal
- Est. fire insurance / yr
- $949 – $1,763
Heat risk 6/10 · Moderate
- Hot days now (above 108°F)
- 7 days/yr
- Hot days in 30 yrs
- 20 days/yr
Wind risk 4/10 · Minor
- Chance of severe wind over 30 yrs
- 13.0%
Air-quality risk 2/10 · Minimal
- Unhealthy air days now
- 0 days/yr
- Unhealthy air days in 30 yrs
- 1 days/yr
Risk factors via First Street. Map © Google.
Why this score? — see what drove the B+ grade
The composite is a weighted blend of 9 inputs, each scored 0–100. Each bar is that input's sub-score; the figure is the points it added to the 100-point composite (weight × sub-score).
- Cash flow +30.0/30.0
- 1% rule +10.0/10.0
- DSCR +10.0/10.0
- Appreciation +10.0/10.0
- ARV discount +7.5/15.0
- Livability +2.9/5.0
- Schools +2.6/10.0
- Rent growth +2.5/5.0
- Condition / age +2.5/5.0
$29,900
🖨 Deal sheet 📄 Offer letter ✓ Due diligence
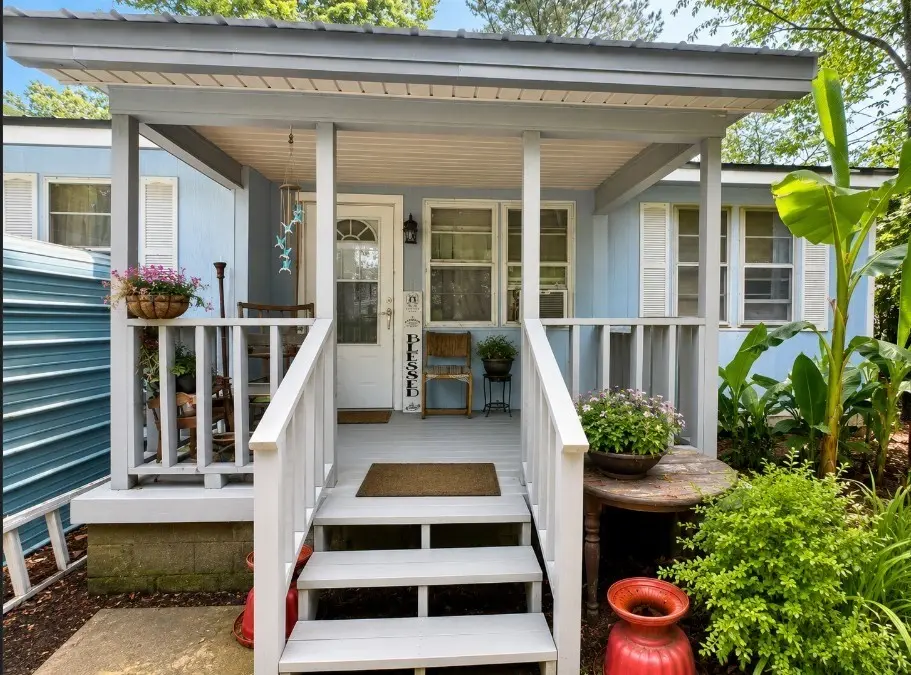
Listing remarks
Affordable opportunity in the heart of Friendship, TN! Whether you're looking to renovate and create a home that reflects your own style or simply secure a residential lot at an attractive price point, 429 Chestnut Street offers plenty of potential. Conveniently located close to Highway 412, this property is a great option for investors, builders, or buyers ready to bring their vision to life.
Key facts
- 0.26 acre lot
- 2 parking spots
- Built 1960
Property features AI
Exterior
- Parking: Attached carport with 2 covered spaces (total 2 parking spaces)
- Utilities: Public water; Public sewer; Natural gas available
- Home design: Residential mobile home; Single-story
- Construction: Vinyl siding; Existing construction; One level
- Exterior features: Lot approximately 0.26 acres; Lot dimensions about 45 x 240 (irregular)
Interior
- Kitchen: Oven
- Bedrooms: 3 bedrooms (all on the main level)
- Flooring: Tile
- Bathrooms: 2 full bathrooms
- Heating & cooling: Natural gas heating; Wall/window cooling units
- Interior features: Oven; Tile flooring
- Laundry & utility: Natural gas available
Neighborhood map
What this means for you Summary
Snapshot
- This is a 3-bed/1.0-bath manufactured listed at $30k.
Deal economics
- At list price, monthly cash flow is $599 ($7k/yr) — positive.
- The deal already cash-flows at list — no discount required.
- Meets the 1% rule at list price ($992 rent vs $30k).
Location & tenants
- Location reads 58/100 on livability (#300 in TN) — a working-class tenant base; expect higher turnover. Strengths: cost of living A+, housing A+; Watch: health & safety C-, employment D+, crime F.
- Crockett County (rural): math 31% / reading 32% proficiency, ranked #48 of 139 in TN (top 34%) — families likely to look elsewhere, expect single-tenant / working-renter base with shorter leases.
- Zoned schools: Maury City Elementary (math 47% / reading 37%, grade F, #191 of 952 statewide, top 22%, 230 students, 0% FRL); Crockett County High School (math 8% / reading 37%, grade F, #153 of 332 statewide, top 47%, 888 students, 0% FRL) — zoned schools average 0% FRL vs 59% district-wide (59 pts lower); this property's tenant base skews higher-income than the district average.
- Market conditions: 20 active listings in the ZIP; 26 units permitted in Crockett County in 2024 (0 in 5+ unit buildings).
Forward outlook
- In year one you build about $3k of equity ($207 loan paydown + $3k appreciation (10.0% local appreciation)).
- At projected returns (10.0% appreciation + 3.0% rent growth), your $8k cash investment doubles in ~1 year — after that, you're playing with house money.
- By year 9, paydown + projected appreciation supports a ~$33k cash-out refi (75% LTV) — recoverable capital for the next deal without selling this one.
Negotiation context
- Only 13 days on market — expect competitive offers; lowballing is unlikely to land.
Risks & watch-outs
- Climate carrying-cost: extreme-heat days projected 7→20/yr by 2055 (HVAC capex compounding) — expect insurance premiums to compound above CPI over the hold.
Questions for the listing agent
- Built in 1960 — when were the roof, HVAC, electrical panel, plumbing, and water heater last replaced?
- Is there a deadline driving the sale (1031 exchange, divorce, estate, relocation)? That informs how much negotiation room exists.
- Schools are F-rated, which usually means shorter tenancies and higher turnover. Who's the typical renter profile here, and what's been the actual vacancy rate?
- Crime grade is F in this area — have there been break-ins, vandalism, or insurance claims at this property in the last 3 years? What carrier currently insures it and at what premium?
- What's the average days-on-market for RENTAL listings here right now (not sales)? A rising rental-DOM trend means longer vacancies and softer asking-rent achievability than the comps imply.
- What's the recent tenant-quality profile in this submarket — average credit score on applications, eviction rate, late-payment / NSF rate, and stable-employment percentage? A property-management company in the area should have these aggregated.
- How much new for-sale + rental construction is in the pipeline within 1–3 miles? Heavy new supply typically softens prices + rents 12–24 months out; constrained supply supports both.
Investment metrics
- 1% rule
- 3.32% ✓
- Cap rate
- 30.33%
- Cash-on-cash
- 85.85%
- DSCR
- 4.82
- GRM
- 2.5
CMA / ARV
No comps found within radius.
Projected returns pro-forma
10.0% appreciation · 3.0% rent growth · sell at horizon
- IRR
- 95.3%
- Equity multiple
- 7.50×
- Total profit
- $54,435
- Equity at exit
- $26,936
- IRR
- 90.3%
- Equity multiple
- 16.56×
- Total profit
- $130,305
- Equity at exit
- $58,089
Cash invested: $8,372 (down + closing). Projections, not guarantees.
Landlord ↔ Tenant lean methodology
- Overall (STATE)
- 87 Strongly Landlord-Friendly
- State Tennessee
- 87 Strongly Landlord-Friendly · R+13
- County
- — inherits STATE
- City
- — inherits STATE
ZIP-level market 38034
- Home prices YoY
- 5.3%
- Active inventory
- 20
- Price-to-rent
- 2.5×
Monthly cashflow live
- Estimated rent
- $992 medium interval (Pro) →
- Mortgage (P&I)
- −$157
- Tax from tax record
- −$16 /mo · $190/yr
- Insurance
- −$12
- HOA
- −$0
- Vacancy / Maint / Mgmt
- −$208
- Net cashflow
- $599
Break-even live
UW: 25.0% down · 7.5% · 30yr · 1.5% tax · 5.0% vac · 8.0% maint · 8.0% mgmt
Financing live
Cash to close
- Down payment
- $7,475
- Closing costs
- $897
- Reserves months
- —
- Total cash needed
- —
Loan-product check · same deal, 3 products live
Conventional
25% down · 7.5% · 30yr
- Down + closing
- —
- Monthly P&I
- —
- Monthly cashflow
- —
- DSCR
- —
- Eligible?
- —
Personal DTI + credit; lowest rate.
DSCR
20% down · 8.5% · 30yr
- Down + closing
- —
- Monthly P&I
- —
- Monthly cashflow
- —
- DSCR
- —
- Eligible?
- —
No personal income docs; deal must DSCR.
Hard money
10% down · 12.0% · 12mo
- Down + closing
- —
- Monthly P&I
- —
- Monthly cashflow
- —
- DSCR
- —
- Eligible?
- —
Short-term bridge; refi at stabilization.
Listing history 12 events
-
2026-06-18days on market $29,900 Active 13 DOM
-
2026-06-17days on market $29,900 Active 12 DOM
-
2026-06-16days on market $29,900 Active 11 DOM
-
2026-06-16price $29,900 Active 10 DOM
-
2026-06-15days on market $39,900 Active 10 DOM
-
2026-06-13days on market $39,900 Active 8 DOM
-
2026-06-12days on market $39,900 Active 7 DOM
-
2026-06-09pricedays on market $39,900 Active 4 DOM
-
2026-06-08days on market $49,900 Active 3 DOM
-
2026-06-08days on market $49,900 Active 2 DOM
-
2026-06-07remarks 396-char remark
-
2026-06-07$49,900 Active 1 DOM
ⓘ Source: listings_history table (triggers on properties + properties_extension) + one-shot
backfill from property_details.listing_events for pre-trigger history.
Tax reassessment forecast TN · Resets to sale price
- Current annual tax
- $190 · $16/mo
- Projected year-2 tax
- $212 · $18/mo
- Expected delta
- +$22/yr (+$2/mo · 11.7%)
ⓘ Screening estimate from a state-policy table — verify with the county assessor before closing.
Climate risk First Street
- Flood 1/10 Low FEMA zone X (unshaded) · 0% chance over 30 yrs
- Wildfire 1/10 Low
- Heat 6/10 Major 7 d/yr ≥108°F today · 20 d/yr by 30 yrs out
- Wind 4/10 Moderate 13% chance of damaging wind over 30 yrs
- Air quality 2/10 Low 0 unhealthy d/yr today · 1 by 30 yrs out
Nearby sold comps map
Loading sold comps map…
Walkable amenities ~0.75 mi
Loading nearby amenities…
Taxation est. · year 1
- Rental income
- $11,910
- − Mortgage interest
- −$1,675
- − Property taxes
- −$190
- − Insurance
- −$150
- − Repairs & maintenance
- −$953
- − Management
- −$953
- − Depreciation
- −$870
- Taxable income
- $7,120
- Est. tax owed @ 24.0%
- −$1,709
- After-tax cash flow
- $5,479/yr
For passive investors: Depreciation is non-cash, so a rental often shows a tax loss while cash-flowing — sheltering income. Rental losses are passive: they offset passive income freely, and up to $25,000/yr can offset ordinary (W-2) income if you actively participate and your MAGI is under $100k (phasing out to $0 by $150k); unused losses carry forward. On sale, claimed depreciation is recaptured at up to 25%, and gains may owe capital-gains tax (a 1031 exchange can defer both). Figures are a year-1 estimate at your 24.0% rate — not tax advice; consult a CPA.
Schools (NCES district)
- District
- Crockett County
- NCES district ID
- 4700850
- Math proficiency
- 31% ▼ -10.00%
- Reading proficiency
- 32% ▲ 3.00%
- Median HH income
- $36,758
- Composite
- 26.19/100
- National rank
- #7266
- State rank
- #48 of 139 in TN
Livability — Maury City
- Score
- 58/100
- State rank
- #300
- US rank
- #20660
Category grades
Schools grade is shown separately in the Schools card above.
Census & demographics
- Census place
- Maury City, TN
- City population
- 425
- Population (ZIP)
- 3,366
Population outlook (Crockett County) Hauer SSP2
- Today (2025)
- 14,795 people
- By 2030
- 14,812 · +0.1%
- By 2040
- 14,811 · +0.1%
- By 2050
- 14,809 · +0.1%
- By 2075
- 15,405 · +4.1%
- By 2100
- 16,200 · +9.5%
Race, ethnicity, and origin ACS 2023
- Neighborhood character
- Predominantly White (76%)
- Race & ethnicity
- White 76% Two or more races 9% Black 8% Hispanic / Latino 6%
- Hispanic origin (detail)
- Mexican 5%
- Common ancestry
- Lithuanian 5% Italian 3% Iranian 3%
- Foreign-born
- 4% · Canada
- Languages at home
- 94% English-only · Spanish 5%
Political lean MEDSL · Crockett
- 2024 margin
- Solid R (+58.7) · D 20.2% · R 78.9%
- 2008→2024 swing
- -25.2pp toward R · 2008: -33.6pp · 2024: -58.7pp
- All cycles
- 2024: R+58.7 2020: R+53.8 2016: R+49.7 2012: R+38.4 2008: R+33.6
Not yet ingested
- Civics
- —
Market trends
- HPI YoY
- ▲ 13.00%
- Current HPI
- 257.4293
- Rent YoY
- —
- Metro
- —
- State GDP YoY
- ▲ 2.78%
- F500 in state
- 22
Industry mix (Fortune 500 HQ in TN)
| Industry | F500 HQs | Revenue |
|---|---|---|
| Healthcare | 3 | $91B |
|
||
| Retail | 3 | $72B |
|
||
| Transportation / Logistics | 1 | $88B |
|
||
| Paper / Packaging | 1 | $19B |
|
||
| Insurance | 1 | $13B |
|
||
| Energy | 1 | $12B |
|
||
Price history
1 event — show timeline
- 2026-06-06 Listed $49,900 REALTRACS as Distributed by MLS Grid
Property tax history
+2.7%/yrLatest (2025): $190 · +13.1% YoY. Source: county tax records.
Cash-flow waterfall
monthlySold comps — $/sqft
last 12 mo · ≤1 miLoading sold comps…