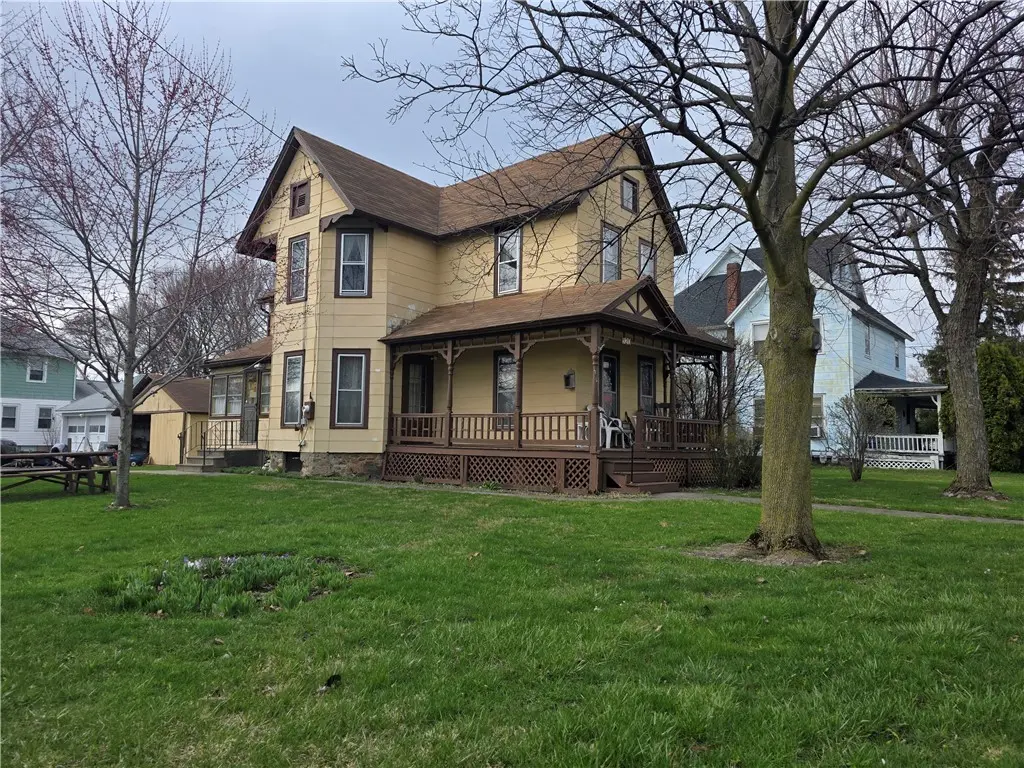
920 N Main St · Newark, NY
Flood risk No data
- FEMA flood zone
- —
- Chance of flooding over 30 yrs
- —
- Est. flood insurance / yr
- —
Fire risk No data
- Est. fire insurance / yr
- —
Heat risk No data
- Hot days now (above threshold)
- —
- Hot days in 30 yrs
- —
Wind risk No data
- Chance of severe wind over 30 yrs
- —
Air-quality risk No data
- Unhealthy air days now
- —
- Unhealthy air days in 30 yrs
- —
Risk factors via First Street. Map © Google.
Why this score? — see what drove the B+ grade
The composite is a weighted blend of 9 inputs, each scored 0–100. Each bar is that input's sub-score; the figure is the points it added to the 100-point composite (weight × sub-score).
- Cash flow +29.2/30.0
- ARV discount +15.0/15.0
- DSCR +10.0/10.0
- 1% rule +9.0/10.0
- Livability +3.6/5.0
- Schools +3.4/10.0
- Rent growth +2.5/5.0
- Condition / age +2.5/5.0
- Appreciation +0.0/10.0
$112,500
🖨 Deal sheet 📄 Offer letter ✓ Due diligence
Listing remarks
Welcome to this charming and well-maintained home located at 920 North Main Street in Newark. Mechanically sound and thoughtfully updated, this property features a newer high-efficiency Goodman gas furnace, a 150-amp breaker panel with updated wiring, and a high-efficiency gas hot water heater. The home is fully insulated for comfort and efficiency, with blown-in insulation in the walls, foam insulation in both the attic and basement, and a professionally waterproofed and insulated basement. Full of character, the home boasts a beautiful wraparound front porch and a bright, south-facing enclosed entry porch that leads directly into the kitchen, complete with a convenient walk-in pantr
Key facts
- Blown in insulation
- Updated wiring
- Foam insulation
Tags
Property features AI
Exterior
- Parking: Detached 2-car garage; Driveway; Garage with electricity
- Utilities: Public water connected; Sewer connected; High-speed internet available; Cable available; Electric on circuit breakers
- Home design: Two-story house; Existing/resale property
- Construction: Asphalt shingle roof; Composite siding; Attic/crawl hatchway(s) insulated; Blown-in and spray foam insulation; Copper plumbing; Stone foundation
- Exterior features: Enclosed porch; Open porch; Porch; Gravel driveway; Corner lot; Rectangular residential lot; Agricultural zoning; City street frontage; Lot dimensions approximately 70 x 110
Interior
- Kitchen: Gas oven and gas range; Refrigerator; Walk-in pantry; Eat-in kitchen
- Bedrooms: One bedroom on the main level
- Flooring: Carpet; Hardwood; Vinyl; Varies
- Bathrooms: One full bathroom
- Heating & cooling: Gas forced-air heating
- Interior features: Ceiling fan(s); Separate/formal dining room; Eat-in kitchen; Separate/formal living room; Walk-in pantry; Natural woodwork; Programmable thermostat; Storm windows with wood frames; Has basement with exterior entry, full height, walk-up access and sump pump
- Laundry & utility: Washer and dryer; Main level laundry; Gas water heater
Neighborhood map
What this means for you Summary
Snapshot
- This is a 3-bed/1.0-bath single-family listed at $112k.
Deal economics
- At list price, monthly cash flow is $392 ($5k/yr) — positive.
- The deal already cash-flows at list — no discount required.
- Meets the 1% rule at list price ($2k rent vs $112k).
- Cap rate 10.5% vs local median 5.0% in Newark — top-decile yield for the area; either an underpriced asset or a hidden risk that comps aren't pricing in. Stress-test before assuming the spread holds.
Location & tenants
- Location reads 71/100 on livability (#405 in NY) — a middle-class / working-renter tenant base. Strengths: cost of living A+, housing A+, commute B; Watch: schools D+, employment D+, crime F.
- Newark Central School District (town): math 33% / reading 46% proficiency, ranked #527 of 590 in NY (top 89%) — families likely to look elsewhere, expect single-tenant / working-renter base with shorter leases.
- Market conditions: 44 active listings in the ZIP; 259 units permitted in Wayne County in 2024 (90 in 5+ unit buildings).
Forward outlook
- Local home prices are declining (-3.0%/yr); year-one equity from $778 of loan paydown is wiped out by about $3k of value loss. Plan a longer hold.
- Wayne County population projected at -24% by 2050 — secular population decline; favor cash flow + early exit over multi-decade hold.
- At projected returns (-3.0% appreciation + 3.0% rent growth), your $32k cash investment doubles in ~8 years — after that, you're playing with house money.
Negotiation context
- Only 9 days on market — expect competitive offers; lowballing is unlikely to land.
Risks & watch-outs
- Watch-outs: built in 1890 — expect roof / HVAC / electrical / plumbing capex.
Questions for the listing agent
- Built in 1890 — when were the roof, HVAC, electrical panel, plumbing, and water heater last replaced?
- Is there a deadline driving the sale (1031 exchange, divorce, estate, relocation)? That informs how much negotiation room exists.
- Schools are D-rated, which usually means shorter tenancies and higher turnover. Who's the typical renter profile here, and what's been the actual vacancy rate?
- Crime grade is F in this area — have there been break-ins, vandalism, or insurance claims at this property in the last 3 years? What carrier currently insures it and at what premium?
- What's the average days-on-market for RENTAL listings here right now (not sales)? A rising rental-DOM trend means longer vacancies and softer asking-rent achievability than the comps imply.
- What's the recent tenant-quality profile in this submarket — average credit score on applications, eviction rate, late-payment / NSF rate, and stable-employment percentage? A property-management company in the area should have these aggregated.
- How much new for-sale + rental construction is in the pipeline within 1–3 miles? Heavy new supply typically softens prices + rents 12–24 months out; constrained supply supports both.
Investment metrics
- 1% rule
- 1.40% ✓
- Cap rate
- 10.47%
- Cash-on-cash
- 14.92%
- DSCR
- 1.66
- GRM
- 5.9
CMA / ARV
- ARV (on-the-fly)
- $197,024
- Comps found
- 11
Show comp detail 11 sales within ~0.75 mi
| Address | Dist | Beds/Ba | Sqft | Sold | Price | $/sf | Match |
|---|---|---|---|---|---|---|---|
| 454 Murray St | 0.22mi | 3/1.5 | 1,528 (+2%) | 14mo | $60,000 | $39 | 73 |
| 162 Bryant Ave | 0.23mi | 3/1.0 | 1,624 (+8%) | 6mo | $219,000 | $135 | 71 |
| 209 Cooper St | 0.50mi | 3/2.0 | 1,446 (-4%) | 1mo | $192,500 | $133 | 65 |
| 115 Ford St | 0.37mi | 3/1.0 | 1,344 (-11%) | 7mo | $100,000 | $74 | 59 |
| 130 Frey St | 0.16mi | 3/2.0 | 1,286 (-14%) | 11mo | $173,000 | $135 | 55 |
| 154 Mcdermott St | 0.21mi | 3/1.5 | 1,344 (-11%) | 23mo | $205,000 | $153 | 51 |
| 121 W Sherman Ave | 0.41mi | 3/1.5 | 1,622 (+8%) | 18mo | $190,000 | $117 | 51 |
| 132 Willow Ave | 0.49mi | 4/2.0 (+1) | 1,540 (+2%) | 18mo | $168,600 | $109 | 49 |
| 215 Blackmar St | 0.47mi | 4/1.5 (+1) | 1,662 (+10%) | 13mo | $45,000 | $27 | 43 |
| 140 W Sherman Ave | 0.44mi | 4/2.5 (+1) | 1,616 (+7%) | 19mo | $212,000 | $131 | 40 |
| 141 W Pearl St | 0.40mi | 4/2.0 (+1) | 1,716 (+14%) | 10mo | $225,000 | $131 | 40 |
Match score weights: distance 35% · size 25% · config 20% · recency 20%. Top-matched comps best support the ARV.
Projected returns pro-forma
-3.0% appreciation · 3.0% rent growth · sell at horizon
- IRR
- 5.5%
- Equity multiple
- 1.22×
- Total profit
- $6,785
- Equity at exit
- $16,774
- IRR
- 15.0%
- Equity multiple
- 2.22×
- Total profit
- $38,315
- Equity at exit
- $9,727
Cash invested: $31,500 (down + closing). Projections, not guarantees.
Landlord ↔ Tenant lean methodology
- Overall (STATE)
- 15 Strongly Tenant-Friendly
- State New York
- 15 Strongly Tenant-Friendly · D+10
- County
- — inherits STATE
- City
- — inherits STATE
ZIP-level market 14513
- Home prices YoY
- -16.7%
- Active inventory
- 44
- Price-to-rent
- 5.9×
Monthly cashflow live
- Estimated rent
- $1,576 medium interval (Pro) →
- Mortgage (P&I)
- −$590
- Tax from tax record
- −$217 /mo · $2,603/yr
- Insurance
- −$47
- HOA
- −$0
- Vacancy / Maint / Mgmt
- −$331
- Net cashflow
- $392
Break-even live
UW: 25.0% down · 7.5% · 30yr · 1.5% tax · 5.0% vac · 8.0% maint · 8.0% mgmt
Financing live
Cash to close
- Down payment
- $28,125
- Closing costs
- $3,375
- Reserves months
- —
- Total cash needed
- —
Loan-product check · same deal, 3 products live
Conventional
25% down · 7.5% · 30yr
- Down + closing
- —
- Monthly P&I
- —
- Monthly cashflow
- —
- DSCR
- —
- Eligible?
- —
Personal DTI + credit; lowest rate.
DSCR
20% down · 8.5% · 30yr
- Down + closing
- —
- Monthly P&I
- —
- Monthly cashflow
- —
- DSCR
- —
- Eligible?
- —
No personal income docs; deal must DSCR.
Hard money
10% down · 12.0% · 12mo
- Down + closing
- —
- Monthly P&I
- —
- Monthly cashflow
- —
- DSCR
- —
- Eligible?
- —
Short-term bridge; refi at stabilization.
Listing history 2 events
-
2026-04-16status Pending
-
2026-04-07$112,500 Active
ⓘ Source: listings_history table (triggers on properties + properties_extension) + one-shot
backfill from property_details.listing_events for pre-trigger history.
Tax reassessment forecast NY · Partial reset (capped growth)
- Current annual tax
- $2,603 · $217/mo
- Projected year-2 tax
- $2,603 · $217/mo
- Expected delta
- $0/yr ($0/mo · 0.0%)
ⓘ Screening estimate from a state-policy table — verify with the county assessor before closing.
Nearby sold comps map
Loading sold comps map…
Walkable amenities ~0.75 mi
Loading nearby amenities…
Taxation est. · year 1
- Rental income
- $18,917
- − Mortgage interest
- −$6,302
- − Property taxes
- −$2,603
- − Insurance
- −$562
- − Repairs & maintenance
- −$1,513
- − Management
- −$1,513
- − Depreciation
- −$3,273
- Taxable income
- $3,151
- Est. tax owed @ 24.0%
- −$756
- After-tax cash flow
- $3,944/yr
For passive investors: Depreciation is non-cash, so a rental often shows a tax loss while cash-flowing — sheltering income. Rental losses are passive: they offset passive income freely, and up to $25,000/yr can offset ordinary (W-2) income if you actively participate and your MAGI is under $100k (phasing out to $0 by $150k); unused losses carry forward. On sale, claimed depreciation is recaptured at up to 25%, and gains may owe capital-gains tax (a 1031 exchange can defer both). Figures are a year-1 estimate at your 24.0% rate — not tax advice; consult a CPA.
Schools (NCES district)
- District
- Newark Central School District
- NCES district ID
- 3620640
- Math proficiency
- 33% ▲ 2.00%
- Reading proficiency
- 46% ▲ 15.00%
- Median HH income
- $44,966
- Composite
- 33.55/100
- National rank
- #5428
- State rank
- #527 of 590 in NY
Livability — Newark
- Score
- 71/100
- State rank
- #405
- US rank
- #6978
Category grades
Schools grade is shown separately in the Schools card above.
Census & demographics
- Census place
- Newark, NY
- Population (ZIP)
- 13,501
Population outlook (Wayne County) Hauer SSP2
- Today (2025)
- 85,662 people
- By 2030
- 81,945 · -4.3%
- By 2040
- 73,735 · -13.9%
- By 2050
- 65,029 · -24.1%
- By 2075
- 47,451 · -44.6%
- By 2100
- 31,574 · -63.1%
Race, ethnicity, and origin ACS 2023
- Neighborhood character
- Predominantly White (80%)
- Race & ethnicity
- White 80% Hispanic / Latino 12% Two or more races 10% Black 3% Native American 1%
- Hispanic origin (detail)
- Puerto Rican 5%
- Common ancestry
- Iranian 13% Lithuanian 2% Romanian 2%
- Foreign-born
- 4% · Canada, Vietnam
- Languages at home
- 92% English-only · Spanish 7%
Political lean MEDSL · Wayne
- 2024 margin
- Strong R (+23.1) · D 38.5% · R 61.5%
- 2008→2024 swing
- -13.2pp toward R · 2008: -9.9pp · 2024: -23.1pp
- All cycles
- 2024: R+23.1 2020: R+19.6 2016: R+26.1 2012: R+9.3 2008: R+9.9
Not yet ingested
- Civics
- —
Market trends
- HPI YoY
- ▼ -50.98%
- Current HPI
- 253.627
- Rent YoY
- —
- Metro
- —
- State GDP YoY
- ▲ 2.60%
- F500 in state
- 92
Industry mix (Fortune 500 HQ in NY)
| Industry | F500 HQs | Revenue |
|---|---|---|
| Financial Services | 10 | $950B |
|
||
| Consumer Goods | 9 | $162B |
|
||
| Insurance | 4 | $225B |
|
||
| Telecommunications | 2 | $144B |
|
||
| Pharmaceuticals | 2 | $112B |
|
||
| Media / Entertainment | 2 | $69B |
|
||
Price history
2 events — show timeline
- 2026-04-16 Pending — UNYREIS
- 2026-04-07 Listed $112,500 UNYREIS
Property tax history
+4.0%/yrLatest (2025): $2,603 · -7.8% YoY. Source: county tax records.
Cash-flow waterfall
monthlySold comps — $/sqft
last 12 mo · ≤1 miLoading sold comps…