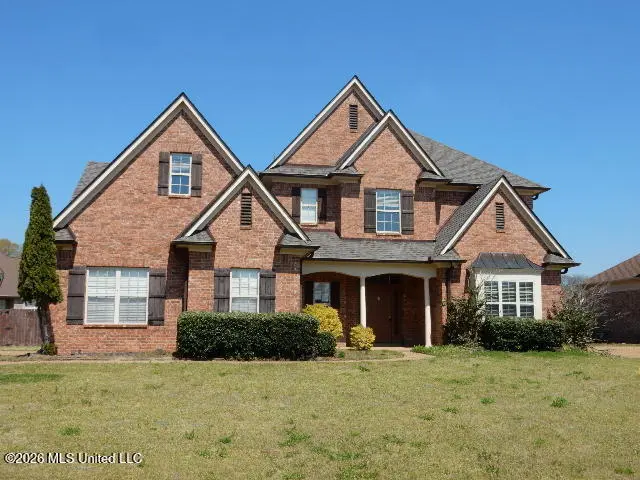
4860 Wedgewood Dr · Olive Branch, MS
Flood risk 1/10 · Minimal
- FEMA flood zone
- X (unshaded)
- Chance of flooding over 30 yrs
- 0.0%
- Est. flood insurance / yr
- $507 – $1,088
Fire risk 3/10 · Minor
- Est. fire insurance / yr
- $1,241 – $2,305
Heat risk 7/10 · Major
- Hot days now (above 109°F)
- 7 days/yr
- Hot days in 30 yrs
- 22 days/yr
Wind risk 4/10 · Minor
- Chance of severe wind over 30 yrs
- 20.0%
Air-quality risk 2/10 · Minimal
- Unhealthy air days now
- 2 days/yr
- Unhealthy air days in 30 yrs
- 2 days/yr
Risk factors via First Street. Map © Google.
Why this score? — see what drove the D- grade
The composite is a weighted blend of 9 inputs, each scored 0–100. Each bar is that input's sub-score; the figure is the points it added to the 100-point composite (weight × sub-score).
- ARV discount +15.0/15.0
- Cash flow +8.0/30.0
- Schools +4.0/10.0
- Livability +3.6/5.0
- Condition / age +2.5/5.0
- Rent growth +2.4/5.0
- DSCR +2.0/10.0
- 1% rule +1.9/10.0
- Appreciation +0.0/10.0
$378,000
🖨 Deal sheet 📄 Offer letter ✓ Due diligence
Listing remarks MLS
Great opportunity for home ownership. 2005 built, 2 story, 5 bedrooms, game room, 2 car garage with a small workshop area. Call a Realtor today for your private showing.
Key facts
- 0.61 acre lot
- 4 garage spots
- Built 2005
Neighborhood map
What this means for you Summary
Snapshot
- This is a 4-bed/3.5-bath single-family listed at $378k.
Deal economics
- At list price, monthly cash flow is $-394 ($-5k/yr) — negative.
- To cash-flow at today's rent, offer at most $308k (18.4% below list).
- To meet the 1% rule (rent ≥ 1% of price), the offer needs to be $260k (31.3% below list).
- Recommended offer: $260k (31.3% below list) — sets the bar for 1% rule.
Location & tenants
- Location reads 72/100 on livability (#29 in MS) — a middle-class / working-renter tenant base. Strengths: cost of living A+, housing A+, employment A; Watch: amenities F, commute F.
- Desoto County School District (suburban): math 48% / reading 42% proficiency, ranked #20 of 130 in MS (top 15%) — families likely to look elsewhere, expect single-tenant / working-renter base with shorter leases.
- Market conditions: Rents soft (-0.3%/yr); 566 active listings in the ZIP; 6 comparable units currently listed for rent nearby; rentals lingering (median 44d on market — plan ~5-8 weeks vacancy on turnover, expect pricing pressure); 50% of comp listings sitting > 30 days — soft ceiling on asking rent; solid renter incomes; 1,155 units permitted in DeSoto County in 2024 (0 in 5+ unit buildings).
- This rent runs 30% of the median local income ($103k/yr) — at the standard rent-burdened threshold; future hikes will face affordability resistance.
Forward outlook
- Local home prices are declining (-3.0%/yr); year-one equity from $3k of loan paydown is wiped out by about $11k of value loss. Plan a longer hold.
- DeSoto County population projected at +33% by 2050 — long-run rental-demand tailwind backs the buy-and-hold thesis.
Negotiation context
- It's been on market 56 days — a 3% lower offer ($367k) is reasonable based on typical stale-listing flexibility.
- 9 sale attempts since 21y ago; this cycle's ask has dropped $42k (10%) from the opening price — seller is motivated, your offer sets the floor, not the list.
Risks & watch-outs
- Climate carrying-cost: extreme-heat days projected 7→22/yr by 2055 (HVAC capex compounding) — expect insurance premiums to compound above CPI over the hold.
Questions for the listing agent
- What do current leases actually rent for vs. the listed asking? Can we see a recent rent roll and the last 12 months of T-12 income?
- It's been on market 56 days. Have you received any prior offers? Is the seller open to a 31% concession, seller financing, or rate buy-down credit?
- What does the HOA fee cover, when was the last increase, and are there any pending special assessments or reserve-fund shortfalls?
- Is there a deadline driving the sale (1031 exchange, divorce, estate, relocation)? That informs how much negotiation room exists.
- Schools are B-rated — typically a magnet for longer-tenancy family renters. What's the average tenant stay here, and is there a school-zone premium baked into asking?
- The area grade is low — what's the realistic commute time and amenity access for the typical tenant pool here? Any planned neighborhood developments (good or bad) we should know about?
- What's the average days-on-market for RENTAL listings here right now (not sales)? A rising rental-DOM trend means longer vacancies and softer asking-rent achievability than the comps imply.
- What's the recent tenant-quality profile in this submarket — average credit score on applications, eviction rate, late-payment / NSF rate, and stable-employment percentage? A property-management company in the area should have these aggregated.
- How much new for-sale + rental construction is in the pipeline within 1–3 miles? Heavy new supply typically softens prices + rents 12–24 months out; constrained supply supports both.
Investment metrics
- 1% rule
- 0.69% ✗
- Cap rate
- 5.04%
- Cash-on-cash
- -4.47%
- DSCR
- 0.80
- GRM
- 12.1
CMA / ARV
- ARV (median comp)
- $500,352
- List price
- $378,000
- Delta
- -24.45%
- Verdict
- UNDERPRICED
- Comps
- 20 within 1.0 mi
Show comp detail 5 sales within ~0.75 mi
| Address | Dist | Beds/Ba | Sqft | Sold | Price | $/sf | Match |
|---|---|---|---|---|---|---|---|
| 4945 Graham Lake Dr | 0.35mi | 3/2.0 (-1) | 1,606 (-0%) | 4mo | $288,000 | $179 | 68 |
| 4597 Graham Lake Dr | 0.21mi | 3/2.0 (-1) | 1,732 (+7%) | 2mo | $299,900 | $173 | 65 |
| 4909 Graham Lake Dr | 0.33mi | 4/2.0 | 1,780 (+10%) | 10mo | $295,000 | $166 | 53 |
| 4493 Stone Cross Dr | 0.67mi | 3/2.0 (-1) | 1,824 (+13%) | 22mo | $315,000 | $173 | 18 |
| 7255 Corner Stone Dr | 0.73mi | 3/2.0 (-1) | 1,800 (+12%) | 22mo | $310,000 | $172 | 18 |
Match score weights: distance 35% · size 25% · config 20% · recency 20%. Top-matched comps best support the ARV.
Projected returns pro-forma
-3.0% appreciation · 0.0% rent growth · sell at horizon
- IRR
- -27.0%
- Equity multiple
- 0.11×
- Total profit
- $-94,032
- Equity at exit
- $56,361
- IRR
- -38.4%
- Equity multiple
- -0.36×
- Total profit
- $-143,866
- Equity at exit
- $32,683
Cash invested: $105,840 (down + closing). Projections, not guarantees.
Landlord ↔ Tenant lean methodology
- Overall (STATE)
- 90 Strongly Landlord-Friendly
- State Mississippi
- 90 Strongly Landlord-Friendly · R+11
- County
- — inherits STATE
- City
- — inherits STATE
ZIP-level market 38654
- Home prices YoY
- -26.1%
- Rents YoY
- -0.3%
- Active inventory
- 566
- Price-to-rent
- 12.1×
Monthly cashflow live
- Estimated rent
- $2,595 high interval (Pro) →
- Mortgage (P&I)
- −$1,982
- Tax from tax record
- −$280 /mo · $3,356/yr
- Insurance
- −$158
- HOA
- −$25
- Vacancy / Maint / Mgmt
- −$545
- Net cashflow
- $-394
Break-even live
UW: 25.0% down · 7.5% · 30yr · 1.5% tax · 5.0% vac · 8.0% maint · 8.0% mgmt
Financing live
Cash to close
- Down payment
- $94,500
- Closing costs
- $11,340
- Reserves months
- —
- Total cash needed
- —
Loan-product check · same deal, 3 products live
Conventional
25% down · 7.5% · 30yr
- Down + closing
- —
- Monthly P&I
- —
- Monthly cashflow
- —
- DSCR
- —
- Eligible?
- —
Personal DTI + credit; lowest rate.
DSCR
20% down · 8.5% · 30yr
- Down + closing
- —
- Monthly P&I
- —
- Monthly cashflow
- —
- DSCR
- —
- Eligible?
- —
No personal income docs; deal must DSCR.
Hard money
10% down · 12.0% · 12mo
- Down + closing
- —
- Monthly P&I
- —
- Monthly cashflow
- —
- DSCR
- —
- Eligible?
- —
Short-term bridge; refi at stabilization.
Rent comps 6 comps
| Address | Beds | Baths | Sqft | Rent | $/sqft | DOM | Units | Dist |
|---|---|---|---|---|---|---|---|---|
| 6935 Meadowbrook Ln Olive Branch, MS | 3.0 | 2.0 | 1956 | $2,300 | $1.18 | 43d | 1 | 0.29mi |
| 6150 Morgan Dr Olive Branch, MS | 3.0 | 2.0 | 2000 | $2,130 | $1.06 | 43d | 1 | 0.75mi |
| 7455 Newbury Dr Olive Branch, MS | 5.0 | 3.0 | 2235 | $2,665 | $1.19 | 23d | 1 | 1.09mi |
| 5301 Douglas Dr Unit 1 Olive Branch, MS | 5.0 | 3.0 | 2217 | $2,710 | $1.22 | 16d | 1 | 1.26mi |
| 5301 Douglas Dr Olive Branch, MS | 5.0 | 3.0 | 2217 | $2,665 | $1.20 | 4d | 1 | 1.26mi |
| 5323 Douglas Dr Olive Branch, MS | 5.0 | 3.0 | 2217 | $2,695 | $1.22 | 43d | 1 | 1.28mi |
HOA detail
- Monthly dues
- $25 · $300/yr
Listing history 20 events
-
2026-05-19price $378,000 169-char remark
Show marketing remark (169 chars)
Great opportunity for home ownership. 2005 built, 2 story, 5 bedrooms, game room, 2 car garage with a small workshop area. Call a Realtor today for your private showing.
-
2026-04-03$420,000 Active 169-char remark
Show marketing remark (169 chars)
Great opportunity for home ownership. 2005 built, 2 story, 5 bedrooms, game room, 2 car garage with a small workshop area. Call a Realtor today for your private showing.
-
2021-10-11historical
-
2020-08-18soldstatus
-
2020-08-14soldstatus
-
2020-02-11$320,000
-
2019-08-01$329,900
-
2018-09-07soldstatus
-
2018-09-05soldstatus
-
2018-06-29$312,500
-
2018-06-26historical
-
2018-06-01$324,900
-
2011-12-30soldstatus
-
2011-08-23$209,900
-
2011-08-22historical
-
2010-10-18$219,900
-
2010-07-22historical
-
2010-03-21$159,900
-
2006-09-05historical
-
2005-07-05$319,900
ⓘ Source: listings_history table (triggers on properties + properties_extension) + one-shot
backfill from property_details.listing_events for pre-trigger history.
Tax reassessment forecast MS · Resets to sale price
- Current annual tax
- $3,356 · $280/mo
- Projected year-2 tax
- $3,356 · $280/mo
- Expected delta
- $0/yr ($0/mo · 0.0%)
ⓘ Screening estimate from a state-policy table — verify with the county assessor before closing.
Climate risk First Street
- Flood 1/10 Low FEMA zone X (unshaded) · 0% chance over 30 yrs
- Wildfire 3/10 Moderate
- Heat 7/10 Severe 7 d/yr ≥109°F today · 22 d/yr by 30 yrs out
- Wind 4/10 Moderate 20% chance of damaging wind over 30 yrs
- Air quality 2/10 Low 2 unhealthy d/yr today · 2 by 30 yrs out
Nearby sold comps map
Loading sold comps map…
Walkable amenities ~0.75 mi
Loading nearby amenities…
Taxation est. · year 1
- Rental income
- $31,143
- − Mortgage interest
- −$21,174
- − Property taxes
- −$3,356
- − Insurance
- −$1,890
- − Repairs & maintenance
- −$2,491
- − Management
- −$2,491
- − HOA
- −$300
- − Depreciation
- −$10,996
- Taxable loss
- −$11,557
- Est. tax savings @ 24.0%
- +$2,774
- After-tax cash flow
- $-1,957/yr
For passive investors: Depreciation is non-cash, so a rental often shows a tax loss while cash-flowing — sheltering income. Rental losses are passive: they offset passive income freely, and up to $25,000/yr can offset ordinary (W-2) income if you actively participate and your MAGI is under $100k (phasing out to $0 by $150k); unused losses carry forward. On sale, claimed depreciation is recaptured at up to 25%, and gains may owe capital-gains tax (a 1031 exchange can defer both). Figures are a year-1 estimate at your 24.0% rate — not tax advice; consult a CPA.
Schools (NCES district)
- District
- Desoto County School District
- NCES district ID
- 2801320
- Math proficiency
- 48% ▼ -13.00%
- Reading proficiency
- 42% ▼ -6.00%
- Median HH income
- $59,272
- Composite
- 39.56/100
- National rank
- #3933
- State rank
- #20 of 130 in MS
Livability — Olive Branch
- Score
- 72/100
- State rank
- #29
- US rank
- #6509
Category grades
Schools grade is shown separately in the Schools card above.
Census & demographics
- Census place
- Olive Branch, MS
- County
- DeSoto County · 176,513 people
- City population
- 57,898
- Metro
- Memphis, TN-MS-AR
- Population (ZIP)
- 57,898
- Household income
- $103,092
- Rent vs Own
- Severe rent burden
- 801.0
Population outlook (DeSoto County) Hauer SSP2
- Today (2025)
- 203,338 people
- By 2030
- 217,692 · +7.1%
- By 2040
- 245,320 · +20.6%
- By 2050
- 270,133 · +32.8%
- By 2075
- 323,341 · +59.0%
- By 2100
- 348,742 · +71.5%
Race, ethnicity, and origin ACS 2023
- Neighborhood character
- Diverse neighborhood (Simpson 0.57)
- Race & ethnicity
- White 57% Black 32% Hispanic / Latino 5% Two or more races 5% Asian 2%
- Hispanic origin (detail)
- Mexican 4%
- Common ancestry
- Slovak 2% Lithuanian 1% Romanian 1%
- Foreign-born
- 4% · Canada, Vietnam, China
- Languages at home
- 93% English-only · Spanish 4% Vietnamese 1% Arabic 1%
Political lean MEDSL · DeSoto
- 2024 margin
- Strong R (+24.1) · D 36.7% · R 60.8% · Other 2.5%
- 2008→2024 swing
- +14.2pp toward D · 2008: -38.2pp · 2024: -24.1pp
- All cycles
- 2024: R+24.1 2020: R+23.9 2016: R+34.8 2012: R+33.5 2008: R+38.2
Not yet ingested
- Civics
- —
Market trends
- HPI YoY
- ▼ -66.27%
- Current HPI
- 187.2114
- Rent YoY
- ▼ -0.34%
- Metro
- Memphis, TN-MS-AR
- State GDP YoY
- —
- F500 in state
- 0
Price history
+18.2% since first listed20 events — show timeline
- 2026-05-19 Price Changed $378,000 MLSU
- 2026-04-03 Listed $420,000 MLSU
- 2021-10-11 Listing Removed — MLSU
- 2020-08-18 Sold (Public Records) — Public Records
- 2020-08-14 Sold (MLS) — MLSU
- 2020-02-11 Listed $320,000 MLSU
- 2019-08-01 Listed $329,900 MLSU
- 2018-09-07 Sold (Public Records) — Public Records
- 2018-09-05 Sold (MLS) — MLSU
- 2018-06-29 Listed $312,500 MLSU
- 2018-06-26 Listing Removed — MLSU
- 2018-06-01 Listed $324,900 MLSU
- 2011-12-30 Sold (MLS) — MLSU
- 2011-08-23 Listed $209,900 MLSU
- 2011-08-22 Listing Removed — MLSU
- 2010-10-18 Listed $219,900 MLSU
- 2010-07-22 Listing Removed — MLSU
- 2010-03-21 Listed $159,900 MLSU
- 2006-09-05 Listing Removed — MLSU
- 2005-07-05 Listed $319,900 MLSU
Property tax history
+2.4%/yrLatest (2025): $3,356 · +14.4% YoY. Source: county tax records.
Cash-flow waterfall
monthlySold comps — $/sqft
last 12 mo · ≤1 miLoading sold comps…