2147 Veterans Dr · Augusta-Richmond County consolidated government (balance), GA
Flood risk 1/10 · Minimal
- FEMA flood zone
- X (unshaded)
- Chance of flooding over 30 yrs
- 0.0%
- Est. flood insurance / yr
- $507 – $1,088
Fire risk 1/10 · Minimal
- Est. fire insurance / yr
- $963 – $1,789
Heat risk 7/10 · Major
- Hot days now (above 107°F)
- 7 days/yr
- Hot days in 30 yrs
- 17 days/yr
Wind risk 6/10 · Moderate
- Chance of severe wind over 30 yrs
- 66.0%
Air-quality risk 3/10 · Minor
- Unhealthy air days now
- 3 days/yr
- Unhealthy air days in 30 yrs
- 3 days/yr
Risk factors via First Street. Map © Google.
Why this score? — see what drove the B- grade
The composite is a weighted blend of 9 inputs, each scored 0–100. Each bar is that input's sub-score; the figure is the points it added to the 100-point composite (weight × sub-score).
- Cash flow +30.0/30.0
- 1% rule +10.0/10.0
- DSCR +10.0/10.0
- ARV discount +7.5/15.0
- Rent growth +2.6/5.0
- Livability +2.5/5.0
- Condition / age +2.5/5.0
- Schools +1.3/10.0
- Appreciation +0.0/10.0
$44,999
🖨 Deal sheet 📄 Offer letter ✓ Due diligence
Listing remarks MLS
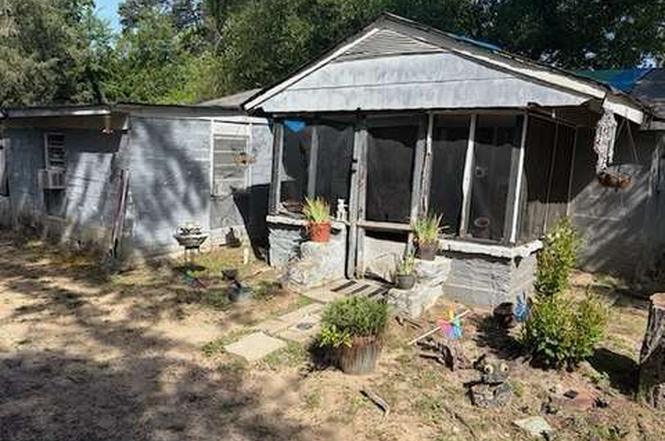
Investor special with endless potential! 2-bedroom, 1-bath home situated on a larger-than-average lot, offering plenty of room to expand, add square footage, or pursue new construction opportunities. Perfect for a fix-and-flip, rental investment, or redevelopment project. Rare oversized lot with significant upside and value-add potential. A great opportunity for investors and builders looking to maximize returns. Buyer to verify all development possibilities.
Key facts
- Rare oversized lot
- 9,583 sq ft lot
- Parking
Tags
Property features AI
Exterior
- Parking: One assigned parking space
- Utilities: Public water; Public sewer; Other electric; Other utilities
- Home design: One-level property
- Construction: Block and concrete construction; Other roof type; Resale condition
- Exterior features: Other exterior features; Asphalt road frontage on a city street
Interior
- Kitchen: Other kitchen features; Other appliances
- Bedrooms: Two main-level bedrooms; Other bedroom features
- Flooring: Carpet flooring
- Bathrooms: One full bathroom (main level); Master bath: Other features
- Heating & cooling: Wall heating units; Window cooling units
- Interior features: No shared/common walls; Other interior features
- Laundry & utility: Other laundry features
Neighborhood map
What this means for you Summary
Snapshot
- This is a 2-bed/1.0-bath single-family listed at $45k.
Deal economics
- At list price, monthly cash flow is $577 ($7k/yr) — positive.
- The deal already cash-flows at list — no discount required.
- Meets the 1% rule at list price ($1k rent vs $45k).
- Cap rate 21.7% vs local median 5.3% in Augusta-Richmond County consolidated government (balance) — top-decile yield for the area; either an underpriced asset or a hidden risk that comps aren't pricing in. Stress-test before assuming the spread holds.
Location & tenants
- Location reads: area grade B — affects rentability + tenant quality, not the cash-flow math above.
- Richmond County (urban): math 12% / reading 20% proficiency, ranked #154 of 174 in GA (top 88%) — low school quality limits family demand, transient renter base, plan for 1-2y turnover; 72% free/reduced lunch — lower-income household profile, screen leases tightly.
- Market conditions: Rents flat; 303 active listings in the ZIP; 10 comparable units currently listed for rent nearby; rentals at typical pace (median 23d on market — plan ~3-4 weeks tenant-placement turnaround); 561 units permitted in Richmond County in 2024 (0 in 5+ unit buildings).
Forward outlook
- Local home prices are declining (-3.0%/yr); year-one equity from $311 of loan paydown is wiped out by about $1k of value loss. Plan a longer hold.
- Richmond County population projected to shrink 5% by 2050 — rents likely to lag national; underwrite the cash flow, not the appreciation.
- At projected returns (-3.0% appreciation + 0.5% rent growth), your $13k cash investment doubles in ~3 years — after that, you're playing with house money.
Negotiation context
- Only 1 days on market — expect competitive offers; lowballing is unlikely to land.
- 4 sale attempts since 4y ago with the ask held roughly flat each time — persistent listings suggest the price (not the market) is what's stuck; bring a comps-based counter.
- Current owner paid $27k; list at $45k implies a 67% gain — meaningful room to come down on a strong offer.
Risks & watch-outs
- Watch-outs: built in 1931 — expect roof / HVAC / electrical / plumbing capex.
- Climate carrying-cost: major wind risk, 66% chance of damaging wind over 30y; extreme-heat days projected 7→17/yr by 2055 (HVAC capex compounding) — expect insurance premiums to compound above CPI over the hold.
Questions for the listing agent
- Built in 1931 — when were the roof, HVAC, electrical panel, plumbing, and water heater last replaced?
- Is there a deadline driving the sale (1031 exchange, divorce, estate, relocation)? That informs how much negotiation room exists.
- What's the average days-on-market for RENTAL listings here right now (not sales)? A rising rental-DOM trend means longer vacancies and softer asking-rent achievability than the comps imply.
- What's the recent tenant-quality profile in this submarket — average credit score on applications, eviction rate, late-payment / NSF rate, and stable-employment percentage? A property-management company in the area should have these aggregated.
- How much new for-sale + rental construction is in the pipeline within 1–3 miles? Heavy new supply typically softens prices + rents 12–24 months out; constrained supply supports both.
Investment metrics
- 1% rule
- 2.53% ✓
- Cap rate
- 21.69%
- Cash-on-cash
- 54.98%
- DSCR
- 3.45
- GRM
- 3.3
CMA / ARV
No comps found within radius.
Projected returns pro-forma
-3.0% appreciation · 0.48% rent growth · sell at horizon
- IRR
- 50.3%
- Equity multiple
- 3.12×
- Total profit
- $26,688
- Equity at exit
- $6,709
- IRR
- 54.7%
- Equity multiple
- 5.74×
- Total profit
- $59,709
- Equity at exit
- $3,891
Cash invested: $12,600 (down + closing). Projections, not guarantees.
Landlord ↔ Tenant lean methodology
- Overall (STATE)
- 90 Strongly Landlord-Friendly
- State Georgia
- 90 Strongly Landlord-Friendly · R+3
- County
- — inherits STATE
- City
- — inherits STATE
ZIP-level market 30909
- Home prices YoY
- -32.2%
- Rents YoY
- 0.5%
- Active inventory
- 303
- Price-to-rent
- 3.3×
Monthly cashflow live
- Estimated rent
- $1,137 high interval (Pro) →
- Mortgage (P&I)
- −$236
- Tax from tax record
- −$66 /mo · $793/yr
- Insurance
- −$19
- HOA
- −$0
- Vacancy / Maint / Mgmt
- −$239
- Net cashflow
- $577
Break-even live
UW: 25.0% down · 7.5% · 30yr · 1.5% tax · 5.0% vac · 8.0% maint · 8.0% mgmt
Financing live
Cash to close
- Down payment
- $11,250
- Closing costs
- $1,350
- Reserves months
- —
- Total cash needed
- —
Loan-product check · same deal, 3 products live
Conventional
25% down · 7.5% · 30yr
- Down + closing
- —
- Monthly P&I
- —
- Monthly cashflow
- —
- DSCR
- —
- Eligible?
- —
Personal DTI + credit; lowest rate.
DSCR
20% down · 8.5% · 30yr
- Down + closing
- —
- Monthly P&I
- —
- Monthly cashflow
- —
- DSCR
- —
- Eligible?
- —
No personal income docs; deal must DSCR.
Hard money
10% down · 12.0% · 12mo
- Down + closing
- —
- Monthly P&I
- —
- Monthly cashflow
- —
- DSCR
- —
- Eligible?
- —
Short-term bridge; refi at stabilization.
Rent comps 10 comps
| Address | Beds | Baths | Sqft | Rent | $/sqft | DOM | Units | Dist |
|---|---|---|---|---|---|---|---|---|
| 3122 Damascus Rd Augusta, GA | 1.0–3.0 | 1.0–2.0 | 915 | $1,310 | $1.43 | 13d | 16 | 0.76mi |
| 1811 Sibley Rd Augusta, GA | 1.0–2.0 | 1.0–2.0 | 820 | $1,229 | $1.50 | 13d | 12 | 0.88mi |
| 1500 Champions Pines Ln Augusta, GA | 1.0–2.0 | 1.0–2.0 | 825 | $1,140 | $1.38 | 23d | 14 | 0.95mi |
| 1730 Sibley Rd Augusta, GA | 1.0–2.0 | 1.0 | 750 | $1,125 | $1.50 | 23d | 1 | 0.97mi |
| 1700 Valley Park Ct Augusta, GA | 1.0–3.0 | 1.0–2.0 | 957 | $1,122 | $1.17 | 43d | 7 | 1.09mi |
| 1700 Valley Park Ct Augusta, GA | 1.0–3.0 | 1.0–2.0 | 957 | $1,122 | $1.17 | 23d | 1 | 1.09mi |
| 3211 Wrightsboro Rd Augusta, GA | 1.0–3.0 | 1.0–2.0 | 972 | $825 | $0.85 | 43d | 1 | 1.25mi |
| 237 Fox Trce Augusta, GA | 1.0–2.0 | 1.0 | 750 | $775 | $1.03 | 21d | 6 | 1.31mi |
| 3126 Arcadia Dr Unit B Augusta, GA | 2.0 | 1.0 | 748 | $895 | $1.20 | 23d | 1 | 1.46mi |
| 3126 Arcadia Dr Unit B Augusta, GA | 2.0 | 1.0 | 748 | $1,025 | $1.37 | 43d | 1 | 1.46mi |
Listing history 2 events
-
2026-06-19remarks 463-char remark
-
2026-06-19$44,999 Active 1 DOM
ⓘ Source: listings_history table (triggers on properties + properties_extension) + one-shot
backfill from property_details.listing_events for pre-trigger history.
Tax reassessment forecast GA · Resets to sale price
- Current annual tax
- $793 · $66/mo
- Projected year-2 tax
- $793 · $66/mo
- Expected delta
- $0/yr ($0/mo · 0.0%)
ⓘ Screening estimate from a state-policy table — verify with the county assessor before closing.
Climate risk First Street
- Flood 1/10 Low FEMA zone X (unshaded) · 0% chance over 30 yrs
- Wildfire 1/10 Low
- Heat 7/10 Severe 7 d/yr ≥107°F today · 17 d/yr by 30 yrs out
- Wind 6/10 Major 66% chance of damaging wind over 30 yrs
- Air quality 3/10 Moderate 3 unhealthy d/yr today · 3 by 30 yrs out
Nearby sold comps map
Loading sold comps map…
Walkable amenities ~0.75 mi
Loading nearby amenities…
Taxation est. · year 1
- Rental income
- $13,643
- − Mortgage interest
- −$2,521
- − Property taxes
- −$793
- − Insurance
- −$225
- − Repairs & maintenance
- −$1,091
- − Management
- −$1,091
- − Depreciation
- −$1,309
- Taxable income
- $6,612
- Est. tax owed @ 24.0%
- −$1,587
- After-tax cash flow
- $5,341/yr
For passive investors: Depreciation is non-cash, so a rental often shows a tax loss while cash-flowing — sheltering income. Rental losses are passive: they offset passive income freely, and up to $25,000/yr can offset ordinary (W-2) income if you actively participate and your MAGI is under $100k (phasing out to $0 by $150k); unused losses carry forward. On sale, claimed depreciation is recaptured at up to 25%, and gains may owe capital-gains tax (a 1031 exchange can defer both). Figures are a year-1 estimate at your 24.0% rate — not tax advice; consult a CPA.
Schools (NCES district)
- District
- Richmond County
- NCES district ID
- 1304380
- Math proficiency
- 12% ▼ -9.00%
- Reading proficiency
- 20% ▼ -6.00%
- Median HH income
- $38,069
- Composite
- 13.43/100
- National rank
- #9524
- State rank
- #154 of 174 in GA
Livability — Augusta-Richmond County consolidated government (balance)
No livability data for this city. (Only ~50 U.S. cities are tracked.)
Census & demographics
- Census place
- Augusta-Richmond County consolidated government (balance), GA
- County
- Richmond County · 190,917 people
- City population
- 154,035
- Metro
- Augusta-Richmond County, GA-SC
- Population (ZIP)
- 46,501
- Household income
- $71,364
- Rent vs Own
- Severe rent burden
- 2113.0
Population outlook (Richmond County) Hauer SSP2
- Today (2025)
- 200,753 people
- By 2030
- 200,232 · -0.3%
- By 2040
- 196,813 · -2.0%
- By 2050
- 190,347 · -5.2%
- By 2075
- 172,496 · -14.1%
- By 2100
- 146,284 · -27.1%
Race, ethnicity, and origin ACS 2023
- Neighborhood character
- Diverse neighborhood (Simpson 0.65)
- Race & ethnicity
- Black 44% White 39% Two or more races 9% Hispanic / Latino 6% Asian 3%
- Hispanic origin (detail)
- Mexican 3% Puerto Rican 2%
- Common ancestry
- Slovak 2% Serbian 1% Lithuanian 1%
- Foreign-born
- 6% · Canada, China, South Korea
- Languages at home
- 92% English-only · Spanish 3% Other Indo-European 1% Chinese 1%
Political lean MEDSL · Richmond
- 2024 margin
- Solid D (+36.1) · D 67.8% · R 31.7%
- 2008→2024 swing
- +4.3pp toward D · 2008: 31.8pp · 2024: 36.1pp
- All cycles
- 2024: D+36.1 2020: D+37.2 2016: D+32.4 2012: D+33.8 2008: D+31.8
Not yet ingested
- Civics
- —
Market trends
- HPI YoY
- ▼ -133.14%
- Current HPI
- 280.4587
- Rent YoY
- ▲ 0.48%
- Metro
- Augusta-Richmond County, GA-SC
- State GDP YoY
- ▲ 2.66%
- F500 in state
- 28
Industry mix (Fortune 500 HQ in GA)
| Industry | F500 HQs | Revenue |
|---|---|---|
| Paper / Packaging | 2 | $29B |
|
||
| Retail | 1 | $160B |
|
||
| Transportation / Logistics | 1 | $91B |
|
||
| Airlines | 1 | $62B |
|
||
| Consumer Goods | 1 | $47B |
|
||
| Utilities | 1 | $25B |
|
||
Price history
+80.0% since first listed6 events — show timeline
- 2026-06-18 Listed $44,999 FMLS
- 2026-06-18 Listed $44,999 GAMLS
- 2022-11-11 Sold (MLS) $27,000 Hive MLS
- 2022-11-11 Sold (MLS) $27,000 Hive MLS
- 2022-10-26 Listed $25,000 Hive MLS
- 2022-10-26 Listed $25,000 Hive MLS
Property tax history
+1.8%/yrLatest (2025): $793 · +15.2% YoY. Source: county tax records.
Cash-flow waterfall
monthlySold comps — $/sqft
last 12 mo · ≤1 miLoading sold comps…