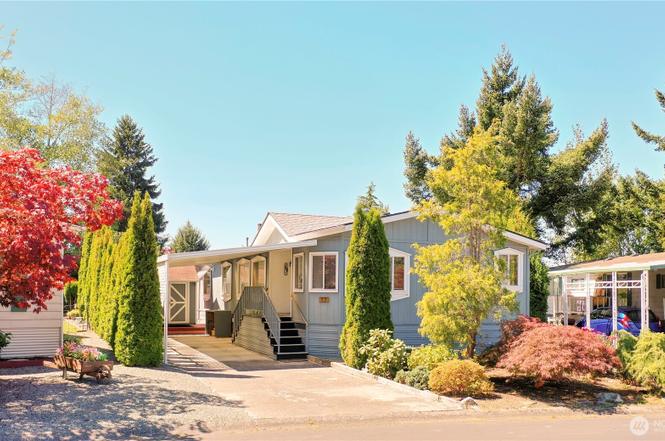
2725 E Fir St #57 · Mount Vernon, WA
Flood risk 4/10 · Minor
- FEMA flood zone
- X
- Chance of flooding over 30 yrs
- 0.22%
- Est. flood insurance / yr
- $507 – $1,088
Fire risk 3/10 · Minor
- Est. fire insurance / yr
- $604 – $1,122
Heat risk 2/10 · Minimal
- Hot days now (above 81°F)
- 8 days/yr
- Hot days in 30 yrs
- 21 days/yr
Wind risk 1/10 · Minimal
- Chance of severe wind over 30 yrs
- —
Air-quality risk 5/10 · Moderate
- Unhealthy air days now
- 7 days/yr
- Unhealthy air days in 30 yrs
- 7 days/yr
Risk factors via First Street. Map © Google.
Why this score? — see what drove the B grade
The composite is a weighted blend of 9 inputs, each scored 0–100. Each bar is that input's sub-score; the figure is the points it added to the 100-point composite (weight × sub-score).
- Cash flow +30.0/30.0
- DSCR +10.0/10.0
- 1% rule +9.4/10.0
- ARV discount +7.5/15.0
- Schools +4.0/10.0
- Livability +4.0/5.0
- Rent growth +3.1/5.0
- Condition / age +2.5/5.0
- Appreciation +0.0/10.0
$152,500
🖨 Deal sheet 📄 Offer letter ✓ Due diligence
Listing remarks
Welcome to Park Village, a vibrant and welcoming 55+ community in the heart of Mount Vernon. This spacious 2-bedroom, 1.75-bath manufactured home offers 1,440 square feet of comfortable single-level living with an easy, open layout ideal for both everyday living and entertaining. The bright living and dining areas feel inviting and connected, while the generous kitchen provides ample counter space and cabinetry for cooking and gathering. The primary suite includes a walk-in closet and private shower, creating a relaxing retreat. A large enclosed back deck extends the living space year-round and is perfect for hobbies, morning coffee, or quiet afternoons. Outside, you’ll find a covered
Key facts
- Walk-in closet
- Covered carport
- Open layout
Tags
Neighborhood map
What this means for you Summary
Snapshot
- This is a 2-bed/2.0-bath manufactured listed at $152k.
Deal economics
- At list price, monthly cash flow is $754 ($9k/yr) — positive.
- The deal already cash-flows at list — no discount required.
- Meets the 1% rule at list price ($2k rent vs $152k).
- Recommended offer: $150k (1.5% below list) — sets the bar for market timing.
- Cap rate 12.2% vs local median 2.4% in Mount Vernon — top-decile yield for the area; either an underpriced asset or a hidden risk that comps aren't pricing in. Stress-test before assuming the spread holds.
Location & tenants
- Location reads 79/100 on livability (#106 in WA, #2,120 nationally) — a middle-class / working-renter tenant base. Strengths: commute A+, housing A+, health & safety A+; Watch: cost of living D+.
- Mount Vernon School District (urban): math 41% / reading 47% proficiency, ranked #189 of 291 in WA (top 65%) — families likely to look elsewhere, expect single-tenant / working-renter base with shorter leases.
- Market conditions: Rents rising (+2.3%/yr); 199 active listings in the ZIP; 10 comparable units currently listed for rent nearby; rentals lingering (median 44d on market — plan ~5-8 weeks vacancy on turnover, expect pricing pressure); 50% of comp listings sitting > 30 days — soft ceiling on asking rent; solid renter incomes; 561 units permitted in Skagit County in 2024 (270 in 5+ unit buildings).
- This rent runs 34% of the median local income ($77k/yr) — at the standard rent-burdened threshold; future hikes will face affordability resistance.
Forward outlook
- Local home prices are declining (-3.0%/yr); year-one equity from $1k of loan paydown is wiped out by about $5k of value loss. Plan a longer hold.
- Skagit County population projected at +11% by 2050 — modest demand growth; plan on rents tracking national, not racing it.
- At projected returns (-3.0% appreciation + 2.3% rent growth), your $43k cash investment doubles in ~6 years — after that, you're playing with house money.
Negotiation context
- It's been on market 17 days — a 2% lower offer ($150k) is reasonable based on typical stale-listing flexibility.
- 3 sale attempts since 19y ago with the ask held roughly flat each time — persistent listings suggest the price (not the market) is what's stuck; bring a comps-based counter.
- Current owner paid $44k; list at $152k implies a 243% gain — meaningful room to come down on a strong offer.
Questions for the listing agent
- Is there a deadline driving the sale (1031 exchange, divorce, estate, relocation)? That informs how much negotiation room exists.
- What's the average days-on-market for RENTAL listings here right now (not sales)? A rising rental-DOM trend means longer vacancies and softer asking-rent achievability than the comps imply.
- What's the recent tenant-quality profile in this submarket — average credit score on applications, eviction rate, late-payment / NSF rate, and stable-employment percentage? A property-management company in the area should have these aggregated.
- How much new for-sale + rental construction is in the pipeline within 1–3 miles? Heavy new supply typically softens prices + rents 12–24 months out; constrained supply supports both.
Investment metrics
- 1% rule
- 1.44% ✓
- Cap rate
- 12.22%
- Cash-on-cash
- 21.19%
- DSCR
- 1.94
- GRM
- 5.8
CMA / ARV
- ARV (on-the-fly)
- $99,084
- Comps found
- 12
Show comp detail 12 sales within ~0.75 mi
| Address | Dist | Beds/Ba | Sqft | Sold | Price | $/sf | Match |
|---|---|---|---|---|---|---|---|
| 2725 E Fir St #106 | 0.03mi | 2/2.0 | 1,440 (+0%) | 4mo | $52,000 | $36 | 95 |
| 2725 E Fir St #85 | 0.00mi | 2/2.0 | 1,428 (-1%) | 13mo | $115,000 | $81 | 88 |
| 2725 E Fir #99 | 0.00mi | 2/2.0 | 1,524 (+6%) | 9mo | $82,000 | $54 | 82 |
| 2725 E Fir St | 0.00mi | 2/2.0 | 1,334 (-7%) | 11mo | $92,000 | $69 | 79 |
| 2725 E Fir St #13 | 0.00mi | 2/2.0 | 1,344 (-6%) | 13mo | $97,500 | $73 | 78 |
| 2725 E Fir St #41 | 0.02mi | 2/2.0 | 1,248 (-13%) | 1mo | $85,000 | $68 | 76 |
| 2725 Fir St #22 | 0.00mi | 2/2.0 | 1,272 (-11%) | 10mo | $75,500 | $59 | 73 |
| 2725 E Fir St #2 | 0.00mi | 3/2.0 (+1) | 1,344 (-6%) | 14mo | $60,000 | $45 | 73 |
| 2725 E Fir St #84 | 0.02mi | 2/2.0 | 1,280 (-11%) | 10mo | $122,000 | $95 | 73 |
| 2725 E Fir #98 | 0.02mi | 3/2.0 (+1) | 1,578 (+10%) | 7mo | $78,500 | $50 | 72 |
| 1915 N 33rd Pl | 0.67mi | 2/2.0 | 1,274 (-11%) | 4mo | $399,000 | $313 | 47 |
| 1905 N 33rd | 0.64mi | 3/2.0 (+1) | 1,274 (-11%) | 9mo | $480,000 | $377 | 39 |
Match score weights: distance 35% · size 25% · config 20% · recency 20%. Top-matched comps best support the ARV.
Projected returns pro-forma
-3.0% appreciation · 2.33% rent growth · sell at horizon
- IRR
- 12.9%
- Equity multiple
- 1.51×
- Total profit
- $21,819
- Equity at exit
- $22,738
- IRR
- 21.3%
- Equity multiple
- 2.75×
- Total profit
- $74,826
- Equity at exit
- $13,185
Cash invested: $42,700 (down + closing). Projections, not guarantees.
Landlord ↔ Tenant lean methodology
- Overall (STATE)
- 28 Tenant-Leaning
- State Washington
- 28 Tenant-Leaning · D+8
- County
- — inherits STATE
- City
- — inherits STATE
ZIP-level market 98273
- Rents YoY
- 2.3%
- Active inventory
- 199
- Price-to-rent
- 5.8×
Monthly cashflow live
- Estimated rent
- $2,192 high interval (Pro) →
- Mortgage (P&I)
- −$800
- Tax from tax record
- −$115 /mo · $1,374/yr
- Insurance
- −$64
- HOA
- −$0
- Vacancy / Maint / Mgmt
- −$460
- Net cashflow
- $754
Break-even live
UW: 25.0% down · 7.5% · 30yr · 1.5% tax · 5.0% vac · 8.0% maint · 8.0% mgmt
Financing live
Cash to close
- Down payment
- $38,125
- Closing costs
- $4,575
- Reserves months
- —
- Total cash needed
- —
Loan-product check · same deal, 3 products live
Conventional
25% down · 7.5% · 30yr
- Down + closing
- —
- Monthly P&I
- —
- Monthly cashflow
- —
- DSCR
- —
- Eligible?
- —
Personal DTI + credit; lowest rate.
DSCR
20% down · 8.5% · 30yr
- Down + closing
- —
- Monthly P&I
- —
- Monthly cashflow
- —
- DSCR
- —
- Eligible?
- —
No personal income docs; deal must DSCR.
Hard money
10% down · 12.0% · 12mo
- Down + closing
- —
- Monthly P&I
- —
- Monthly cashflow
- —
- DSCR
- —
- Eligible?
- —
Short-term bridge; refi at stabilization.
Rent comps 10 comps
| Address | Beds | Baths | Sqft | Rent | $/sqft | DOM | Units | Dist |
|---|---|---|---|---|---|---|---|---|
| 1521 N 26th St Mount Vernon, WA | 1.0–3.0 | 1.0 | 807 | $1,755 | $2.17 | 21d | 8 | 0.32mi |
| 1115 Nylin Ct Mount Vernon, WA | 3.0 | 1.0 | 1032 | $2,500 | $2.42 | 43d | 1 | 0.50mi |
| 3316 E College Way Unit A Mount Vernon, WA | 3.0 | 1.0 | 916 | $2,000 | $2.18 | 43d | 1 | 0.53mi |
| 119 N 29th Pl Mount Vernon, WA | 3.0 | 1.0 | 1098 | $2,700 | $2.46 | 43d | 1 | 0.62mi |
| 1508 N Waugh Rd Apt B Mount Vernon, WA | 2.0 | 1.0 | 1021 | $2,300 | $2.25 | 21d | 1 | 0.74mi |
| 3129 Arbor St Mount Vernon, WA | 3.0 | 2.0 | 1244 | $2,600 | $2.09 | 21d | 1 | 1.16mi |
| 202 Dallas St Mount Vernon, WA | 3.0 | 2.5 | 1582 | $1,375 | $0.87 | 21d | 1 | 1.32mi |
| 2430 W Meadow Blvd Mount Vernon, WA | 3.0 | 2.5 | 1400 | $3,000 | $2.14 | 43d | 1 | 1.33mi |
| 1002 S 12th St Mount Vernon, WA | 2.0 | 1.0 | 1052 | $2,575 | $2.45 | 21d | 1 | 1.37mi |
| 1511 Shirley Pl Mount Vernon, WA | 2.0 | 1.0 | 936 | $2,250 | $2.40 | 43d | 1 | 1.38mi |
Listing history 8 events
-
2026-03-04status Pending
-
2026-02-14$152,500 Active
-
2015-04-03soldstatus $44,500 Sold
-
2015-03-16status Pending Inspection
-
2015-03-12$44,500 Active
-
2007-12-28soldstatus $60,000
-
2007-12-17historical
-
2007-12-10$60,000
ⓘ Source: listings_history table (triggers on properties + properties_extension) + one-shot
backfill from property_details.listing_events for pre-trigger history.
Tax reassessment forecast WA · Resets to sale price
- Current annual tax
- $1,374 · $115/mo
- Projected year-2 tax
- $1,494 · $125/mo
- Expected delta
- +$120/yr (+$10/mo · 8.7%)
ⓘ Screening estimate from a state-policy table — verify with the county assessor before closing.
Climate risk First Street
- Flood 4/10 Moderate FEMA zone X · 22% chance over 30 yrs
- Wildfire 3/10 Moderate
- Heat 2/10 Low 8 d/yr ≥81°F today · 21 d/yr by 30 yrs out
- Wind 1/10 Low
- Air quality 5/10 Major 7 unhealthy d/yr today · 7 by 30 yrs out
Nearby sold comps map
Loading sold comps map…
Walkable amenities ~0.75 mi
Loading nearby amenities…
Taxation est. · year 1
- Rental income
- $26,304
- − Mortgage interest
- −$8,542
- − Property taxes
- −$1,374
- − Insurance
- −$762
- − Repairs & maintenance
- −$2,104
- − Management
- −$2,104
- − Depreciation
- −$4,436
- Taxable income
- $6,979
- Est. tax owed @ 24.0%
- −$1,675
- After-tax cash flow
- $7,371/yr
For passive investors: Depreciation is non-cash, so a rental often shows a tax loss while cash-flowing — sheltering income. Rental losses are passive: they offset passive income freely, and up to $25,000/yr can offset ordinary (W-2) income if you actively participate and your MAGI is under $100k (phasing out to $0 by $150k); unused losses carry forward. On sale, claimed depreciation is recaptured at up to 25%, and gains may owe capital-gains tax (a 1031 exchange can defer both). Figures are a year-1 estimate at your 24.0% rate — not tax advice; consult a CPA.
Schools (NCES district)
- District
- Mount Vernon School District
- NCES district ID
- 5305400
- Math proficiency
- 41% ▼ -1.00%
- Reading proficiency
- 47% ▲ 1.00%
- Median HH income
- $50,829
- Composite
- 40.14/100
- National rank
- #7848
- State rank
- #189 of 291 in WA
Livability — Mount Vernon
- Score
- 79/100
- State rank
- #106
- US rank
- #2120
Category grades
Schools grade is shown separately in the Schools card above.
Census & demographics
- Census place
- Mount Vernon, WA
- County
- Skagit County · 118,108 people
- City population
- 48,861
- Metro
- Mount Vernon-Anacortes, WA
- Population (ZIP)
- 30,001
- Household income
- $76,717
- Rent vs Own
- Severe rent burden
- 1045.0
Population outlook (Skagit County) Hauer SSP2
- Today (2025)
- 131,498 people
- By 2030
- 135,556 · +3.1%
- By 2040
- 141,717 · +7.8%
- By 2050
- 145,714 · +10.8%
- By 2075
- 152,201 · +15.7%
- By 2100
- 147,980 · +12.5%
Race, ethnicity, and origin ACS 2023
- Neighborhood character
- Majority White (60%)
- Race & ethnicity
- White 60% Hispanic / Latino 32% Two or more races 9% Asian 2% Native American 1%
- Hispanic origin (detail)
- Mexican 30%
- Common ancestry
- Portuguese 6% Slovak 3% Italian 2%
- Foreign-born
- 14% · Canada
- Languages at home
- 71% English-only · Spanish 25% Russian/Polish/Slavic 1% Other Indo-European 1%
Political lean MEDSL · Skagit
- 2024 margin
- Lean D (+8.9) · D 52.9% · R 44.0% · Other 3.0%
- 2008→2024 swing
- -0.7pp no change · 2008: 9.6pp · 2024: 8.9pp
- All cycles
- 2024: D+8.9 2020: D+7.5 2016: D+3.2 2012: D+5.8 2008: D+9.6
Not yet ingested
- Civics
- —
Market trends
- HPI YoY
- ▼ -525.00%
- Current HPI
- 395.3742
- Rent YoY
- ▲ 2.33%
- Metro
- Mount Vernon-Anacortes, WA
- State GDP YoY
- ▲ 4.65%
- F500 in state
- 22
Industry mix (Fortune 500 HQ in WA)
| Industry | F500 HQs | Revenue |
|---|---|---|
| Retail | 2 | $269B |
|
||
| Technology / Retail | 1 | $638B |
|
||
| Technology | 1 | $245B |
|
||
| Telecommunications | 1 | $38B |
|
||
| Food / Beverage | 1 | $36B |
|
||
| Automotive / Trucks | 1 | $34B |
|
||
Price history
+154.2% since first listed8 events — show timeline
- 2026-03-04 Pending — NWMLS as Distributed by MLS Grid
- 2026-02-14 Listed $152,500 NWMLS as Distributed by MLS Grid
- 2015-04-03 Sold (MLS) $44,500 NWMLS as Distributed by MLS Grid
- 2015-03-16 Pending — NWMLS as Distributed by MLS Grid
- 2015-03-12 Listed $44,500 NWMLS as Distributed by MLS Grid
- 2007-12-28 Sold (MLS) $60,000 NWMLS as Distributed by MLS Grid
- 2007-12-17 Delisted — NWMLS as Distributed by MLS Grid
- 2007-12-10 Listed $60,000 NWMLS as Distributed by MLS Grid
Property tax history
+8.7%/yrLatest (2026): $1,374 · +3.5% YoY. Source: county tax records.
Cash-flow waterfall
monthlySold comps — $/sqft
last 12 mo · ≤1 miLoading sold comps…