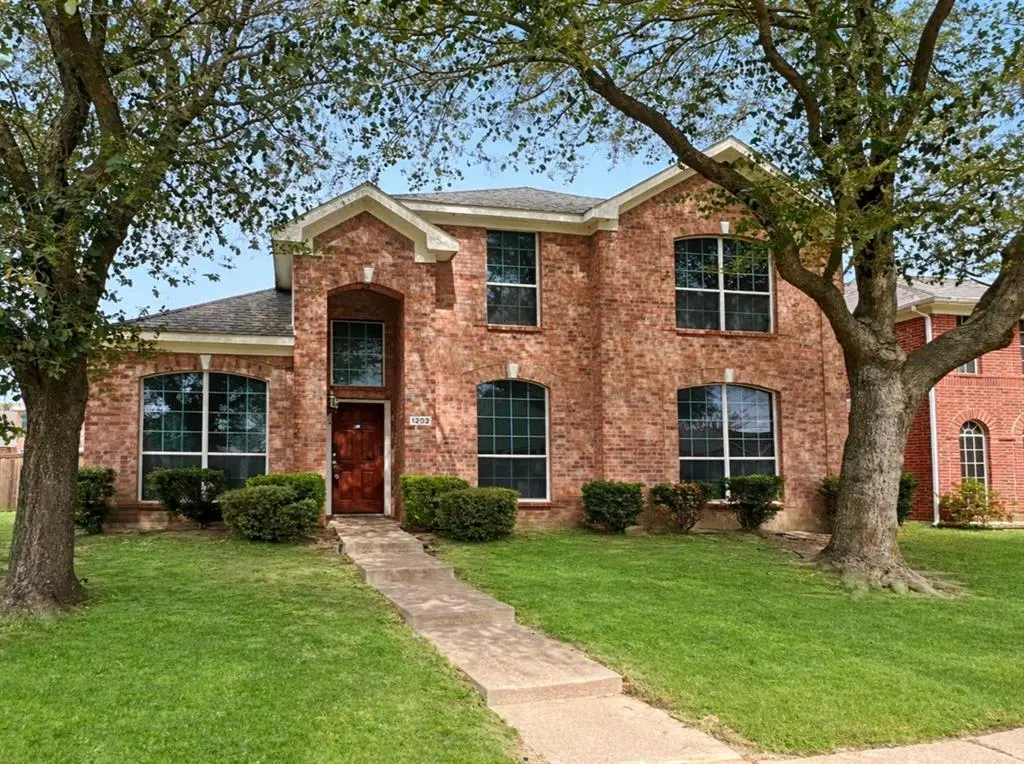
1203 Whitecreek Dr · Glenn Heights, TX
Flood risk 1/10 · Minimal
- FEMA flood zone
- X (unshaded)
- Chance of flooding over 30 yrs
- 0.0%
- Est. flood insurance / yr
- $507 – $1,088
Fire risk 4/10 · Minor
- Est. fire insurance / yr
- $1,222 – $2,270
Heat risk 7/10 · Major
- Hot days now (above 109°F)
- 7 days/yr
- Hot days in 30 yrs
- 24 days/yr
Wind risk 6/10 · Moderate
- Chance of severe wind over 30 yrs
- 27.0%
Air-quality risk 2/10 · Minimal
- Unhealthy air days now
- 2 days/yr
- Unhealthy air days in 30 yrs
- 2 days/yr
Risk factors via First Street. Map © Google.
Why this score? — see what drove the C grade
The composite is a weighted blend of 9 inputs, each scored 0–100. Each bar is that input's sub-score; the figure is the points it added to the 100-point composite (weight × sub-score).
- Cash flow +20.4/30.0
- ARV discount +15.0/15.0
- 1% rule +7.3/10.0
- DSCR +6.5/10.0
- Rent growth +3.2/5.0
- Livability +3.0/5.0
- Condition / age +2.5/5.0
- Schools +1.9/10.0
- Appreciation +0.0/10.0
$250,000
🖨 Deal sheet 📄 Offer letter ✓ Due diligence
Listing remarks MLS
Welcome to this spacious 4-bedroom, 2.5-bath home perfectly located in a highly sought-after neighborhood! To help visualize this homes floor plan and to highlight its potential virtual furnishings may have been added to photos found in this listing.
Key facts
- 6,578 sq ft lot
- 2 garage spots
- Built 2005
Neighborhood map
What this means for you Summary
Snapshot
- This is a 4-bed/2.5-bath single-family listed at $250k.
Deal economics
- At list price, monthly cash flow is $326 ($4k/yr) — positive.
- The deal already cash-flows at list — no discount required.
- Meets the 1% rule at list price ($3k rent vs $250k).
- Recommended offer: $235k (6.0% below list) — sets the bar for market timing.
- Cap rate 7.9% vs local median 4.0% in Glenn Heights — top-decile yield for the area; either an underpriced asset or a hidden risk that comps aren't pricing in. Stress-test before assuming the spread holds.
Location & tenants
- Location reads 60/100 on livability (#1,051 in TX) — a middle-class / working-renter tenant base. Strengths: cost of living A+, housing A+, crime B+; Watch: schools D-, amenities F, commute F.
- Desoto ISD (suburban): math 14% / reading 26% proficiency, ranked #754 of 826 in TX (top 91%) — low school quality limits family demand, transient renter base, plan for 1-2y turnover; 66% free/reduced lunch — lower-income household profile, screen leases tightly.
- Market conditions: Rents rising (+3.0%/yr); 565 active listings in the ZIP; 6 comparable units currently listed for rent nearby; rentals at typical pace (median 25d on market — plan ~3-4 weeks tenant-placement turnaround); solid renter incomes; 12,577 units permitted in Dallas County in 2024 (6,829 in 5+ unit buildings).
- This rent runs 37% of the median local income ($100k/yr) — at the standard rent-burdened threshold; future hikes will face affordability resistance.
Forward outlook
- Local home prices are declining (-3.0%/yr); year-one equity from $2k of loan paydown is wiped out by about $8k of value loss. Plan a longer hold.
- Dallas County population projected at +35% by 2050 — long-run rental-demand tailwind backs the buy-and-hold thesis.
Negotiation context
- It's been on market 83 days — a 6% lower offer ($235k) is reasonable based on typical stale-listing flexibility.
- 8 sale attempts since 15y ago with the ask held roughly flat each time — persistent listings suggest the price (not the market) is what's stuck; bring a comps-based counter.
Risks & watch-outs
- Watch-outs: property tax is 3.2% of price.
- Climate carrying-cost: major wind risk, 27% chance of damaging wind over 30y; extreme-heat days projected 7→24/yr by 2055 (HVAC capex compounding) — expect insurance premiums to compound above CPI over the hold.
Questions for the listing agent
- It's been on market 83 days. Have you received any prior offers? Is the seller open to a 6% concession, seller financing, or rate buy-down credit?
- Property tax is high relative to price — has the assessment been appealed recently, and will the sale trigger a re-assessment?
- What does the HOA fee cover, when was the last increase, and are there any pending special assessments or reserve-fund shortfalls?
- Why hasn't it sold? Are there any deal-killer items the seller is aware of (foundation, flood, title, zoning, code violations)?
- Is there a deadline driving the sale (1031 exchange, divorce, estate, relocation)? That informs how much negotiation room exists.
- Schools are D-rated, which usually means shorter tenancies and higher turnover. Who's the typical renter profile here, and what's been the actual vacancy rate?
- What's the average days-on-market for RENTAL listings here right now (not sales)? A rising rental-DOM trend means longer vacancies and softer asking-rent achievability than the comps imply.
- What's the recent tenant-quality profile in this submarket — average credit score on applications, eviction rate, late-payment / NSF rate, and stable-employment percentage? A property-management company in the area should have these aggregated.
- How much new for-sale + rental construction is in the pipeline within 1–3 miles? Heavy new supply typically softens prices + rents 12–24 months out; constrained supply supports both.
Investment metrics
- 1% rule
- 1.23% ✓
- Cap rate
- 7.86%
- Cash-on-cash
- 5.59%
- DSCR
- 1.25
- GRM
- 6.8
CMA / ARV
- ARV (median comp)
- $327,720
- List price
- $250,000
- Delta
- -23.72%
- Verdict
- UNDERPRICED
- Comps
- 20 within 1.0 mi
Show comp detail 12 sales within ~0.75 mi
| Address | Dist | Beds/Ba | Sqft | Sold | Price | $/sf | Match |
|---|---|---|---|---|---|---|---|
| 1121 Bradford Dr | 0.08mi | 4/2.5 | 2,618 (-3%) | 8mo | $249,900 | $95 | 84 |
| 1207 Whitecreek Dr | 0.02mi | 4/2.5 | 2,455 (-9%) | 8mo | $327,000 | $133 | 77 |
| 1815 High Meadow St | 0.22mi | 4/2.5 | 2,692 (-0%) | 22mo | $380,000 | $141 | 71 |
| 1219 Glencoe Dr | 0.09mi | 5/3.5 (+1) | 2,640 (-2%) | 15mo | $350,000 | $133 | 70 |
| 1808 High Meadow St | 0.18mi | 4/2.5 | 2,441 (-10%) | 7mo | $320,000 | $131 | 70 |
| 1922 High Meadow St | 0.28mi | 4/2.5 | 3,065 (+13%) | 4mo | $375,000 | $122 | 62 |
| 2010 Gardenridge Dr | 0.36mi | 4/2.5 | 2,644 (-2%) | 23mo | $375,000 | $142 | 60 |
| 1819 High Meadow St | 0.23mi | 4/2.5 | 2,989 (+10%) | 14mo | $369,000 | $123 | 60 |
| 1246 Yukon Dr | 0.48mi | 4/2.5 | 2,336 (-14%) | 2mo | $259,900 | $111 | 53 |
| 2018 Gardenridge Dr | 0.40mi | 5/3.0 (+1) | 2,544 (-6%) | 16mo | $361,000 | $142 | 51 |
| 1408 Bobwhite Trl | 0.66mi | 5/3.0 (+1) | 2,703 (-0%) | 20mo | $360,000 | $133 | 46 |
| 904 Blue Quail Run | 0.68mi | 4/3.5 | 2,876 (+6%) | 14mo | $337,500 | $117 | 42 |
Match score weights: distance 35% · size 25% · config 20% · recency 20%. Top-matched comps best support the ARV.
Projected returns pro-forma
-3.0% appreciation · 2.99% rent growth · sell at horizon
- IRR
- -7.5%
- Equity multiple
- 0.72×
- Total profit
- $-19,481
- Equity at exit
- $37,276
- IRR
- 2.2%
- Equity multiple
- 1.15×
- Total profit
- $10,801
- Equity at exit
- $21,615
Cash invested: $70,000 (down + closing). Projections, not guarantees.
Landlord ↔ Tenant lean methodology
- Overall (STATE)
- 87 Strongly Landlord-Friendly
- State Texas
- 87 Strongly Landlord-Friendly · R+5
- County
- — inherits STATE
- City
- — inherits STATE
ZIP-level market 75154
- Home prices YoY
- -18.5%
- Rents YoY
- 3.0%
- Active inventory
- 565
- Price-to-rent
- 6.8×
Monthly cashflow live
- Estimated rent
- $3,077 high interval (Pro) →
- Mortgage (P&I)
- −$1,311
- Tax from tax record
- −$657 /mo · $7,880/yr
- Insurance
- −$104
- HOA
- −$33
- Vacancy / Maint / Mgmt
- −$646
- Net cashflow
- $326
Break-even live
UW: 25.0% down · 7.5% · 30yr · 1.5% tax · 5.0% vac · 8.0% maint · 8.0% mgmt
Financing live
Cash to close
- Down payment
- $62,500
- Closing costs
- $7,500
- Reserves months
- —
- Total cash needed
- —
Loan-product check · same deal, 3 products live
Conventional
25% down · 7.5% · 30yr
- Down + closing
- —
- Monthly P&I
- —
- Monthly cashflow
- —
- DSCR
- —
- Eligible?
- —
Personal DTI + credit; lowest rate.
DSCR
20% down · 8.5% · 30yr
- Down + closing
- —
- Monthly P&I
- —
- Monthly cashflow
- —
- DSCR
- —
- Eligible?
- —
No personal income docs; deal must DSCR.
Hard money
10% down · 12.0% · 12mo
- Down + closing
- —
- Monthly P&I
- —
- Monthly cashflow
- —
- DSCR
- —
- Eligible?
- —
Short-term bridge; refi at stabilization.
Rent comps 6 comps
| Address | Beds | Baths | Sqft | Rent | $/sqft | DOM | Units | Dist |
|---|---|---|---|---|---|---|---|---|
| 1114 Fleming Ct Glenn Heights, TX | 5.0 | 3.5 | 3655 | $3,495 | $0.96 | 1d | 1 | 0.18mi |
| 2002 Bentwood Dr Glenn Heights, TX | 4.0 | 2.5 | 3168 | $2,720 | $0.86 | 10d | 1 | 0.28mi |
| 900 Grouse Rd Glenn Heights, TX | 3.0 | 2.0 | 1752 | $2,300 | $1.31 | 44d | 1 | 0.74mi |
| 73 Palouse St Red Oak, TX | 4.0 | 3.0 | 2097 | $2,950 | $1.41 | 19d | 1 | 1.19mi |
| 169 Yale Ave Red Oak, TX | 4.0 | 2.0 | 2001 | $2,750 | $1.37 | 24d | 1 | 1.39mi |
| 154 Northwestern Ave Red Oak, TX | 4.0 | 2.0 | 2014 | $2,449 | $1.22 | 44d | 1 | 1.46mi |
HOA detail
- Monthly dues
- $33 · $396/yr
Listing history 37 events
-
2026-06-17status $250,000 Pending 83 DOM
-
2026-06-17days on market $250,000 Active Option Contract 83 DOM
-
2026-06-16days on market $250,000 Active Option Contract 82 DOM
-
2026-06-15days on market $250,000 Active Option Contract 81 DOM
-
2026-06-13days on market $250,000 Active Option Contract 79 DOM
-
2026-06-13days on market $250,000 Active Option Contract 78 DOM
-
2026-06-09days on market $250,000 Active Option Contract 75 DOM
-
2026-06-08days on market $250,000 Active Option Contract 74 DOM
-
2026-06-07statusdays on market $250,000 Active Option Contract 73 DOM
-
2026-06-04days on market $250,000 Active 70 DOM
-
2026-06-03days on market $250,000 Active 69 DOM
-
2026-06-02days on market $250,000 Active 68 DOM
-
2026-06-01days on market $250,000 Active 67 DOM
-
2026-05-31days on market $250,000 Active 66 DOM
-
2026-04-30price $250,000 250-char remark
Show marketing remark (250 chars)
Welcome to this spacious 4-bedroom, 2.5-bath home perfectly located in a highly sought-after neighborhood! To help visualize this homes floor plan and to highlight its potential virtual furnishings may have been added to photos found in this listing.
-
2026-04-22status Active 250-char remark
Show marketing remark (250 chars)
Welcome to this spacious 4-bedroom, 2.5-bath home perfectly located in a highly sought-after neighborhood! To help visualize this homes floor plan and to highlight its potential virtual furnishings may have been added to photos found in this listing.
-
2026-04-06historical Active Option Contract 250-char remark
Show marketing remark (250 chars)
Welcome to this spacious 4-bedroom, 2.5-bath home perfectly located in a highly sought-after neighborhood! To help visualize this homes floor plan and to highlight its potential virtual furnishings may have been added to photos found in this listing.
-
2026-03-25$260,000 Active 250-char remark
Show marketing remark (250 chars)
Welcome to this spacious 4-bedroom, 2.5-bath home perfectly located in a highly sought-after neighborhood! To help visualize this homes floor plan and to highlight its potential virtual furnishings may have been added to photos found in this listing.
-
2025-08-06price $325,000
-
2025-06-12status Active
-
2025-06-11historical Active Option Contract
-
2025-04-28$330,000 Active
-
2025-04-10historical
-
2025-03-24price $320,000
-
2025-02-04price $100,000
-
2024-12-16$163,451 Active
-
2024-05-30price $324,900
-
2024-05-22price $339,900
-
2024-05-07$344,900 Active
-
2023-12-07status Pending
-
2023-12-01historical Active Option Contract
-
2023-12-01historical
-
2023-11-27price $329,900
-
2023-11-09price $335,000
-
2023-11-09$329,900 Active
-
2011-08-19historical
-
2011-04-20$126,000 Active
ⓘ Source: listings_history table (triggers on properties + properties_extension) + one-shot
backfill from property_details.listing_events for pre-trigger history.
Tax reassessment forecast TX · Resets to sale price
- Current annual tax
- $7,880 · $657/mo
- Projected year-2 tax
- $7,880 · $657/mo
- Expected delta
- $0/yr ($0/mo · 0.0%)
ⓘ Screening estimate from a state-policy table — verify with the county assessor before closing.
Climate risk First Street
- Flood 1/10 Low FEMA zone X (unshaded) · 0% chance over 30 yrs
- Wildfire 4/10 Moderate
- Heat 7/10 Severe 7 d/yr ≥109°F today · 24 d/yr by 30 yrs out
- Wind 6/10 Major 27% chance of damaging wind over 30 yrs
- Air quality 2/10 Low 2 unhealthy d/yr today · 2 by 30 yrs out
Nearby sold comps map
Loading sold comps map…
Walkable amenities ~0.75 mi
Loading nearby amenities…
Taxation est. · year 1
- Rental income
- $36,929
- − Mortgage interest
- −$14,004
- − Property taxes
- −$7,880
- − Insurance
- −$1,250
- − Repairs & maintenance
- −$2,954
- − Management
- −$2,954
- − HOA
- −$396
- − Depreciation
- −$7,273
- Taxable income
- $218
- Est. tax owed @ 24.0%
- −$52
- After-tax cash flow
- $3,863/yr
For passive investors: Depreciation is non-cash, so a rental often shows a tax loss while cash-flowing — sheltering income. Rental losses are passive: they offset passive income freely, and up to $25,000/yr can offset ordinary (W-2) income if you actively participate and your MAGI is under $100k (phasing out to $0 by $150k); unused losses carry forward. On sale, claimed depreciation is recaptured at up to 25%, and gains may owe capital-gains tax (a 1031 exchange can defer both). Figures are a year-1 estimate at your 24.0% rate — not tax advice; consult a CPA.
Schools (NCES district)
- District
- Desoto ISD
- NCES district ID
- 4816860
- Math proficiency
- 14% ▼ -19.00%
- Reading proficiency
- 26% ▼ -8.00%
- Median HH income
- $61,556
- Composite
- 18.98/100
- National rank
- #8851
- State rank
- #754 of 826 in TX
Livability — Glenn Heights
- Score
- 60/100
- State rank
- #1051
- US rank
- #18686
Category grades
Schools grade is shown separately in the Schools card above.
Census & demographics
- Census place
- Glenn Heights, TX
- County
- Ellis County · 199,237 people
- Metro
- Dallas-Fort Worth-Arlington, TX
- Population (ZIP)
- 52,516
- Household income
- $100,388
- Rent vs Own
- Severe rent burden
- 1081.0
Population outlook (Dallas County) Hauer SSP2
- Today (2025)
- 2,979,839 people
- By 2030
- 3,191,823 · +7.1%
- By 2040
- 3,619,611 · +21.5%
- By 2050
- 4,026,915 · +35.1%
- By 2075
- 4,957,073 · +66.4%
- By 2100
- 5,508,725 · +84.9%
Race, ethnicity, and origin ACS 2023
- Neighborhood character
- Diverse neighborhood (Simpson 0.69)
- Race & ethnicity
- White 39% Black 30% Hispanic / Latino 27% Two or more races 12% Asian 1% Native American 1%
- Hispanic origin (detail)
- Mexican 25%
- Common ancestry
- Italian 2% Slovak 1%
- Foreign-born
- 9% · Canada, Jamaica
- Languages at home
- 80% English-only · Spanish 18%
Political lean MEDSL · Dallas
- 2024 margin
- Strong D (+22.2) · D 60.2% · R 38.0% · Other 1.8%
- 2008→2024 swing
- +6.9pp toward D · 2008: 15.3pp · 2024: 22.2pp
- All cycles
- 2024: D+22.2 2020: D+31.6 2016: D+26.2 2012: D+15.4 2008: D+15.3
Not yet ingested
- Civics
- —
Market trends
- HPI YoY
- ▼ -67.06%
- Current HPI
- 294.5836
- Rent YoY
- ▲ 2.99%
- Metro
- Dallas-Fort Worth-Arlington, TX
- State GDP YoY
- ▲ 3.95%
- F500 in state
- 110
Industry mix (Fortune 500 HQ in TX)
| Industry | F500 HQs | Revenue |
|---|---|---|
| Energy | 16 | $1,198B |
|
||
| Technology | 5 | $198B |
|
||
| Engineering / Construction | 4 | $72B |
|
||
| Energy Services | 3 | $60B |
|
||
| Utilities | 3 | $41B |
|
||
| Healthcare | 2 | $330B |
|
||
Price history
+98.4% since first listed23 events — show timeline
- 2026-04-30 Price Changed $250,000 NTREIS
- 2026-04-22 Relisted — NTREIS
- 2026-04-06 Contingent — NTREIS
- 2026-03-25 Listed $260,000 NTREIS
- 2025-08-06 Price Changed $325,000 NTREIS
- 2025-06-12 Relisted — NTREIS
- 2025-06-11 Contingent — NTREIS
- 2025-04-28 Listed $330,000 NTREIS
- 2025-04-10 Listing Removed — NTREIS
- 2025-03-24 Price Changed $320,000 NTREIS
- 2025-02-04 Price Changed $100,000 NTREIS
- 2024-12-16 Listed $163,451 NTREIS
- 2024-05-30 Price Changed $324,900 NTREIS
- 2024-05-22 Price Changed $339,900 NTREIS
- 2024-05-07 Listed $344,900 NTREIS
- 2023-12-07 Pending — NTREIS
- 2023-12-01 Contingent — NTREIS
- 2023-12-01 Listing Removed — NTREIS
- 2023-11-27 Price Changed $329,900 NTREIS
- 2023-11-09 Price Changed $335,000 NTREIS
- 2023-11-09 Listed $329,900 NTREIS
- 2011-08-19 Listing Removed — NTREIS
- 2011-04-20 Listed $126,000 NTREIS
Property tax history
+4.6%/yrLatest (2025): $7,880 · +7.3% YoY. Source: county tax records.
Cash-flow waterfall
monthlySold comps — $/sqft
last 12 mo · ≤1 miLoading sold comps…