 🏗️ New Construction
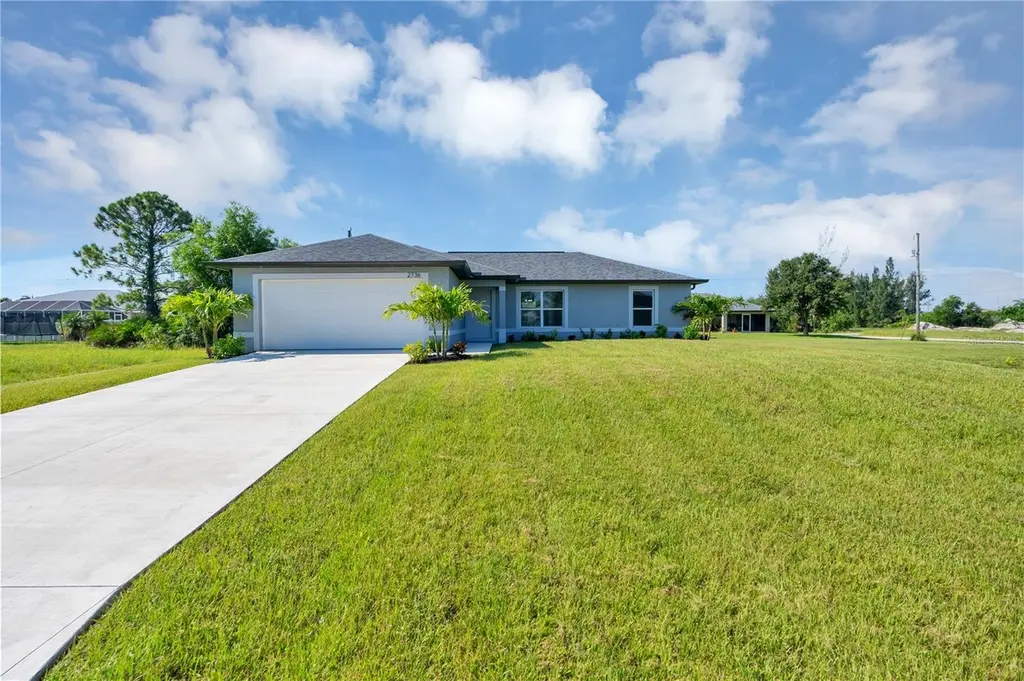
418 NW 13th Ter · Cape Coral, FL
Flood risk 4/10 · Minor
- FEMA flood zone
- X (unshaded)
- Chance of flooding over 30 yrs
- 0.13%
- Est. flood insurance / yr
- $507 – $1,088
Fire risk 1/10 · Minimal
- Est. fire insurance / yr
- $947 – $1,759
Heat risk 10/10 · Severe
- Hot days now (above 107°F)
- 7 days/yr
- Hot days in 30 yrs
- 29 days/yr
Wind risk 10/10 · Severe
- Chance of severe wind over 30 yrs
- 99.0%
Air-quality risk 2/10 · Minimal
- Unhealthy air days now
- 1 days/yr
- Unhealthy air days in 30 yrs
- 1 days/yr
Risk factors via First Street. Map © Google.
Why this score? — see what drove the D- grade
The composite is a weighted blend of 9 inputs, each scored 0–100. Each bar is that input's sub-score; the figure is the points it added to the 100-point composite (weight × sub-score).
- Cash flow +11.5/30.0
- ARV discount +7.5/15.0
- Schools +4.1/10.0
- Livability +3.9/5.0
- DSCR +3.4/10.0
- Condition / age +2.5/5.0
- 1% rule +2.1/10.0
- Rent growth +1.1/5.0
- Appreciation +0.0/10.0
$299,900
🖨 Deal sheet (PDF) 📄 Offer letter ✓ Due diligence
Listing remarks MLS
Under Construction. Brand new construction located in a growing NW Cape Coral neighborhood! This well-designed home features an open floor plan, all porcelain tile flooring throughout (no carpet), and a spacious primary suite with dual closets and dual sinks in the master bath. Enjoy a covered lanai perfect for relaxing or entertaining. Conveniently located near Trafalgar Middle School, with nearby dining options including Miceli’s Restaurant and Yucatan Waterfront Bar & Grill. Outdoor lovers will appreciate proximity to Joe Stonis Park. Don’t miss your opportunity to own a beautiful new home in one of Cape Coral’s fastest-growing areas!
Key facts
- Open floor plan
- New construction
- Covered lanai
Tags
Property features AI
Finance
- Other: Property zoned R1-D; Total acreage: under 1/4 acre (lot size 0.23 acres); Living area reported by builder: 1,310 square feet (building area total 1,874 square feet)
- HOA & community: No association specified
Exterior
- Parking: Attached garage; 2 garage spaces
- Utilities: Well water; Septic tank; Cable available; Electricity available and connected
- Home design: Single family residence; One story; New construction (projected completion May 31, 2026); Facing south; Under construction
- Construction: Stucco construction; Shingle roof; Slab foundation; Builder: Add Value Development LLC; Builder model: Nicole Rose; Builder license CGC1514828; Permit BRC24-002742; Built as new construction (projected completion 2026)
- Exterior features: Hurricane shutters; Asphalt road frontage; Lot dimensions 80 x 125
Interior
- Kitchen: Dishwasher; Disposal; Microwave; Range; Refrigerator; Electric water heater
- Bedrooms: 3 bedrooms
- Flooring: Tile
- Bathrooms: 2 full bathrooms
- Heating & cooling: Electric heating; Central air conditioning
- Interior features: Living room/dining room combo; Split bedroom layout; Stone counters; Thermostat; Vaulted ceilings
- Laundry & utility: Washer hookup; Electric dryer hookup; Laundry inside
Neighborhood map
What this means for you Summary
Snapshot
- This is a 3-bed/2.0-bath land listed at $300k.
Deal economics
- At list price, monthly cash flow is $-100 ($-1k/yr) — negative.
- To cash-flow at today's rent, offer at most $282k (5.9% below list).
- To meet the 1% rule (rent ≥ 1% of price), the offer needs to be $214k (28.6% below list).
- Recommended offer: $214k (28.6% below list) — sets the bar for 1% rule.
- Cap rate 5.9% vs local median 3.1% in Cape Coral — top-decile yield for the area; either an underpriced asset or a hidden risk that comps aren't pricing in. Stress-test before assuming the spread holds.
Location & tenants
- Location reads 77/100 on livability (#208 in FL, #3,098 nationally) — a middle-class / working-renter tenant base. Strengths: housing A+, health & safety A+, amenities B+; Watch: commute F.
- Lee (suburban): math 47% / reading 50% proficiency, ranked #42 of 73 in FL (top 58%) — families likely to look elsewhere, expect single-tenant / working-renter base with shorter leases.
- Zoned schools: Gulf Elementary School (math 70% / reading 65%, grade B+, #435 of 2,144 statewide, top 21%, 1,231 students, 38% FRL); Challenger Middle School (math 59% / reading 56%, grade B, #157 of 571 statewide, top 28%, 1,124 students, 50% FRL); Ida S. Baker High School (math 44% / reading 47%, grade D-, #223 of 667 statewide, top 34%, 1,933 students, 39% FRL) — zoned schools average 42% FRL vs 57% district-wide (15 pts lower); this property's tenant base skews higher-income than the district average.
- Market conditions: Rents falling (-5.5%/yr); 2671 active listings in the ZIP; 40 comparable units currently listed for rent nearby; rentals at typical pace (median 18d on market — plan ~3-4 weeks tenant-placement turnaround); solid renter incomes; 15,411 units permitted in Lee County in 2024 (4,686 in 5+ unit buildings).
Forward outlook
- Local home prices are declining (-3.0%/yr); year-one equity from $2k of loan paydown is wiped out by about $9k of value loss. Plan a longer hold.
- Lee County population projected at +44% by 2050 — long-run rental-demand tailwind backs the buy-and-hold thesis.
Negotiation context
- It's been on market 55 days — a 3% lower offer ($291k) is reasonable based on typical stale-listing flexibility.
- 2 sale attempts with the ask held roughly flat each time — persistent listings suggest the price (not the market) is what's stuck; bring a comps-based counter.
Risks & watch-outs
- Climate carrying-cost: severe wind risk, 99% chance of damaging wind over 30y; extreme-heat days projected 7→29/yr by 2055 (HVAC capex compounding) — expect insurance premiums to compound above CPI over the hold.
Questions for the listing agent
- What do current leases actually rent for vs. the listed asking? Can we see a recent rent roll and the last 12 months of T-12 income?
- It's been on market 55 days. Have you received any prior offers? Is the seller open to a 29% concession, seller financing, or rate buy-down credit?
- Is there a deadline driving the sale (1031 exchange, divorce, estate, relocation)? That informs how much negotiation room exists.
- Schools are B-rated — typically a magnet for longer-tenancy family renters. What's the average tenant stay here, and is there a school-zone premium baked into asking?
- The area grade is low — what's the realistic commute time and amenity access for the typical tenant pool here? Any planned neighborhood developments (good or bad) we should know about?
- What's the average days-on-market for RENTAL listings here right now (not sales)? A rising rental-DOM trend means longer vacancies and softer asking-rent achievability than the comps imply.
- What's the recent tenant-quality profile in this submarket — average credit score on applications, eviction rate, late-payment / NSF rate, and stable-employment percentage? A property-management company in the area should have these aggregated.
- How much new for-sale + rental construction is in the pipeline within 1–3 miles? Heavy new supply typically softens prices + rents 12–24 months out; constrained supply supports both.
Investment metrics
- 1% rule
- 0.71% ✗
- Cap rate
- 5.89%
- Cash-on-cash
- -1.43%
- DSCR
- 0.94
- GRM
- 11.7
CMA / ARV
No comps found within radius.
Projected returns pro-forma
-3.0% appreciation · 0.0% rent growth · sell at horizon
- IRR
- -21.6%
- Equity multiple
- 0.27×
- Total profit
- $-61,377
- Equity at exit
- $44,716
- IRR
- -23.2%
- Equity multiple
- -0.03×
- Total profit
- $-86,464
- Equity at exit
- $25,930
Cash invested: $83,972 (down + closing). Projections, not guarantees.
Landlord ↔ Tenant lean methodology
- Overall (STATE)
- 87 Strongly Landlord-Friendly
- State Florida
- 87 Strongly Landlord-Friendly · R+3
- County
- — inherits STATE
- City
- — inherits STATE
ZIP-level market 33993
- Home prices YoY
- -14.1%
- Rents YoY
- -5.5%
- Active inventory
- 2671
- Price-to-rent
- 11.7×
Monthly cashflow live
- Estimated rent
- $2,141 high interval (Pro) →
- Mortgage (P&I)
- −$1,573
- Tax from tax record
- −$94 /mo · $1,127/yr
- Insurance
- −$125
- HOA
- −$0
- Vacancy / Maint / Mgmt
- −$450
- Net cashflow
- $-100
Break-even live
Sensitivity live
| Price | -10% $70 | -5% $-15 | +0% $-100 | +5% $-185 | +10% $-270 |
|---|---|---|---|---|---|
| Rent | -10% $-269 | -5% $-185 | +0% $-100 | +5% $-15 | +10% $69 |
| Rate | -1.0pp $51 | -0.5pp $-24 | base $-100 | +0.5pp $-178 | +1.0pp $-257 |
UW: 25.0% down · 7.5% · 30yr · 1.5% tax · 5.0% vac · 8.0% maint · 8.0% mgmt
Financing live
Cash to close
- Down payment
- $74,975
- Closing costs
- $8,997
- Reserves months
- —
- Total cash needed
- —
Loan-product check · same deal, 3 products live
Conventional
25% down · 7.5% · 30yr
- Down + closing
- —
- Monthly P&I
- —
- Monthly cashflow
- —
- DSCR
- —
- Eligible?
- —
Personal DTI + credit; lowest rate.
DSCR
20% down · 8.5% · 30yr
- Down + closing
- —
- Monthly P&I
- —
- Monthly cashflow
- —
- DSCR
- —
- Eligible?
- —
No personal income docs; deal must DSCR.
Hard money
10% down · 12.0% · 12mo
- Down + closing
- —
- Monthly P&I
- —
- Monthly cashflow
- —
- DSCR
- —
- Eligible?
- —
Short-term bridge; refi at stabilization.
Rent comps 40 comps
| Address | Beds | Baths | Sqft | Rent | $/sqft | DOM | Units | Dist |
|---|---|---|---|---|---|---|---|---|
| 411 NW 13th St Cape Coral, FL | 3.0 | 2.0 | 1408 | $2,035 | $1.45 | 5d | 1 | 0.03mi |
| 1156 NW 5th Pl Cape Coral, FL | 3.0 | 2.0 | 1458 | $1,695 | $1.16 | 21d | 1 | 0.14mi |
| 1143 NW 4th Pl Cape Coral, FL | 3.0 | 2.0 | 1399 | $1,750 | $1.25 | 5d | 1 | 0.15mi |
| 521 NW 14th Ter Cape Coral, FL | 4.0 | 2.0 | 1737 | $1,821 | $1.05 | 5d | 1 | 0.20mi |
| 1618 NW 5th Pl Cape Coral, FL | 4.0 | 3.0 | 1765 | $3,300 | $1.87 | 25d | 1 | 0.45mi |
| 101 NW 13th St Cape Coral, FL | 3.0 | 2.0 | 1557 | $2,150 | $1.38 | 25d | 1 | 0.47mi |
| 1140 NW 1st Ave Cape Coral, FL | 3.0 | 2.0 | 1452 | $1,850 | $1.27 | 25d | 1 | 0.48mi |
| 1140 NW 1st Ave Cape Coral, FL | 3.0 | 2.0 | 1452 | $1,850 | $1.27 | 16d | 1 | 0.48mi |
| 1406 NW 8th Pl Cape Coral, FL | 3.0 | 2.0 | 1403 | $1,855 | $1.32 | 25d | 1 | 0.50mi |
| 1411 NW 9th Ave Cape Coral, FL | 4.0 | 2.0 | 1760 | $2,150 | $1.22 | 15d | 1 | 0.53mi |
| 1113 NW 1st Ave Cape Coral, FL | 3.0 | 2.0 | 1286 | $1,626 | $1.26 | 5d | 1 | 0.55mi |
| 526 NW 9th St Cape Coral, FL | 4.0 | 2.0 | 1800 | $2,100 | $1.17 | 5d | 1 | 0.58mi |
| 217 NW 9th St Cape Coral, FL | 3.0 | 2.0 | 1756 | $2,271 | $1.29 | 5d | 1 | 0.60mi |
| 1217 Santa Barbara Blvd N Cape Coral, FL | 3.0 | 2.0 | 1790 | $2,300 | $1.28 | 25d | 1 | 0.63mi |
| 318 NW 8th Ter Cape Coral, FL | 3.0 | 2.0 | 1500 | $1,900 | $1.27 | 4d | 1 | 0.65mi |
| 227 Tropicana Pkwy W Cape Coral, FL | 4.0 | 2.0 | 1833 | $1,995 | $1.09 | 3d | 1 | 0.71mi |
| 419 NW 7th Ter Cape Coral, FL | 3.0 | 2.0 | 1161 | $4,500 | $3.88 | 5d | 1 | 0.73mi |
| 1831 NW 6th Ave Cape Coral, FL | 4.0 | 2.0 | 1833 | $1,795 | $0.98 | 3d | 1 | 0.79mi |
| 1834 NW 6th Ave Cape Coral, FL | 3.0 | 2.0 | 1200 | $1,530 | $1.27 | 23d | 1 | 0.81mi |
| 1834 NW 6th Ave Cape Coral, FL | 3.0 | 2.0 | 1200 | $1,575 | $1.31 | 25d | 1 | 0.81mi |
| 910 NW 8th Ter Cape Coral, FL | 3.0 | 2.0 | 1619 | $2,100 | $1.30 | 17d | 1 | 0.87mi |
| 1322 NE 2nd Pl Cape Coral, FL | 3.0 | 2.0 | 1666 | $1,900 | $1.14 | 25d | 1 | 0.91mi |
| 1120 NW 11th Pl Cape Coral, FL | 3.0 | 2.0 | 1528 | $1,816 | $1.19 | 15d | 1 | 0.92mi |
| 2000 NW 7th Ave Cape Coral, FL | 4.0 | 2.0 | 1708 | $1,950 | $1.14 | 16d | 1 | 0.95mi |
| 2000 NW 7th Ave Cape Coral, FL | 4.0 | 2.0 | 1708 | $1,950 | $1.14 | 25d | 1 | 0.95mi |
| 1109 NE 2nd Pl Cape Coral, FL | 3.0 | 2.0 | 1272 | $1,900 | $1.49 | 25d | 1 | 0.97mi |
| 1114 NE 3rd Ave Cape Coral, FL | 3.0 | 2.0 | 1558 | $2,750 | $1.77 | 25d | 1 | 0.99mi |
| 306 NE 14th Ter Cape Coral, FL | 3.0 | 2.0 | 1410 | $1,595 | $1.13 | 12d | 1 | 1.02mi |
| 639 NE Juanita Pl Cape Coral, FL | 3.0 | 2.0 | 1116 | $1,700 | $1.52 | 21d | 1 | 1.03mi |
| 1913 NE Juanita Pl Cape Coral, FL | 4.0 | 2.0 | 1695 | $2,395 | $1.41 | 16d | 1 | 1.05mi |
| 213 NW 5th St Cape Coral, FL | 4.0 | 2.0 | 1809 | $2,195 | $1.21 | 5d | 1 | 1.08mi |
| 507 NW 1st Ave Cape Coral, FL | 4.0 | 2.0 | 1695 | $2,395 | $1.41 | 25d | 1 | 1.13mi |
| 309 NE 17th St Cape Coral, FL | 3.0 | 2.0 | 1850 | $3,100 | $1.68 | 25d | 1 | 1.14mi |
| 314 NE 17th St Cape Coral, FL | 4.0 | 2.0 | 1734 | $2,216 | $1.28 | 5d | 1 | 1.15mi |
| 222 NW 4th Ter Cape Coral, FL | 4.0 | 2.0 | 1695 | $2,450 | $1.45 | 25d | 1 | 1.16mi |
| 1221 NE 4th Ave Cape Coral, FL | 3.0 | 2.0 | 1614 | $1,995 | $1.24 | 15d | 1 | 1.18mi |
| 2103 NW 10th Ave Cape Coral, FL | 3.0 | 2.0 | 1455 | $2,200 | $1.51 | 25d | 1 | 1.21mi |
| 1228 NE 4th Pl Cape Coral, FL | 3.0 | 2.0 | 1860 | $2,500 | $1.34 | 25d | 1 | 1.21mi |
| 2227 NW 3rd Pl Cape Coral, FL | 3.0 | 3.0 | 1771 | $1,999 | $1.13 | 16d | 1 | 1.23mi |
| 2227 NW 3rd Pl Cape Coral, FL | 3.0 | 2.5 | 1771 | $1,799 | $1.02 | 25d | 1 | 1.23mi |
Listing history 6 events
-
2026-05-19status Pending 669-char remark
Show marketing remark (669 chars)
Under Construction. Brand new construction located in a growing NW Cape Coral neighborhood! This well-designed home features an open floor plan, all porcelain tile flooring throughout (no carpet), and a spacious primary suite with dual closets and dual sinks in the master bath. Enjoy a covered lanai perfect for relaxing or entertaining. Conveniently located near Trafalgar Middle School, with nearby dining options including Miceli’s Restaurant and Yucatan Waterfront Bar & Grill. Outdoor lovers will appreciate proximity to Joe Stonis Park. Don’t miss your opportunity to own a beautiful new home in one of Cape Coral’s fastest-growing areas!
-
2026-05-19status Pending
Show marketing remark (669 chars)
Under Construction. Brand new construction located in a growing NW Cape Coral neighborhood! This well-designed home features an open floor plan, all porcelain tile flooring throughout (no carpet), and a spacious primary suite with dual closets and dual sinks in the master bath. Enjoy a covered lanai perfect for relaxing or entertaining. Conveniently located near Trafalgar Middle School, with nearby dining options including Miceli’s Restaurant and Yucatan Waterfront Bar & Grill. Outdoor lovers will appreciate proximity to Joe Stonis Park. Don’t miss your opportunity to own a beautiful new home in one of Cape Coral’s fastest-growing areas!
-
2026-04-07price $299,900 669-char remark
Show marketing remark (669 chars)
Under Construction. Brand new construction located in a growing NW Cape Coral neighborhood! This well-designed home features an open floor plan, all porcelain tile flooring throughout (no carpet), and a spacious primary suite with dual closets and dual sinks in the master bath. Enjoy a covered lanai perfect for relaxing or entertaining. Conveniently located near Trafalgar Middle School, with nearby dining options including Miceli’s Restaurant and Yucatan Waterfront Bar & Grill. Outdoor lovers will appreciate proximity to Joe Stonis Park. Don’t miss your opportunity to own a beautiful new home in one of Cape Coral’s fastest-growing areas!
-
2026-04-07price $299,900
Show marketing remark (669 chars)
Under Construction. Brand new construction located in a growing NW Cape Coral neighborhood! This well-designed home features an open floor plan, all porcelain tile flooring throughout (no carpet), and a spacious primary suite with dual closets and dual sinks in the master bath. Enjoy a covered lanai perfect for relaxing or entertaining. Conveniently located near Trafalgar Middle School, with nearby dining options including Miceli’s Restaurant and Yucatan Waterfront Bar & Grill. Outdoor lovers will appreciate proximity to Joe Stonis Park. Don’t miss your opportunity to own a beautiful new home in one of Cape Coral’s fastest-growing areas!
-
2026-03-25$304,900 Active 669-char remark
Show marketing remark (669 chars)
Under Construction. Brand new construction located in a growing NW Cape Coral neighborhood! This well-designed home features an open floor plan, all porcelain tile flooring throughout (no carpet), and a spacious primary suite with dual closets and dual sinks in the master bath. Enjoy a covered lanai perfect for relaxing or entertaining. Conveniently located near Trafalgar Middle School, with nearby dining options including Miceli’s Restaurant and Yucatan Waterfront Bar & Grill. Outdoor lovers will appreciate proximity to Joe Stonis Park. Don’t miss your opportunity to own a beautiful new home in one of Cape Coral’s fastest-growing areas!
-
2026-03-25$304,900 Active
Show marketing remark (669 chars)
Under Construction. Brand new construction located in a growing NW Cape Coral neighborhood! This well-designed home features an open floor plan, all porcelain tile flooring throughout (no carpet), and a spacious primary suite with dual closets and dual sinks in the master bath. Enjoy a covered lanai perfect for relaxing or entertaining. Conveniently located near Trafalgar Middle School, with nearby dining options including Miceli’s Restaurant and Yucatan Waterfront Bar & Grill. Outdoor lovers will appreciate proximity to Joe Stonis Park. Don’t miss your opportunity to own a beautiful new home in one of Cape Coral’s fastest-growing areas!
ⓘ Source: listings_history table (triggers on properties + properties_extension) + one-shot
backfill from property_details.listing_events for pre-trigger history.
Tax reassessment forecast FL · Resets to sale price
- Current annual tax
- $1,127 · $94/mo
- Projected year-2 tax
- $2,489 · $207/mo
- Expected delta
- +$1,362/yr (+$114/mo · 120.9%)
ⓘ Screening estimate from a state-policy table — verify with the county assessor before closing.
Climate risk First Street
- Flood 4/10 Moderate FEMA zone X (unshaded) · 13% chance over 30 yrs
- Wildfire 1/10 Low
- Heat 10/10 Extreme 7 d/yr ≥107°F today · 29 d/yr by 30 yrs out
- Wind 10/10 Extreme 99% chance of damaging wind over 30 yrs
- Air quality 2/10 Low 1 unhealthy d/yr today · 1 by 30 yrs out
Nearby sold comps map
Loading sold comps map…
Walkable amenities ~0.75 mi
Loading nearby amenities…
Taxation est. · year 1
- Rental income
- $25,695
- − Mortgage interest
- −$16,799
- − Property taxes
- −$1,127
- − Insurance
- −$1,500
- − Repairs & maintenance
- −$2,056
- − Management
- −$2,056
- − Depreciation
- −$8,724
- Taxable loss
- −$6,565
- Est. tax savings @ 24.0%
- +$1,576
- After-tax cash flow
- $376/yr
For passive investors: Depreciation is non-cash, so a rental often shows a tax loss while cash-flowing — sheltering income. Rental losses are passive: they offset passive income freely, and up to $25,000/yr can offset ordinary (W-2) income if you actively participate and your MAGI is under $100k (phasing out to $0 by $150k); unused losses carry forward. On sale, claimed depreciation is recaptured at up to 25%, and gains may owe capital-gains tax (a 1031 exchange can defer both). Figures are a year-1 estimate at your 24.0% rate — not tax advice; consult a CPA.
Schools (NCES district)
- District
- Lee
- NCES district ID
- 1201080
- Math proficiency
- 47% ▼ -11.00%
- Reading proficiency
- 50% ▼ -4.00%
- Median HH income
- $49,518
- Composite
- 41.49/100
- National rank
- #3458
- State rank
- #42 of 73 in FL
Livability — Cape Coral
- Score
- 77/100
- State rank
- #208
- US rank
- #3098
Category grades
Schools grade is shown separately in the Schools card above.
Census & demographics
- Census place
- Cape Coral, FL
- County
- Lee County · 788,662 people
- City population
- 217,388
- Metro
- Cape Coral-Fort Myers, FL
- Population (ZIP)
- 35,580
- Household income
- $90,577
- Rent vs Own
- Severe rent burden
- 286.0
Population outlook (Lee County) Hauer SSP2
- Today (2025)
- 871,946 people
- By 2030
- 955,468 · +9.6%
- By 2040
- 1,113,587 · +27.7%
- By 2050
- 1,256,891 · +44.1%
- By 2075
- 1,560,270 · +78.9%
- By 2100
- 1,726,848 · +98.0%
Race, ethnicity, and origin ACS 2023
- Neighborhood character
- Diverse neighborhood (Simpson 0.58)
- Race & ethnicity
- White 57% Hispanic / Latino 30% Two or more races 21% Black 7% Asian 2%
- Hispanic origin (detail)
- Mexican 2% Puerto Rican 6% Cuban 17% Dominican 1%
- Common ancestry
- Romanian 2% Hispanic 2% Lithuanian 2%
- Foreign-born
- 21% · Canada, Jamaica, China
- Languages at home
- 73% English-only · Spanish 24% French/Haitian/Cajun 1% Russian/Polish/Slavic 1%
Political lean MEDSL · Lee
- 2024 margin
- Strong R (+28.4) · D 35.5% · R 63.9%
- 2008→2024 swing
- -18.0pp toward R · 2008: -10.4pp · 2024: -28.4pp
- All cycles
- 2024: R+28.4 2020: R+19.2 2016: R+20.4 2012: R+16.6 2008: R+10.4
Not yet ingested
- Civics
- —
Market trends
- HPI YoY
- ▼ -55.34%
- Current HPI
- 337.0575
- Rent YoY
- ▼ -5.51%
- Metro
- Cape Coral-Fort Myers, FL
- State GDP YoY
- ▲ 3.28%
- F500 in state
- 36
Industry mix (Fortune 500 HQ in FL)
| Industry | F500 HQs | Revenue |
|---|---|---|
| Industrial Technology | 2 | $29B |
|
||
| Insurance | 2 | $17B |
|
||
| Retail | 1 | $60B |
|
||
| Technology Distribution | 1 | $58B |
|
||
| Homebuilding | 1 | $35B |
|
||
| Technology Manufacturing | 1 | $35B |
|
||
Price history
-1.6% since first listed6 events — show timeline
- 2026-05-19 Pending — FORTMLS
- 2026-05-19 Pending — Stellar MLS as Distributed by MLS Grid
- 2026-04-07 Price Changed $299,900 FORTMLS
- 2026-04-07 Price Changed $299,900 Stellar MLS as Distributed by MLS Grid
- 2026-03-25 Listed $304,900 Stellar MLS as Distributed by MLS Grid
- 2026-03-25 Listed $304,900 FORTMLS
Property tax history
+13.9%/yrLatest (2025): $1,127 · +40.9% YoY. Source: county tax records.
Cash-flow waterfall
monthlySold comps — $/sqft
last 12 mo · ≤1 miLoading sold comps…